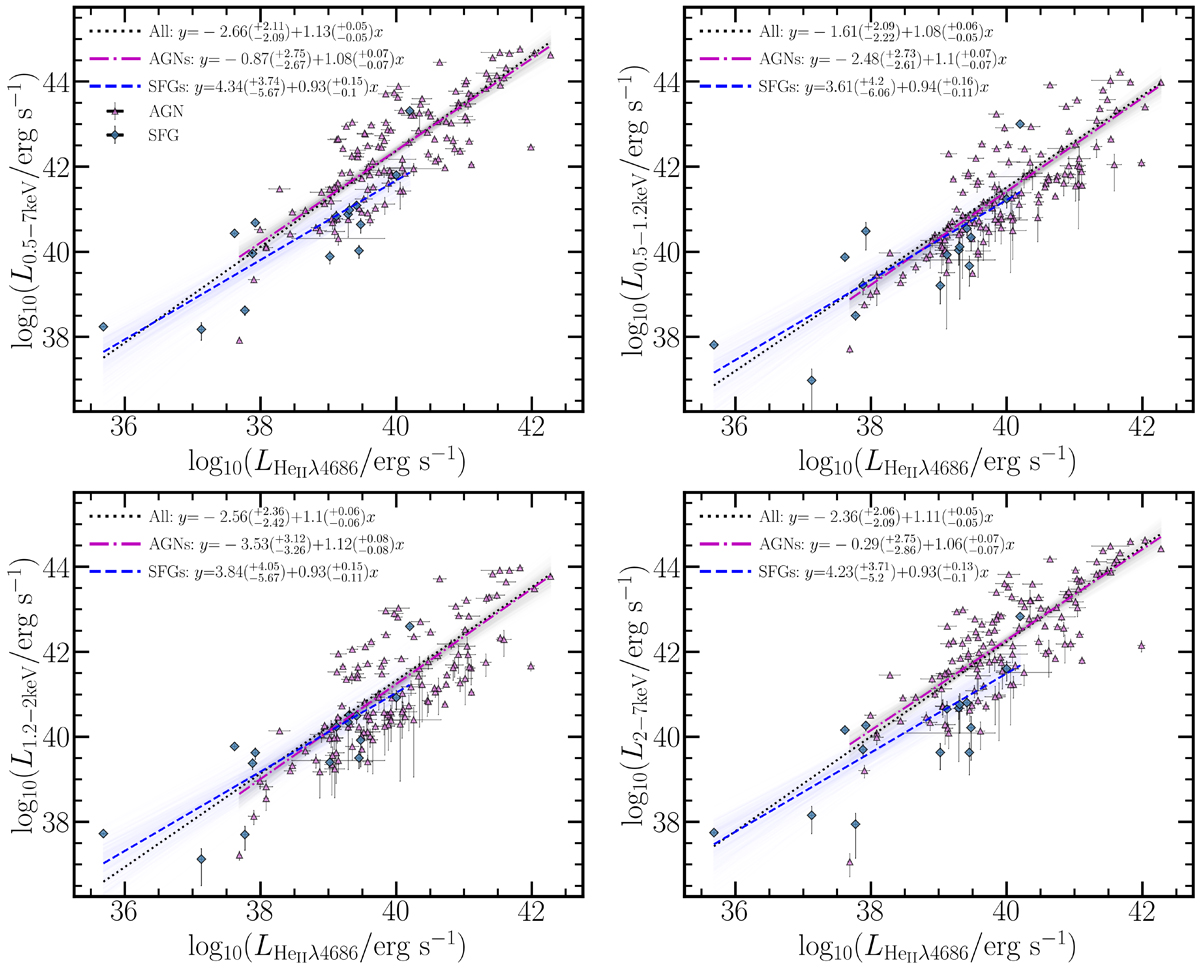
Fig. 5.
Download original image
X-ray as a function of He II luminosity for different X-ray energy bands in logarithmic space. The energy bands total, soft, medium, and hard appear from top to bottom and left to right respectively. The pink triangles and blue rhombuses show AGNs and SFGs respectively as adopted by this work (Section 3.1). The black dotted, purple dashed-dotted, and blue dashed lines correspond to the best results of MCMC fits involving all sources, AGNs, and SFGs respectively. The shaded areas with the same colors correspond to the uncertainties of the respective fits. The results of the MCMC fits are presented at the top of each plot and are summarized in Table 1.
Current usage metrics show cumulative count of Article Views (full-text article views including HTML views, PDF and ePub downloads, according to the available data) and Abstracts Views on Vision4Press platform.
Data correspond to usage on the plateform after 2015. The current usage metrics is available 48-96 hours after online publication and is updated daily on week days.
Initial download of the metrics may take a while.