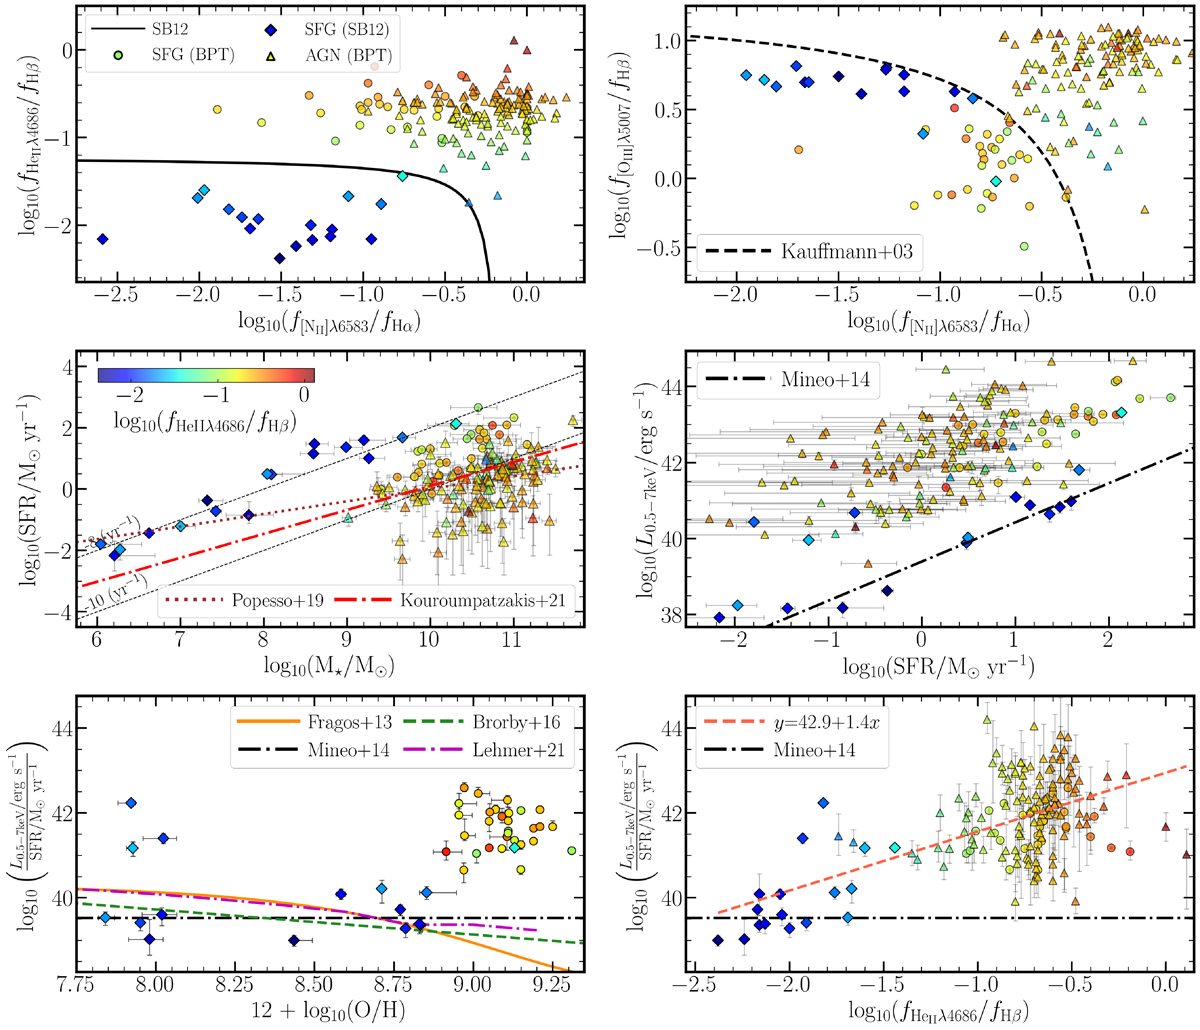
Fig. 1.
Download original image
Physical relations of galaxies emitting He II with SnR > 5.5, measured and cataloged by SB12, detected in X-rays and cataloged in the CSCv2.0. In all subplots, the points are color-coded based on the galaxies’ He II/Hβ ratio. The emission-line ratios have low uncertainties which are not plotted for clarity. BPT SFGs are represented by a circle, and BPT AGNs are represented by a triangle marker. SB12 SFGs are marked with a rhombus. Top left: He II/Hβ ratio as a function of the [N II]/Hα ratio. The black curve represents the SB12 classification curve separating AGNs (top right) from SFGs (bottom left). Top right: [O III]/Hβ as a function of the [N II]/Hα ratio, aka the BPT diagram. The dashed black line shows the Kauffmann et al. (2003) classification curve above which composite galaxies and AGNs are located. Middle left: SFR as a function of M⋆, aka the main sequence of SFGs. The brown-dotted, and red dashed-dotted lines represent the Popesso et al. (2019), and Kouroumpatzakis et al. (2021) main sequence fits respectively. Middle right: LX as a function of SFR. The black dashed-dotted line represents the Mineo et al. (2014) relation. Bottom left: LX/SFR as a function of metallicity. The orange continuous, black dashed-doted, green dashed, and magenta dashed-dotted lines represent the Fragos et al. (2013b), Mineo et al. (2014), Brorby et al. (2016), and Lehmer et al. (2021) relations respectively. Bottom right: LX/SFR as a function of He II/Hβ ratio. The black dashed-dotted line represents the Mineo et al. (2014) relation. The red dashed line shows the best linear regression fit involving all sources regardless of their class.
Current usage metrics show cumulative count of Article Views (full-text article views including HTML views, PDF and ePub downloads, according to the available data) and Abstracts Views on Vision4Press platform.
Data correspond to usage on the plateform after 2015. The current usage metrics is available 48-96 hours after online publication and is updated daily on week days.
Initial download of the metrics may take a while.