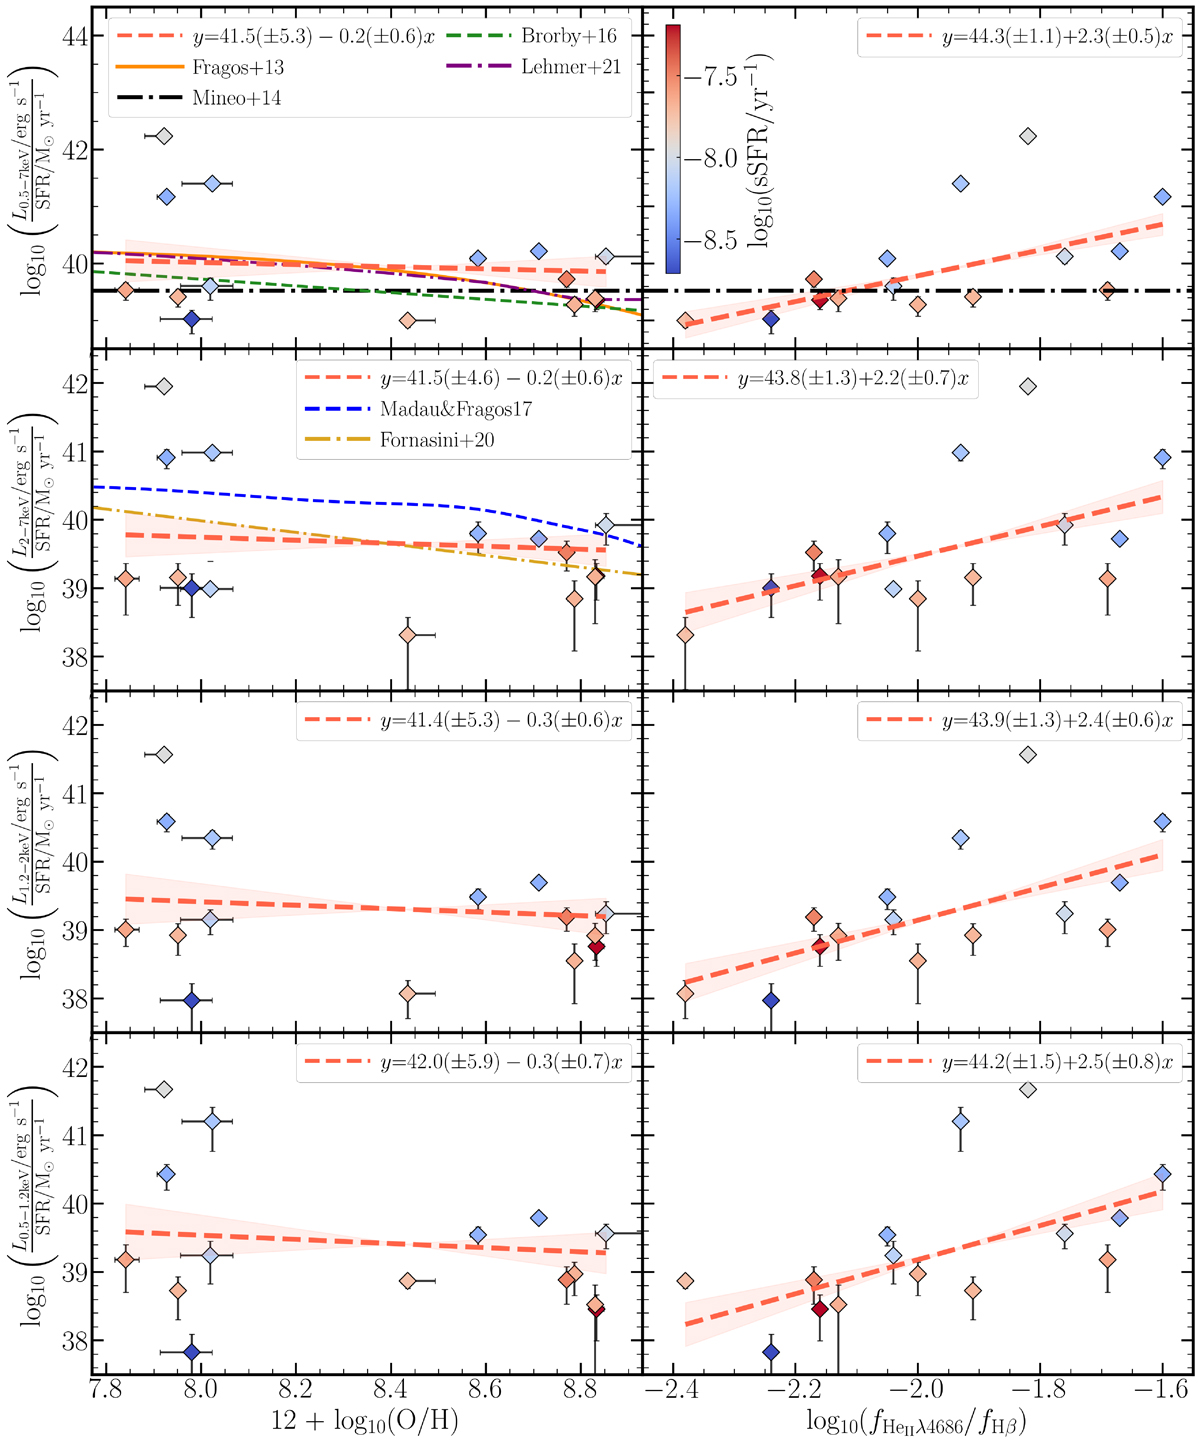
Fig. 4.
Download original image
LX/SFR as a function of metallicity (left column), or He II/Hβ ratio (right column) of SFGs classified by both the SB12 and BPT diagrams. The energy bands total, hard, medium, and soft appear from top to bottom respectively. All points are color-coded based on the galaxies’ sSFR. The red dashed line represents the best linear regression fit and the shaded area shows the uncertainties of the fit. The orange continuous, black dashed-doted line, green dashed, and purple dashed-dotted curves represent the Fragos et al. (2013b), Mineo et al. (2014), Brorby et al. (2016), and Lehmer et al. (2021) relations respectively. The blue dashed and the yellow dashed-dotted lines shown in the second row correspond to the Madau & Fragos (2017) and Fornasini et al. (2020) relations respectively.
Current usage metrics show cumulative count of Article Views (full-text article views including HTML views, PDF and ePub downloads, according to the available data) and Abstracts Views on Vision4Press platform.
Data correspond to usage on the plateform after 2015. The current usage metrics is available 48-96 hours after online publication and is updated daily on week days.
Initial download of the metrics may take a while.