Open Access
Fig. 3.
Download original image
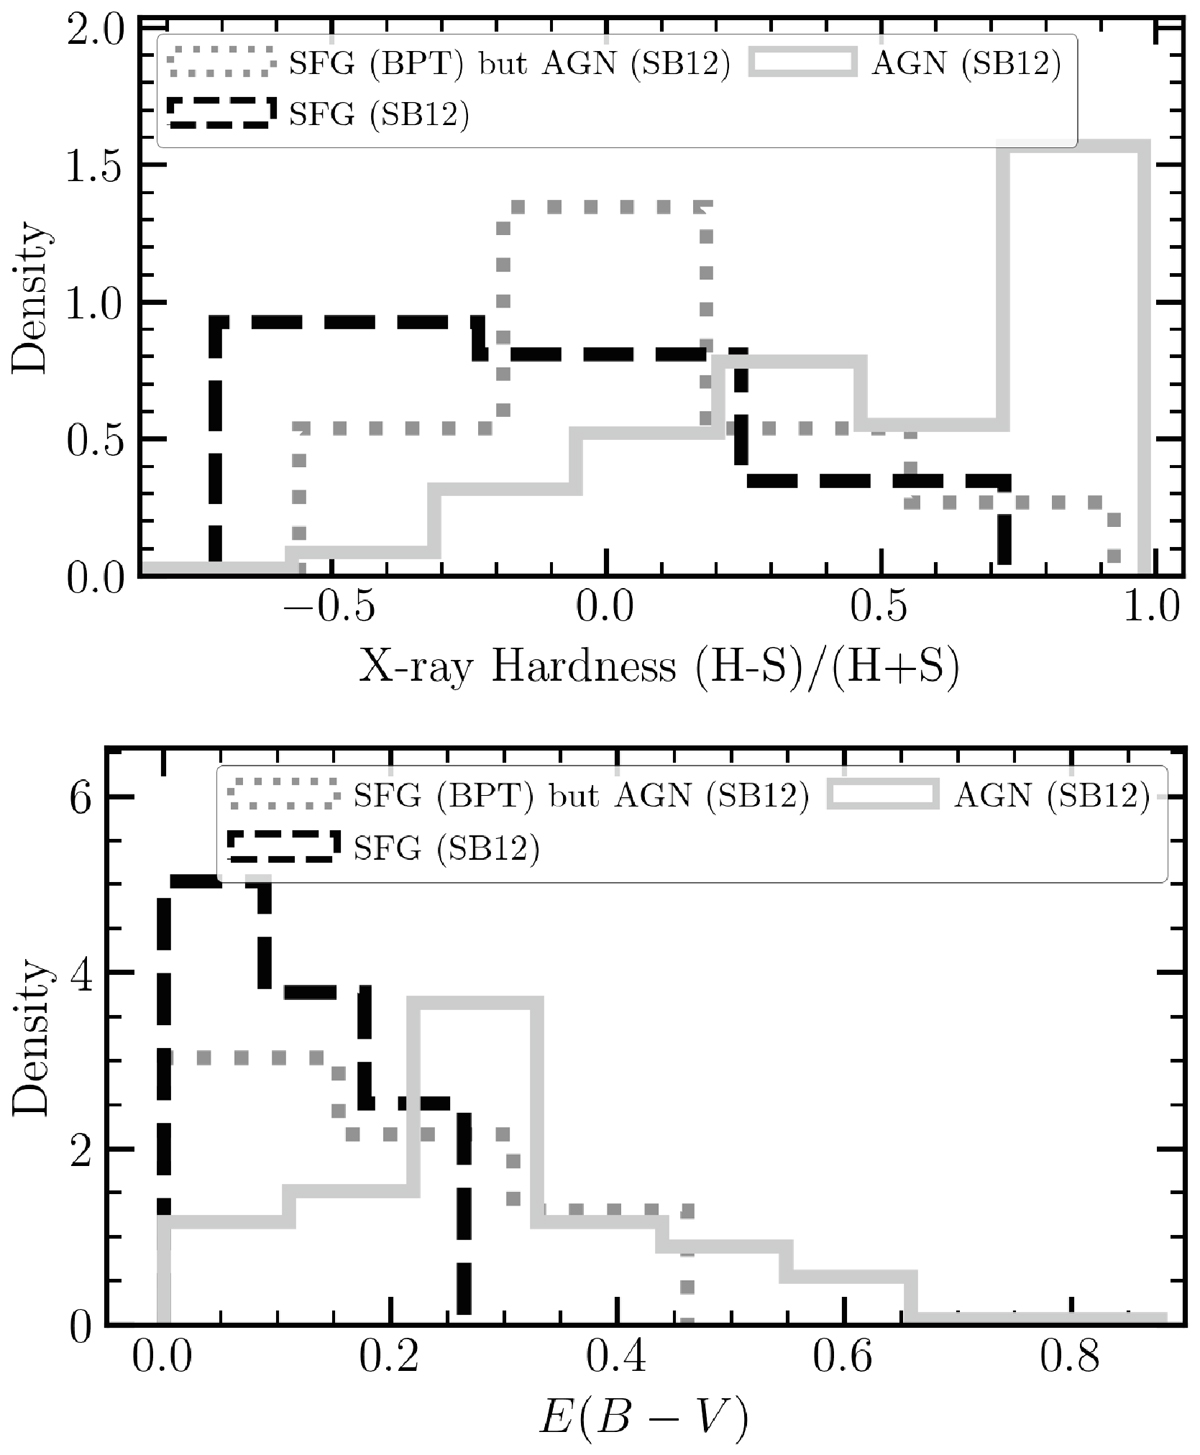
Histograms of the hardness ratio (top), and extinction (bottom) of our sample of He II and X-ray detected sources. The black dashed, and light gray continuous lines correspond to SB12 SFGs and AGNs. The gray dotted line represents sources classified as SFGs by BPT but AGNs by the SB12 diagram (NLS1s; Section 3.1).
Current usage metrics show cumulative count of Article Views (full-text article views including HTML views, PDF and ePub downloads, according to the available data) and Abstracts Views on Vision4Press platform.
Data correspond to usage on the plateform after 2015. The current usage metrics is available 48-96 hours after online publication and is updated daily on week days.
Initial download of the metrics may take a while.