Open Access
Fig. 2.
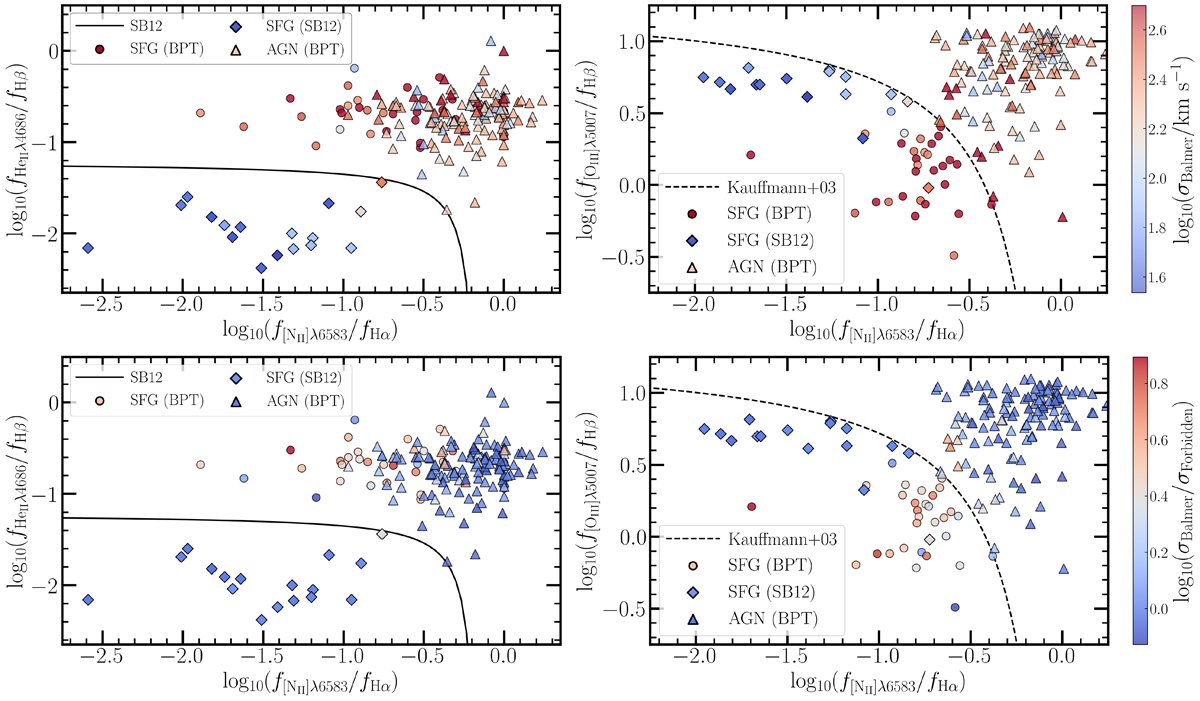
Download original image
Same plots as the upper plots of Figure 1 but color-coded based on the galaxies’ velocity dispersion (σ) of their Balmer lines (top), and the ratio of the velocity dispersions of the Balmer and forbidden lines (bottom).
Current usage metrics show cumulative count of Article Views (full-text article views including HTML views, PDF and ePub downloads, according to the available data) and Abstracts Views on Vision4Press platform.
Data correspond to usage on the plateform after 2015. The current usage metrics is available 48-96 hours after online publication and is updated daily on week days.
Initial download of the metrics may take a while.