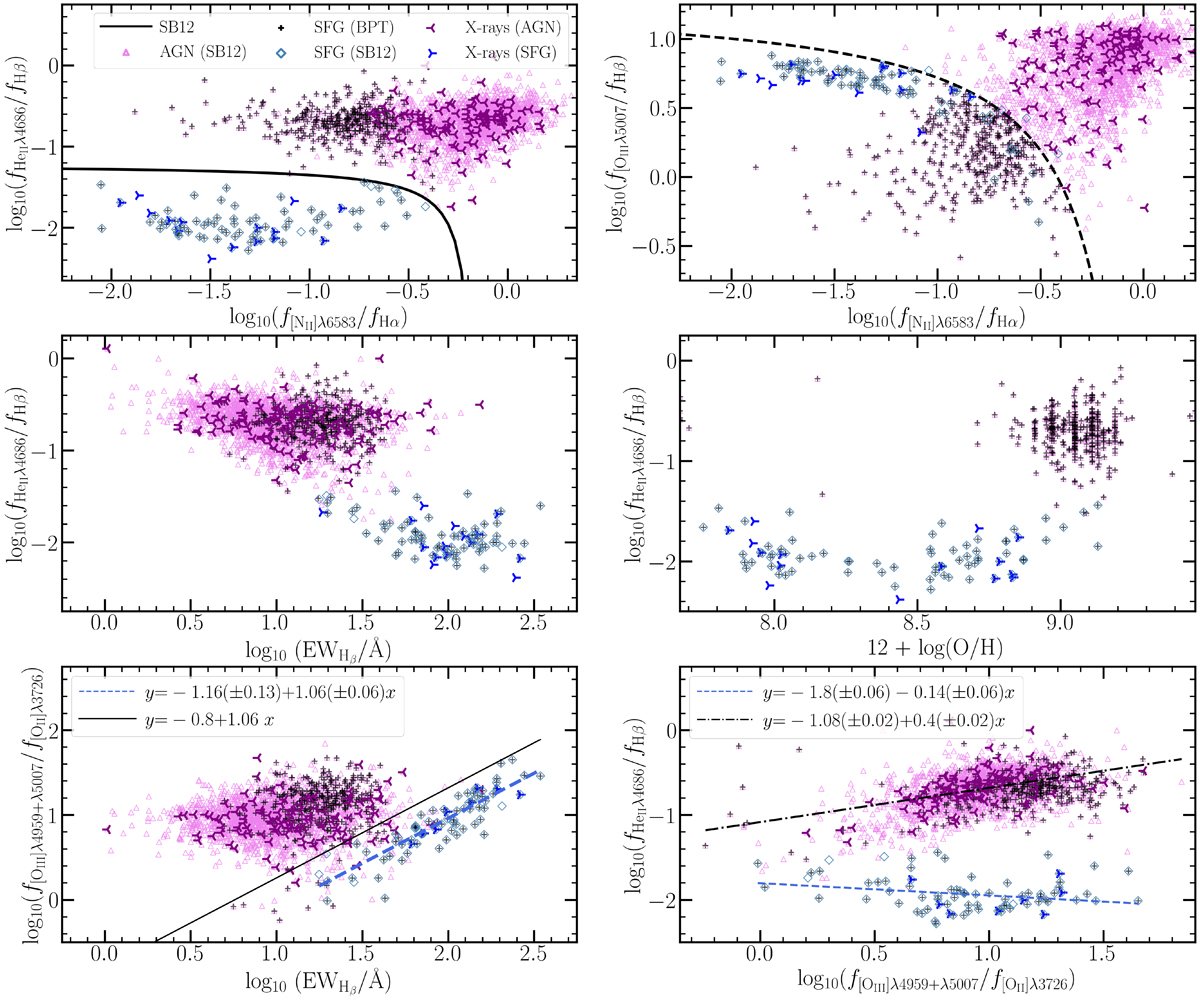
Fig. 6.
Download original image
Several comparisons of 2399 galaxies emitting He II with SnR > 5.5, measured and cataloged by SB12, and matched with the SDSS MPA-JHU catalog having S/N > 5 in all compared emission lines. SB12 SFGs and AGNs are represented by light blue rhombuses and violet triangles respectively. BPT SFGs are represented by a black cross. The X-ray-selected SFGs and AGNs (Section 3.1) are also shown with blue right-pointing and purple left-pointing triangles respectively. Top left: He II/Hβ over [N II]/Hα. The black curve represents the SB12 classification criterion separating AGN from SFGs. Top right: BPT [O III]/Hβ over [N II]/Hα diagram. The dashed black line shows the Kauffmann et al. (2003) classification criterion. Middle left: He II/Hβ as a function of EWHβ. Middle right: He II/Hβ as a function of metallicity. Bottom left: O32 as a function of EWHβ. The blue dashed line represents the best linear regression fit involving only BPT and SB12 SFGs. The black line represents a threshold above which only AGNs of our sample are located. Bottom right: He II/Hβ as a function of O32. The black dashed-dotted and blue dashed lines show the best linear regression fits involving solely SB12 AGNs or SFGs, respectively.
Current usage metrics show cumulative count of Article Views (full-text article views including HTML views, PDF and ePub downloads, according to the available data) and Abstracts Views on Vision4Press platform.
Data correspond to usage on the plateform after 2015. The current usage metrics is available 48-96 hours after online publication and is updated daily on week days.
Initial download of the metrics may take a while.