| Issue |
A&A
Volume 696, April 2025
|
|
|---|---|---|
| Article Number | A31 | |
| Number of page(s) | 16 | |
| Section | Interstellar and circumstellar matter | |
| DOI | https://doi.org/10.1051/0004-6361/202452835 | |
| Published online | 01 April 2025 | |
Shock-induced HCNH+ abundance enhancement in the heart of the starburst galaxy NGC 253 unveiled by ALCHEMI
1
Purple Mountain Observatory, and Key Laboratory of Radio Astronomy, Chinese Academy of Sciences,
10 Yuanhua Road,
Nanjing
210023, PR China
2
Max-Planck-Institut für Radioastronomie,
Auf dem Hügel 69,
53121
Bonn, Germany
3
Xinjiang Astronomical Observatory, Chinese Academy of Sciences,
830011
Urumqi,
PR China
4
Univ Rennes, CNRS,
IPR (Institut de Physique de Rennes) – UMR 6251,
35000
Rennes, France
5
Nantes Université, CNRS, CEISAM,
UMR 6230,
44000
Nantes, France
6
National Radio Astronomy Observatory,
520 Edgemont Road,
Charlottesville,
VA
22903-2475, USA
7
Department of Astronomy, University of Virginia,
PO Box 400325,
530 McCormick Road,
Charlottesville,
VA
22904-4325, USA
8
European Southern Observatory,
Alonso de Córdova, 3107,
Vitacura, Santiago
763-0355, Chile
9
Joint ALMA Observatory,
Alonso de Córdova, 3107,
Vitacura, Santiago
763-0355, Chile
10
National Astronomical Observatory of Japan,
2-21-1 Osawa,
Mitaka, Tokyo
181-8588, Japan
11
Institute of Astronomy and Astrophysics, Academia Sinica,
11F of AS/NTU Astronomy-Mathematics Building, No.1, Sec. 4, Roosevelt Road,
Taipei
10617, Taiwan
12
Department of Astronomy, School of Science, The Graduate University for Advanced Studies (SOKENDAI),
2-21-1 Osawa,
Mitaka, Tokyo
181-1855, Japan
13
Leiden Observatory, Leiden University,
PO Box 9513,
2300
RA Leiden, The Netherlands
14
Key Laboratory of Radio Astronomy, Chinese Academy of Sciences,
830011
Urumqi,
PR China
15
Department of Physics, Faculty of Science and Technology, Keio University,
3-14-1 Hiyoshi,
Yokohama, Kanagawa
223-8522,
Japan
16
Transdisciplinary Research Area (TRA) ‘Matter’/Argelander-Institut für Astronomie, University of Bonn,
Bonn,
Germany
17
Physics and Astronomy, University College London,
London,
UK
18
School of Astronomy & Space Science, Nanjing University,
163 Xianlin Avenue,
Nanjing
210023, PR China
19
Research Center for Intelligent Computing Platforms, Zhejiang Laboratory,
Hangzhou
311100, PR China
★ Corresponding author; This email address is being protected from spambots. You need JavaScript enabled to view it.
Received:
31
October
2024
Accepted:
26
February
2025
Abstract
Context. Understanding the chemistry of molecular clouds is pivotal to elucidate star formation and galaxy evolution. As one of the important molecular ions, HCNH+ plays an important role in this chemistry. Yet, its behavior and significance under extreme conditions, such as in the central molecular zones (CMZs) of external galaxies, are still largely unexplored.
Aims. We aim to reveal the physical and chemical properties of the CMZ in the starburst galaxy NGC 253 with multiple HCNH+ transitions to shed light on the molecule’s behavior under the extreme physical conditions of a starburst.
Methods. We employed molecular line data including results for four rotational transitions of HCNH+ from the ALMA Comprehensive High-resolution Extragalactic Molecular Inventory (ALCHEMI) large program to investigate underlying physical and chemical processes.
Results. Despite weak intensities, HCNH+ emission is widespread throughout NGC 253’s CMZ, which suggests that this molecular ion can effectively trace large-scale structures within molecular clouds. Using the quantum mechanical coupled states’ approximation, we computed rate coefficients for collisions of HCNH+ with para-H2 and ortho-H2 at kinetic temperatures up to 500 K. Using these coefficients in a non-local-thermodynamic-equilibrium (non-LTE) modeling framework and employing a Monte Carlo Markov chain analysis, we find that HCNH+ emission originates from regions with H2 number densities of ∼ 102.80−103.55 cm−3, establishing HCNH+ as a tracer of low-density environments. Our analysis reveals that most of the HCNH+ abundances in the CMZ of NGC 253 are higher than all values reported in the Milky Way. We perform static, photodissociation region, and shock modeling, and found that recurrent shocks could potentially account for the elevated HCNH+ abundances observed in this CMZ.
Conclusions. We propose that the unexpectedly high HCNH+ abundances may result from chemical enhancement, primarily driven by the elevated gas temperatures and cosmic ray ionization rates of shocked, low-density gas in the nuclear starburst regions of NGC 253.
Key words: ISM: clouds / ISM: molecules / radio lines: ISM / ISM: individual objects: NGC 253
© The Authors 2025
 Open Access article, published by EDP Sciences, under the terms of the Creative Commons Attribution License (https://creativecommons.org/licenses/by/4.0), which permits unrestricted use, distribution, and reproduction in any medium, provided the original work is properly cited.
This article is published in open access under the Subscribe to Open model.
Open Access funding provided by Max Planck Society.
1 Introduction
Understanding the chemistry of molecular clouds in various environments affected by different physical and chemical boundary conditions is pivotal for gaining insights into star formation and galaxy evolution. Molecular ions are crucial in shaping the chemistry of molecular clouds through ion-neutral reactions (e.g., Agúndez & Wakelam 2013). As the simplest protonated nitrile, HCNH+ was first detected in the interstellar medium (ISM) almost four decades ago (Ziurys & Turner 1986). Previous studies suggested that the abundance of HCNH+ varied with different stages of star formation (Fontani et al. 2021; Gong et al. 2023), indicating its potential as an evolutionary signpost. Numerical simulations further proposed that HCNH+, along with its chemically related species HCN, could help probe ambipolar diffusion in star formation regions (Tritsis et al. 2023). This molecular ion was also suggested to play an important role in the formation of formamide (NH2 CHO; Kerkeni & Simmie 2023) which is a key prebiotic precursor (López-Sepulcre et al. 2019). Despite its importance in star formation and astrochemistry, HCNH+ received comparatively less attention than more commonly studied molecular ions like HCO+ and N2H+ . Because of its small dipole moment of 0.29 D (Botschwina 1986) and the resultant low H2 critical densities (Gong et al. 2023), HCNH+ was expected to trace large-scale structures within molecular clouds across galaxies. However, previous observations of HCNH+ were predominantly confined to Galactic molecular clouds on linear scales of ≲10 pc (e.g., Ziurys & Turner 1986; Schilke et al. 1991; Quénard et al. 2017; Gong et al. 2023), leaving its behavior on larger scales and its role under extreme conditions largely unexplored.
At a distance of ~3.5 Mpc (Karachentsev et al. 2003; Rekola et al. 2005), the Sculptor galaxy NGC 253 stands as one of the nearest and most prominent starburst galaxies. This archetypal starburst galaxy boasts a total star formation rate of ~4.2 M⊙ yr−1 (Sanders et al. 2003) with ~2 M⊙ yr−1 concentrated in the nuclear starburst region, its central molecular zone (CMZ) (Bendo et al. 2015; Leroy et al. 2015). The energetic starburst activity drives large-scale galactic outflows (e.g., Turner 1985; Strickland et al. 2000; Bolatto et al. 2013; Bao et al. 2024). The starburst is fueled by inflowing gas from a bar (Iodice et al. 2014) and is characterized by the CMZ which harbors a total molecular gas mass of ~108 M⊙ (e.g., Sakamoto et al. 2011). The CMZ is significantly influenced by starburst feedback (e.g., Harada et al. 2021), and has proven to be a rich reservoir of molecular species (e.g., Martín et al. 2006; Aladro et al. 2015; Martín et al. 2021; Harada et al. 2024). Recent studies have highlighted elevated cosmic-ray ionization rates (e.g., Harada et al. 2021; Holdship et al. 2022; Behrens et al. 2022, Behrens et al. 2024; Phan et al. 2024), large-scale shocks (e.g., Humire et al. 2022; Harada et al. 2022; Huang et al. 2023), and a large amount of warm or hot molecular gas (e.g., Mangum et al. 2019; Rico-Villas et al. 2020; Huang et al. 2023; Tanaka et al. 2024; Bouvier et al. 2024) within the CMZ. These extreme conditions make the CMZ of NGC 253 an exceptional target for investigating the behavior of HCNH+ under extreme physical environments.
Despite its potential, the weak intensities of its rotational transitions pose significant challenges for mapping its large-scale distribution of HCNH+ in galaxies. Thanks to the unprecedented sensitivity of the ALMA Comprehensive High-resolution Extragalactic Molecular Inventory (ALCHEMI) survey (Martín et al. 2021), HCNH+ has been successfully discovered in the CMZ of NGC 253 (Harada et al. 2024) where only one single HCNH+ transition has been reported because of the selection criteria of the study. Recent advancements in the calculation of excitation rate coefficients for HCNH+ collisions with H2 have enabled the modeling of multiple HCNH+ transitions to determine physical conditions within molecular clouds (Bop & Lique 2023; Bop et al. 2024). However, such modeling has yet to be applied in an extragalactic environment. In this study, we aimed to investigate physical and chemical properties of the CMZ of NGC 253 with multiple transitions of HCNH+, shedding light on its behavior under the extreme starburst physical conditions.
We describe our observations in Sect. 2. Our findings are presented in Sect. 3, with discussions of the results in Sect. 4. The summary and conclusions are outlined in Sect. 5.
2 Observations and data reduction
The data used in this study were directly taken from the ALCHEMI survey (co-PIs.: S. Martín, N. Harada, and J. Mangum; Martín et al. 2021). A comprehensive description of the survey was already provided in Martín et al. (2021), so we only offer a brief summary here. The ALCHEMI survey (project codes: 2017.1.00161.L, 2018.1.00162.S) spans ALMA Bands 3– 7, covering frequencies from 84 to 375 GHz, excluding regions affected by atmospheric absorption features. The spectroscopic information was taken from the entry in the Cologne Database for Molecular Spectroscopy (CDMS1, Endres et al. 2016), which is based on the laboratory results of Silva et al. (2024). HCNH+ (2−1), HCNH+ (3−2), HCNH+ (4−3), and HCNH+ (5−4) have rest frequencies at 148221.450(17) MHz, 222329.277(8) MHz, 296433.652(17) MHz, and 370533.375(23) MHz, respectively, where uncertainties in the last digits are given in parentheses. These four HCNH+ rotational transitions fall within the frequency range covered by the ALCHEMI survey. The phase center of these observations is (αJ2000, δJ2000)=(00h47m33.s28, −25°17′17.″76). The surveyed area of 50″×20″ encompasses the entire CMZ of NGC 253. All data products were convolved to a common circular beam of 1.″6 (i.e., 27 pc). In this work, we mainly use the transitions of HCNH+ for our analysis, and their maximum recoverable scales of ≳11″ was achieved by combining the 12 m Array and Atacama Compact Array data. The data cubes were extracted from the ALCHEMI continuum- subtracted FITS cubes using the SpectralCube2 python package. The observed flux densities were converted to the brightness temperature scale using the Rayleigh-Jeans formula. The absolute flux calibration uncertainties were found to be ≲10% (Martín et al. 2021). The typical rms noise levels are about 4– 20 mK at a channel width of 10 km s−1. The velocity scale was calibrated with respect to the local standard of rest (LSR) in this work.
3 Results
3.1 Spatial distribution and spectra
Figure 1 illustrates the elongated distribution of HCNH+ (2−1) emission within the CMZ of NGC 253, with the nine most prominent giant molecular clouds (GMCs) labeled (see Table 1 in Harada et al. 2024). Figure 1a is adapted from Fig. 21 in Harada et al. (2024), while Fig. 1b shows the integrated intensity map convolved to a circular beam of 4″ FWHM,without sigma clipping. Although Fig. 1b does not recover the large-scale emission filtered out by the ALMA array, the smoothed image demonstrates that HCNH+ emission is more widespread than previously thought, with a radial extent of ∼300 pc in the CMZ. This is because the sensitivity is not high enough in Fig. 1a to detect the weak signals seen in Fig. 1b. Especially, the emission peaks are largely offset with respect to the positions of GMC1 and GMC2 in the low-angular-resolution image (see Fig. 1b), which was caused by the smoothing process where low-density gas close to GMC1 and GMC2 substantially contributes to the HCNH+ distribution. This behavior is expected due to the rather low upper-state energy levels and critical densities (see Table 1 in Gong et al. 2023). Consequently, HCNH+ emission effectively traces large-scale structures within molecular clouds.
Figure 2 presents the observed HCNH+ spectra for the nine GMCs (see their positions in Fig. 1). HCNH+ is detected in eight of the GMCs, with at least two transitions in each GMC exceeding the 3σ level, except for GMC5, the nucleus and kinematic center of the galaxy, which is associated with the brightest radio continuum emission (Turner & Ho 1985). The peak velocities of HCNH+ transitions agree well with those of all other molecular species, supporting the assignment of these spectral features to HCNH+ . Additionally, there are spectral features near the HCNH+ (3−2) and HCNH+ (4−3) lines. The features close to HCNH+ (3−2) correspond to multiple k-ladder transitions of CH3CCH (12k − 11k), while those near HCNH+ (4−3) are likely due to the blend of SO (67 − 56) with a rest frequency of 296550.064(30) MHz, the highly excited SO2 (244,20 − 243,21) with a rest frequency of 296535.4225(14) MHz, and 30SiO (7−6) with a rest frequency of 296575.730(20) MHz (Endres et al. 2016). Thus, the classic integrated intensity maps over a specific velocity range (i.e., from 100 to 400 km s−1) inevitably introduce contamination to the HCNH+ (3−2) and (4−3) integrated intensity maps. However, the CH3CCH features are redshifted by ∼240 km s−1 relative to HCNH+ (3−2), and the blended lines around 296550 MHz are blueshifted by ∼100 km s−1 with respect to HCNH+ (4−3), allowing us to isolate the observed properties of HCNH+ transitions. To minimize this contamination, we applied a masking method before producing the integrated-intensity maps.
Since the HCNH+ (2−1) line is brighter than the other HCNH+ transitions and less contaminated by emission from other species, we used emission in this line to create the mask both spatially and spectrally for the data cubes of all the HCNH+ transitions. Our masking method3 was a modified version of that previously adopted by Harada et al. (2024). We labeled the connected components above the 3σ threshold in the threedimensional (α2000 , δ2000 , vLSR) data cube of HCNH+ (2−1) using a 26-connected neighborhood4 algorithm5. These labeled components were subsequently utilized as masks for all the HCNH+ transitions. The mask areas were carefully expanded in the spatial dimensions to include surrounding emission and in the spectral dimension to capture line wings while minimizing contamination from other spectral lines. Furthermore, we manually masked the regions near HCNH+ (4−3) emission toward GMC5 and GMC6 to mitigate potential contamination in the spectral axis. Data outside these masked regions were trimmed to focus the analysis on the relevant areas within the mask.
Based on the trimmed data cubes6, we derived the integrated intensity distributions of the four HCNH+ transitions over a range from 100 km s−1 to 400 km s−1 . The results are presented in Fig. 3. The integrated intensities of Figs. 1a and 3a are consistent within uncertainties, with Fig. 3a showing a higher dynamical range and a more widespread distribution than Fig. 1a. This consistency suggests that our masking approach accurately reproduces the intrinsic integrated intensities and enhances the detection of low-intensity emissions. Figure 3 not only confirms the widespread distribution of HCNH+ emission but also shows that the four HCNH+ transitions exhibit nearly identical spatial distributions, with emission peaking at GMC6. The main difference is the different integrated intensities of these transitions, with HCNH+ (2−1) being the brightest. This indicates that HCNH+ transitions predominantly trace the same gas structures, albeit with varying intensities. While weak HCNH+ emission appears to be present in GMC5 in Fig. 3, its spectra lack sufficient signal-to-noise ratios in Fig. 2. Therefore, HCNH+ emissions in GMC5 were excluded from further analysis.
We fitted the observed HCNH+ transitions from the selected GMCs using a single-component Gaussian model, with the results presented in Table 1. The fitted velocity centroids range from ∼180 to ∼330 km s−1 and full width at half-maximum (FWHM) line widths are in the range of 40–70 km s−1. These values are consistent with previously reported velocities determined for other molecular tracers within 3σ uncertainties (e.g., Haasler et al. 2022; Humire et al. 2022; Bouvier et al. 2024). Based on the fitted results, we find that all HCNH+ transitions have peak intensities of ≲200 mK, which are much lower than those of H13CN (1−0) (see Fig. 2). Given the widespread distribution of HCNH+ emission in the CMZ (see Fig. 1b), beam dilution effects might be negligible. Assuming an excitation temperature of 15 K (as discussed below) and neglecting beam dilution effects, we find that the low peak intensities correspond to optical depths of <0.1. Even accounting for a beam dilution factor as low as 0.1, the peak optical depths remain below 0.3. Therefore, we conclude that the HCNH+ transitions are optically thin in the CMZ of NGC 253.
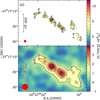 |
Fig. 1 Distribution of HCNH+ (2−1) in the CMZ of NGC 253. (a) HCNH+ (2−1) integrated intensity map (taken from Harada et al. 2024), clipped at the 3σ level. The contours start from 2.7 K km s−1 (3σ) and increase by 2.7 K km s−1. (b) HCNH+ (21) integrated intensity map that has been convolved to a circular beam of 4″ . The smoothed image manifests the large-scale structures traced by HCNH+ transitions. The contours start from 0.9 K km s−1 (3σ) and increase by 0.9 K km s−1. In each panel, the beam is shown in the lower-left corner, and the pluses indicate the positions of the nine most prominent GMCs. |
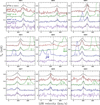 |
Fig. 2 Observed H13CN and HCNH+ spectra (all with a common circular beam of 1.″6) of the nine GMCs indicated in Fig. 1 and Table 1. H13CN (1−0), HCNH+ (2−1), HCNH+ (3−2), HCNH+ (4−3), and HCNH+ (5−4) are indicated by black, red, green, blue, and purple lines, respectively. The fits to the HCNH+ spectra are indicated by black dotted lines. H13CN (1−0) spectra are scaled by a factor of 0.1 for better visualization. In each panel, the systemic LSR velocity is indicated by the vertical black dashed line. The potentially blended lines are marked by short vertical lines in the corresponding panels, with the associated species labeled in the central panel for GMC5. |
3.2 LTE analysis
Assuming local thermodynamic equilibrium (LTE), we employed the rotational diagram method (Goldsmith & Langer 1999) to derive the rotational temperatures, Trot, and molecular column densities,  . Since all data had been convolved to the same angular resolution of 1.″6, we did not correct for the beam dilution effects, which might be negligible (see above). While this ensured that rotational temperatures were unaffected, the derived column densities were inherently beam-averaged. The rotational diagrams of the eight GMCs are shown in Fig. 4. Linear fits were applied to these diagrams, with uncertainties quantified using a Monte Carlo approach. Specifically, 10 000 realizations were generated by sampling Gaussian distributions of the integrated intensities, adopting the combined uncertainties from Table 1 and 10% of the absolute flux calibration uncertainties as the respective standard deviations. These were propagated through linear fits, and the resulting distributions were analyzed to derive uncertainties in both the rotational temperatures and column densities.
The fitting results of the eight GMCs were given in Table 2. The derived rotational temperatures were in the range of 12– 21 K, aligning closely with those of C18O but exceeding those (<10 K) of H13CO+ (see Table 4 in Harada et al. 2021). This discrepancy was likely attributed to the similarly low critical densities of HCNH+ and C18O transitions, which are much lower than those of H13CO+. The rotational temperatures were also lower than the expected gas temperatures (e.g., Mangum et al. 2019; Rico-Villas et al. 2020; Huang et al. 2023; Tanaka et al. 2024), which implied that HCNH+ transitions were subthermally excited. The HCNH+ column densities derived from our analysis ranged from 8.3 × 1014 cm−2 to 4.0 × 1015 cm−2, which is almost comparable to those of HCO+ in this CMZ (Harada et al. 2021).
H2 column densities,  , are essential to derive the fractional molecular abundances,
  , of HCNH+. In this work, we directly utilized values for
  from the low-density hierarchical Bayesian analysis of the ALCHEMI data at a circular beam of 11.″6 (Tanaka et al. 2024). The resulting
  , presented in Table 2, were remarkably high, ranging from 6.3 × 10⁻⁹ to 2.0 × 10⁻⁸. In comparison, the observed
  values in the Milky Way were ≲2 × 10⁻⁹ in all previous studies (e.g., Ziurys & Turner 1986; Schilke et al. 1991; Fontani et al. 2021; Gong et al. 2023). Particularly,
  was only ~3 × 10⁻¹⁰ in Sgr B2, located in the CMZ of the Milky Way (Ziurys & Turner 1986), which is more than an order of magnitude lower than our observed values in the CMZ of NGC 253. This stark contrast highlights the significantly elevated abundance of HCNH+ in the CMZ of NGC 253, indicating that its physical conditions differ significantly from those in the Milky Way.
Based on Table 2, we observed a trend of decreasing HCNH+ abundances in GMCs as they approach the center of the CMZ, which is similar to the gradient of HOCO+ abundances (see Fig. 4d in Harada et al. 2022). To further explore this, we examined the relationship between HCNH+ abundance and H2 column density, as shown in Fig. 5. Our analysis reveals that the anti-correlation between HCNH+ abundances and H2 column densities, previously observed in molecular clouds of the solar neighborhood (Gong et al. 2023), also holds in the CMZ of NGC 253. However, the anti-correlation appeared to arise from the associated cosmic ray ionization rates (see Sect. 4), because GMCs close to the center of the CMZ tend to have higher cosmic ray ionization rates (Harada et al. 2021; Holdship et al. 2022; Behrens et al. 2022, Behrens et al. 2024). In the solar neighborhood, cosmic ray ionization rates are likely governed by H2 column densities. As suggested by previous studies (e.g., Neufeld & Wolfire 2017; Padovani et al. 2018), cosmic ray ionization rates decrease with increasing H2 column density. If these rates were the primary factor regulating HCNH+ abundances, one would expect higher HCNH+ abundances in regions with higher H2 column densities. However, this expectation was not consistent with recent observations. Therefore, we propose that the physical mechanisms driving the observed anti-correlation between HCNH+ abundance and H2 column density in the CMZ of NGC 253 differ from those in the solar neighborhood.
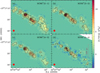 |
Fig. 3 Distributions of HCNH+ (2−1) (a), HCNH+ (3−2) (b), HCNH+ (4−3) (c), and HCNH+ (5−4) (d) emission in the CMZ of NGC 253. All intensity maps are integrated from 100 to 400 km s−1 and share a common integrated-intensity scale indicated by the color bar. In each panel, the overlaid contours represent the integrated intensities of respective HCNH+ transitions, starting at 1.2 K km s−1 and increasing by 1.2 K km s−1. The positions of the nine GMCs are marked with plus symbols. In each panel, the beam is shown in the lower-left corner. |
Observational parameters of the selected GMCs.
3.3 Non-LTE analysis
3.3.1 Collisional rate coefficients
Rates for collisions of HCNH+ induced by encounters with para - H2 (j27 = 0), denoted hereafter as p-H2 , were first investigated by Bop & Lique (2023) using the time-independent quantum mechanical close-coupling (CC) method (Arthurs & Dalgarno 1960) and later revised to include the effect of the H2 rotational basis (Gong et al. 2023; Bop et al. 2024). The former dataset, which was less precise, covered kinetic temperatures, TK, up to 100 K, while the latter more precise dataset was limited to 30 K due to the computational cost of the CC method. Given that the CMZ of NGC 253 is expected to be significantly warmer than 30 K (e.g., Mangum et al. 2019; Tanaka et al. 2024), a comprehensive set of collisional rate coefficients covering a wider temperature range is required for a robust interpretation of warm or hot HCNH+ emission lines in the CMZ. This would help in accurately modeling the excitation conditions of HCNH+ in such extreme environments.
To address the computational cost of the CC method, we employ the quantum mechanical coupled states’ (CS) approximation (McGuire & Kouri 1974), which has long been tested and validated for the computation of high-temperature collisional rate coefficients. We investigate the scattering of HCNH+ due to collisions with both p-H2 and ortho-H2( j2 = 1), denoted hereafter as o-H2. The use of the latter collision partner is motivated by the warm/hot regime which we are interested in. Indeed, above 75 K, the population of molecular hydrogen is dominated by the o-H2 spin-symmetry.
In practice, we implemented the four-dimensional potential energy surface calculated by Bop & Lique (2023) in the MOLSCAT molecular scattering code (Hutson & Green 1994) to compute state-to-state inelastic cross sections. We focused on transitions among the 30 lowest-lying energy levels of HCNH+ , which, for convergence reasons, required an exhaustive rotational basis (j18 = 0 – 48). In addition, we included the two low-lying rotational transitions of H2, namely, j2 = 0 – 2 and j2 = 1 – 3 for p- and o-H2, respectively. All additional integration parameters were defined to ensure subpercent convergence of the cross sections. The calculations were performed for total energies up to 3500 and 3620 cm−1 using p-H2 and o-H2 as colliders, respectively. Therefore, using the Maxwell-Boltzmann velocity distribution, we derived rate coefficients for HCNH+ induced by collisions with both p- and o-H2 for kinetic temperatures up to 500 K, and the results are shown in Fig. 6. The collisional rate coefficients will be accessible through databases such as Basecol9 (Dubernet et al. 2024), EMAA10, and LAMDA11 (Schöier et al. 2005; van der Tak et al. 2020).
To assess the accuracy of the CS approximation, we compare in Fig. 7 the new HCNH+ collisional rate coefficients induced by p-H2 with those previously computed by Bop et al. (2024) using the “exact” CC method. The collisional rate coefficients using the CS approximation turn out to underestimate the CC data by up to a factor of two, especially for the low-magnitude rate coefficients. To quantify the disagreement between the CC and the CS results, we calculate for each temperature the weighted mean error factor (Loreau et al. 2018; Pirlot Jankowiak et al. 2023) as follows:
 (1)
(1)
where ri is defined as the maximum of  , ensuring that ri ≥ 1. The WMEF decreases with increasing temperature, suggesting that the agreement is expected to be reasonable above 30 K, good for T > 50 K, and excellent above 80 K. For further validation tests, we refer readers to Appendix A, where the impact of low-temperature discrepancies on radiative transfer calculations is shown.
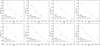 |
Fig. 4 Rotational diagrams of HCNH+ for the selected GMCs. In each panel, the dashed line represents the linear least squares fit to the observed data points. The fit results for each GMC are shown in the lower-left corner of each panel. |
Physical parameters of the selected GMCs.
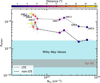 |
Fig. 5 HCNH+ abundances as a function of H2 column density. The colors represent the distances of GMCs to GMC5 which is located at the center of the CMZ of NGC 253. The circles represent HCNH+ abundances derived using the LTE approach (see Sect. 3), while the squares represent those obtained from the non-LTE approach (see Sect. 3.3.2). The cyan-shaded region indicates the observed HCNH+ abundances of ≲2 × 10⁻⁹ previously reported in the Milky Way, while the brown- shaded region marks the abundances reported toward Sgr B2. |
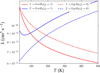 |
Fig. 6 Temperature dependence of the HCNH+ rate coefficients induced by collisions with p-H2 (dashed lines) and o-H2 (solid lines). |
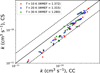 |
Fig. 7 Comparison of two datasets of rate coefficients for HCNH+ induced by collisions with p-H2(j2 = 0). The x-axis represents the first dataset, computed using the “exact” CC method (Bop & Lique 2023), while the y-axis represents the second dataset, calculated in this work using the CS approximation. The dashed lines indicate an agreement region within a factor of 2.0. Different colors represent their weighted mean error factors (WMEF) which are defined in Eq. (1). |
3.3.2 Non-LTE modeling
The detection of multiple HCNH+ transitions in the CMZ of NGC 253 allows the first non-LTE analysis of HCNH+ in an extragalactic environment. Here, we use the non-LTE radiative transfer code RADEX12 for statistical equilibrium calculations (van der Tak et al. 2007). The collisional rates used in the analysis are based on the data discussed in Sect. 3.3.1. In our modeling, RADEX adopts an expanding spherical geometry, the so-called Sobolev or large velocity gradient (LVG) approximation (e.g., Sobolev 1960; Elitzur 1992), to calculate the escape probability. Given that HCNH+ transitions are optically thin in the CMZ of NGC 253 (see Sect. 3), the results are not affected by the assumed geometry. Thus, an expanding spherical geometry providing localized source functions is sufficiently robust.
In our RADEX modeling, we adopted an H2 ortho-to-para ratio of 0.25, following the values reported in previous studies (e.g., Neufeld et al. 2006). The ortho-to-para ratio also does not affect the modeling results significantly, because the rate coefficients for collisions with p- and o-H2 are comparable (see Fig. B.1). The line widths are taken to be the averages of the fitted values for the four transitions (see Table 1). We assume that the emission from all HCNH+ transitions originates from the same regions. Given that the beam sizes are identical for all transitions, beam dilution effects primarily influence the modeling of HCNH+ column densities when the transitions are optically thin. For simplicity, we neglected the beam dilution effects (i.e., the beam dilution factor is set to be unity). As a result, the HCNH+ column densities derived from our non-LTE analysis are beam-averaged values.
We minimized our modeling results using the emcee13 code (Foreman-Mackey et al. 2013) and the affine-invariant ensemble sampler (Goodman & Weare 2010) for Monte Carlo Markov chain (MCMC) calculations, enabling us to obtain the posterior probability distributions of the modeled parameters. We assumed uniform priors for TK,  , and NHCNH+. Based on previous studies on the CMZ of NGC 253 (e.g., Mangum et al. 2019; Holdship et al. 2022; Behrens et al. 2022; Tanaka et al. 2024), we set TK,
  , and NHCNH+ to be in the range of 50–500 K, 102–107 cm−3, and 1013−1017 cm−2, respectively. The posterior distribution of these parameters was determined by the product of the prior distribution function and the likelihood function. The likelihood function was assumed to be
  with
with
 (2)
(2)
where Iobs,i, Imod,i, and σi are the observed integrated intensity ratio, the modeled integrated intensity, and the 1σ uncertainty in Iobs,i, respectively. The MCMC simulations were conducted using 20 walkers for 4500 steps following a burn-in period to ensure that the walkers achieved convergence. The 1σ uncertainties of the physical parameters were derived from the 16th and 84th percentiles of the posterior distribution.
Figure C.1 shows an example of the fitting results for GMC6. The plot demonstrates that H2 and HCNH+ column densities are well constrained, whereas the gas temperatures are less precisely determined. The large uncertainties associated with the gas temperatures suggest that HCNH+ transitions are relatively insensitive to variations in gas temperature within the parameter space considered in the models. The complete fitting results for the eight GMCs are summarized in Table 2.
The beam-averaged HCNH+ column densities of (0.3–1.2) × 1015 cm−2, derived from the best-fit RADEX modeling, were about a factor of three lower than those obtained from the LTE approach. This discrepancy suggested that the HCNH+ gas deviated from LTE conditions, despite its low critical densities. Such behavior indicates that HCNH+ predominantly arises from low- density regions, where H2 number densities are below 104 cm−3 (Bop et al. 2024). Therefore, we considered the HCNH+ column densities and abundances derived from our RADEX modeling to be more reliable. Even with the low HCNH+ column densities derived from non-LTE modeling, the HCNH+ abundances were revised to (1.8–9.4)×10−9 in the CMZ of NGC 253, most of which remained higher than all reported Galactic HCNH+ abundances (≲2 × 10⁻⁹) (e.g., Ziurys & Turner 1986; Schilke et al. 1991; Fontani et al. 2021; Gong et al. 2023).
Given the low dipole moment of HCNH+ (0.29 D; Botschwina 1986), the critical densities of its transitions are relatively low (see Table 1 in Gong et al. 2023). Utilizing the new collisional rate coefficients, we calculated the H2 critical densities of the four HCNH+ transitions at high kinetic temperatures using Eq. (5) in Shirley (2015). At Tk = 100 K, the critical densities for HCNH+ (2–1), HCNH+ (3–2), HCNH+ (4–3), HCNH+ (5–4) in the optically thin case are 1.0 × 103 cm−3, 3.6 × 103 cm−3, 8.6 × 103 cm−3, and 1.7 × 104 cm−3, respectively, which are much lower than those of the transitions of other molecules like HCN, HNC, CN,HCO+, andN2H+ with comparable J quantum numbers (see Table 1 in Shirley 2015). When Tk > 100 K, the critical densities decrease slightly. These critical densities indicate that they trace low-density gas with  ≲ 104 cm−3. Our non-LTE modeling analysis indeed reveals that the derived H2 number densities are ~102.80–103.55 cm−3 (see Table 2), aligning with the values of the low-density component in the CMZ of NGC 253 (e.g., Tanaka et al. 2024). Furthermore, the H2 number densities of the inner GMCs (i.e., GMC4 and GMC6) exceed those in the outer regions, consistent with the trend of the low-density component characterized in Fig. 5 of Tanaka et al. (2024). This agreement confirms that HCNH+ primarily traces the low-density regions of GMCs, highlighting its potential as a reliable tracer of such environments.
4 Discussion
In this study, we derived surprisingly high HCNH+ abundances in the CMZ of NGC 253, exceeding all reported values in the Milky Way. This stark contrast suggests that HCNH+ can be more abundant than previously thought, which underscores the environmental influences on its abundance. Compared to previous studies in the Milky Way, the extreme physical conditions in the CMZ of NGC 253 might potentially enhance the formation of HCNH+ . Therefore, we performed astrochemical calculations to study the environmental influences on HCNH+ abundances using models of static clouds, photodissociation regions (PDRs), and shocks.
4.1 Static clouds
We first used the gas-grain astrochemical code, Chempl14 (Du 2021), for calculations of a static cloud, employing the UMIST RATE12 chemical network (McElroy et al. 2013) enhanced with updated chemical reactions as described by Gong et al. (2023). The initial elemental abundances are the same as in Table 3 of McElroy et al. (2013), who tested the network using a dark cloud model. Although their initial conditions may not precisely match those of the CMZ of NGC 253, the environmental influences on HCNH+ abundances are similar for different initial conditions. Therefore, our modeling results can provide an illustrative case for understanding the environmental influences on the trends in abundance variations.
Our investigation focused on the effects of various parameters, including gas temperatures, gas densities, visual extinctions, interstellar radiation, and cosmic ray ionization rates on HCNH+ abundances. In these models, dust temperatures were assumed to be equal to gas temperatures. Based on previous studies, we constrained gas temperatures to TK .500 K (Mangum et al. 2019; Rico-Villas et al. 2020; Huang et al. 2023; Tanaka et al. 2024), gas densities to  (see Sect. 3.3.2 and Tanaka et al. 2024), interstellar radiation fields to G0 ≲ 109 in Habing units (Pérez-Beaupuits et al. 2018), and cosmic-ray ionization rates to ζ ≲ 105 ζ0 (e.g., Harada et al. 2021; Holdship et al. 2022; Behrens et al. 2022, 2024) with ζ0 = 1.36 × 10⁻¹⁷ s−1 (e.g., van der Tak & van Dishoeck 2000).
Figure 8 illustrates the modeling results under different physical conditions. In Fig. 8a, HCNH+ abundances at TK = 100 K can be even lower than those at TK = 10 K at 106 yr, but HCNH+ abundances increase with increasing gas temperatures above TK = 100 K at ≳ 106 yr. This transition is related to the evaporation temperatures, Tevap, of HCNH+’s precursor molecules such as HCN, above which HCN can be effectively released from dust grains. The evaporation temperature, at which the concerned molecule is half in gas phase and half on grain surfaces, can be estimated with the following formula (e.g., Hollenbach et al. 2009; Du et al. 2012):
![Mathematical equation: ${T_{{\rm{evap }}}} \simeq {E_{\rm{D}}}/\left\{ {60 + \ln \left[ {\left( {{{{{10}^5}{\rm{c}}{{\rm{m}}^{ - 3}}} \over {{n_{\rm{H}}}}}} \right){{\left( {{{20{\rm{K}}} \over {{T_{{\rm{gas}}}}}}} \right)}^{1/2}}{{\left( {{m \over {28{\rm{amu}}}}} \right)}^{1/2}}} \right]} \right\}$](/articles/aa/full_html/2025/04/aa52835-24/aa52835-24-eq58.png) (3)
(3)
where ED is the binding energy barrier of the species on grain surfaces, nH is the hydrogen number density, Tgas is the gas temperature, and m is the molecular mass of the species. HCN binding energies were estimated to vary within the range of 2057-7421 K, depending on the different surface models (Ferrero et al. 2020). Based on the results from experiments (Bergner et al. 2022), we adopted HCN–HCN and HCN–H2O binding energies of ED = 3207 ± 197 K and ED = 4192 ± 68 K for our calculations. For HCN, m =27 amu. Therefore, we estimate the evaporation temperatures of about 50–70 K for HCN molecules. In the CMZ of NGC 253, the gas temperature ranges from ≲50K on larger scales to ≳300 K on 10 pc scales (Mangum et al. 2019). On a scale of 27 pc (i.e., our beam size of 1′.′6), the gas temperatures are likely higher than the HCN evaporation temperatures (Mangum et al. 2019; Huang et al. 2023; Tanaka et al. 2024; Bouvier et al. 2024). These elevated gas temperatures can significantly enhance the formation of the gas-phase precursors of HCNH+ (i.e., HCN and HCN+), thereby increasing its abundance.
When varying  in Fig. 8b, the peak HCNH+ abundances remain relatively constant, with differences within an order of magnitude. HCNH+ reaches its peak abundance earlier at higher nH2 , as chemical timescales are inversely proportional to
  for two-body reactions. In Fig. 8c, we find that HCNH+ abundances decrease with decreasing Av at Av ≲5 due to photodissociation. At Av ≳ 5, the HCNH+ abundances are nearly independent of Av. In Fig. 8d, the model results also show no dependence on the interstellar radiation field at Av = 20 (see Table 2). The independence can be explained by the fact that regions with such high Av are well shielded from ultraviolet radiation.
Figure 8e shows that higher cosmic-ray ionization rates result in lower HCNH+ abundances, consistent with Fontani et al. (2021). This is because high cosmic-ray ionization rates can efficiently ionize H2 , leading to an enhancement of free electrons. These electrons can subsequently destroy molecular ions, including HCNH+ and key precursors to its formation, via dissociative recombination reactions, thereby reducing the HCNH+ abundance.
As shown above, the increased H2 number densities, visual extinctions, interstellar radiations, and cosmic-ray ionization rates do not significantly increase the HCNH+ abundances. Given the high gas temperatures in the CMZ of NGC 253 (Mangum et al. 2019; Rico-Villas et al. 2020; Huang et al. 2023; Tanaka et al. 2024), we suggest that the unexpectedly high HCNH+ abundances could result from chemical enhancement triggered by high gas temperatures. However, recent ALCHEMI studies show that the cosmic-ray ionization rates are very high, ≳103ζ0, in these GMCs (e.g., Harada et al. 2021; Holdship et al. 2022; Behrens et al. 2022, 2024). At such high cosmic-ray ionization rates, none of the static models can reproduce the high HCNH+ abundances observed at their gas temperatures (e.g., TK ≲ 300 K; Mangum et al. 2019). In contrast, chemically related species such as HCN and HNC can be successfully modeled with these static models (Behrens et al. 2022, 2024). We also note that gas and dust may be not well coupled in low-density regions traced by HCNH+. In these regions, dust temperatures are expected to be lower than gas temperatures, as confirmed in the CMZ of our Galaxy (e.g., Ao et al. 2013; Ginsburg et al. 2016). Since gas evaporation from dust grain mantles is regulated by dust temperatures, lower dust temperatures would lead to even lower HCNH+ abundances. Nevertheless, our main conclusion that the static models cannot reproduce the observed high HCNH+ abundances remains unchanged.
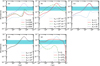 |
Fig. 8 Environmental influence on HCNH+ abundances relative to H2 as a function of time, calculated from the static models of Chempl (Du 2021). (a) Modeling results for different gas temperatures with |


4.2 PDRs
HCNH+ transitions are likely to trace low-density regions (see Sect. 3.3.2), indicating that they may arise from PDRs. To explore this scenario, we used the Chempl code for PDR model calculations (Du 2021). As shown in Sect. 4.1, high gas temperatures can effectively increase the HCNH+ abundances. In order to reproduce the observed HCNH+ abundances, we used Tk = 500 K and a gas density of 103 cm−3 as our fiducial parameters in the PDR models where dust temperatures are approximated following Eq. (9.18) in Tielens (2005),
![Mathematical equation: $\eqalign{ & T_{\rm{d}}^5 = 8.9 \times {10^{ - 11}}{v_0}{G_0}\exp \left[ { - 1.8{A_{\rm{V}}}} \right] + {2.78^5} \cr & \,\,\,\,\,\,\,\,\,\, + 3.4 \times {10^{ - 2}}\left( {0.42 - \ln \left[ {3.5 \times {{10}^{ - 2}}{\tau _{100\mu {\rm{m}}}}{T_0}} \right]} \right){\tau _{100\mu {\rm{m}}}}T_0^6 \cr} $](/articles/aa/full_html/2025/04/aa52835-24/aa52835-24-eq61.png) (4)
(4)
where ν0 = 3 × 10¹⁵, τ100µm = 10−3, and  . The interstellar radiation field strength at the PDR edge, G0 , and the cosmic-ray ionization rate, ζ, were the only parameters varied in our calculations.
The modeling results are shown in Figure 9. As the visual extinction, AV, increases, HCNH+ abundances generally increase for a given G0 and ζ. For different G0 , HCNH+ abundances are nearly constant at high AV (i.e., AV ≳ 15). This is because high interstellar radiation fields are likely to destroy HCNH+ at low AV , making HCNH+ most abundant in well- shielded regions. However, it should be noted that high values of ζ significantly reduce HCNH+ abundances. While the observed HCNH+ abundances can be reproduced for ζ ≲ 102ζ0 , PDR models fail to match the observed values at the expected high cosmic-ray ionization rates, ζ ≳ 103ζ0 (e.g., Harada et al. 2021; Holdship et al. 2022; Behrens et al. 2022, 2024).
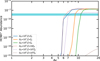 |
Fig. 9 HCNH+ abundance as a function of visual extinctions at different interstellar radiation fields and cosmic ray ionization rates, calculated from the PDR models of Chempl (Du 2021). The corresponding values are shown in the legend. The cyan-shaded region indicates the observed HCNH+ abundances in this study. |
4.3 Shocks
In Sect. 4.1, high kinetic temperatures of TK ≳ 300 K are required to produce the observed high HCNH+ abundances in environments associated with high cosmic-ray ionization rates (see Fig. 8e). Such high kinetic temperatures can be caused by shock heating (Huang et al. 2023). Furthermore, Huang et al. (2023) found that shocked gas, traced by SiO transitions, had low H2 number densities of ≲104 cm−3 , similar to the density regime probed by HCNH+ (see Sect. 3.3.2). This led us to speculate that shocks in the CMZ may enhance HCNH+ abundances. To investigate the impact of shocks on HCNH+ abundances, we employed the UCLCHEM15 code (Holdship et al. 2017) to run shock models. In these models, we also augmented the UMIST RATE12 chemical network with C2N+ + H2 → HCNH+ + C, as this reaction may contribute to the formation of HCNH+ (Gong et al. 2023). This code involves two phases. In phase 1, we modeled a static cloud of isothermal gas with TK =10 K and a gas density of 103 cm−3 in atomic/ionic form with no molecules, leading to a model of a molecular cloud used in phase 2. In phase 2, we adopted C-type shocks for our calculations, parameterized according to Jiménez-Serra et al. (2008), similar to the approach in Huang et al. (2023). In this approach, the preshock magnetic field strength was approximated using Eq. (63) of Draine et al. (1983).
In the shock models, we mainly tested with different cosmic ray ionization rates and shock velocities with a fixed preshock gas density of 103 cm−3. The modeling results are presented in Fig. 10. In these shock models, the temperatures reached their maximum around the nearly identical timescale at 6 × 10³ yr. In this time evolution plot, an enhancement of HCNH+ abundances was evident around the timescales close to the time of the maximum temperature and the HCNH+ abundances were significantly lower than the observed values before and after the shock phase. Both cosmic ray ionization rates and shock velocities affected HCNH+ abundances. In these models, elevated cosmic ray ionization rates are necessary to reproduce the observed HCNH+ abundance enhancements. With ζ = ζ0, shock models cannot account for the observed HCNH+ abundance. Only by increasing ζ can the observed HCNH+ levels be achieved. This is because cosmic ray ionization rates enhanced the abundances of molecular ions, which in turn led to the HCNH+ enhancement. However, when ζ ≳ 103ζ0, the modeled HCNH+ abundances decrease. This occurs because high cosmic ray ionization rates efficiently ionize H2 and produce the elevated electron abundances, which in turn efficiently destroy molecular ions. In contrast, higher shock velocities led to significantly elevated HCNH+ abundances and sustained these enhanced levels over longer timescales.
We also compared the HCN and HNC abundances derived from Behrens et al. (2024) with our shock models. To reproduce the observed HCN and HNC abundances, higher cosmic ray ionization rates of of ≳103ζ0 were required, consistent with the findings of previous studies (Behrens et al. 2022, 2024). However, it is important to note that the densities probed by HCN and HNC (Behrens et al. 2024) appeared to be higher than those traced by HCNH+, suggesting that HCNH+ might trace a distinct component of the molecular gas in the CMZ of NGC 253 compared to HCN and HNC.
While our static (Section 4.1) and PDR (Section 4.2) models failed to reproduce the observed HCNH+ abundances at high cosmic ray ionization rates of ζ ~ 105ζ0, our C-type shock models could reproduce the high HCNH+ abundances at such extreme physical conditions with shock velocities of vs ≳10 km s−1. However, we note that a single shock event cannot sustain high HCNH+ abundances due to the rapid destruction of HCNH+ molecules in post-shock gas. Previous studies suggested that the CMZ might undergo multiple shock episodes, potentially triggered by outflows, star formation, and cloud-cloud collisions (Huang et al. 2023). These recurrent shocks could, in principle, sustain the elevated HCNH+ abundances observed. We therefore propose that HCNH+ primarily originates from shocked gas in the CMZ.
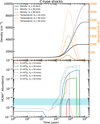 |
Fig. 10 Physical structures and the evolution of HCNH+ abundances in C-type shocks, calculated from the UCLCHEM models (Holdship et al. 2017). Top: C-shock physical structures of our models for the three different shock velocities. The black and orange lines represent the density and temperature profiles of shock models. Bottom: HCNH+ abundances as a function of time for C-type shocks. The preshock gas density is fixed to 103 cm−3 in the models. Different lines correspond to different cosmic ray ionization rates and shock velocities which are shown in the legend. The cyan-shaded region indicates the observed HCNH+ abundances in this study. GIF animations of the shock models at a given ζ = 103ζ0 and ζ = 105ζ0 are available via link1 and link2, respectively. |
4.4 Formation and destruction paths
In the adopted chemical network, HCNH+ can be produced through ion-neutral reactions as follows:
 (5)
(5)
 (6)
(6)
 (7)
(7)
 (8)
(8)
 (9)
(9)
while its destruction occurs via the following reactions,
 (10)
(10)
 (11)
(11)
 (12)
(12)
 (13)
(13)
In cold regions (TK ~10 K), reactions (5)–(7) are thought to dominate the formation of HCNH+ , while dissociative recombination through reaction (10) serves as the main destruction pathway (e.g., Schilke et al. 1991). However, both HCN and HNC acted as reactants and products, presenting a “chicken- and-egg problem”. Chemical modeling by Fontani et al. (2021) suggested that reactions (7) and (8) were the primary formation pathways, with HCN+ mainly produced via  , effectively resolving the chicken-and-egg issue. Reaction (9) was previously overlooked because it was not included in the UMIST RATE12 chemical network. However, using the rate coefficient of reaction (9) (Knight et al. 1988; Loison et al. 2014), Gong et al. (2023) compared the chemical reaction rates of reactions (5)–(9) and suggested that reaction (9) could make non-negligible contributions. Fontani et al. (2021) also explored the chemistry of warm regions (TK ~ 27 K), finding that reaction (6) became the primary formation mechanism, while the dominant destruction pathway remained unchanged.
We also explored the chemistry based on the shock models (see Sect. 4.3). The HCNH+ chemistry in the shock models is presented in Fig. 11. For instance, we employed a shock model with a cosmic-ray ionization rate ζ = 105ζ0 and a shock velocity of vs=30 km s−1. In this model, the primary formation pathway for HCNH+ during the early phase of C-type shocks (at timescales of ≲1.4 × 10⁴ years in Fig. 10) is reaction (8) involving H2+HCN+, similar to the cold model in Fontani et al. (2021). As the shock evolves into the second phase (at timescales of (1.4−2) × 104 years in Fig. 10), reaction (9) became the dominant formation pathway, contributing to ≳80% of the HCNH+ formation rate. Eventually, at later stages, reaction (8) once again took over as the primary formation mechanism. Additionally, reaction (5) via  and HCN also significantly contributed to the formation of HCNH+ molecules during the early phase of shocks (at timescales of 5 × 10³ to 1.4 × 10⁴ years; Fig. 10), accounting for 16–27% of the HCNH+ formation rate during this period.
Another factor contributing to the elevated HCNH+ abundances is the temperature dependence of the destruction reaction (10). The rate coefficient for this reaction decreases with increasing gas temperature, following a power-law dependence of −0.65 (McElroy et al. 2013). At a gas temperature of 300 K, the reaction rate coefficient is about an order of magnitude lower than at 10 K. For demonstration, we once again employed the shock model with a cosmic-ray ionization rate ζ = 105ζ0 and a shock velocity of vs=30 km s−1. During the shock phase (on timescales of 2 × 10³ to 3 × 10⁴ years in Fig. 10), reactions (11)–(13) became increasingly efficient, but the overall destruction of HCNH+ was significantly reduced. Over the entire process, reaction (10) remains the dominant mechanism for the destruction of HCNH+ . Thus, high temperatures induced by shock heating substantially mitigate the destruction of HCNH+, leading to an enhancement in its abundance.
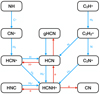 |
Fig. 11 Schematic diagram of the simplified chemical network that dominates the HCNH+ chemistry in the shock model. |
5 Summary and conclusions
To explore the behavior and significance of HCNH+ under extreme conditions, we analyzed four rotational transitions of HCNH+ from the ALCHEMI large program, focusing on the physical and chemical properties of giant molecular clouds in the heart of the starburst galaxy NGC 253. Our main results are summarized as follows:
HCNH+ emission is widespread with a radial extent of ~300 pc in the central molecular zone, effectively tracing large-scale gas structures within the CMZ of NGC 253.
Our non-LTE analysis yields HCNH+ column densities of (0.3−1.2)×1015 cm−2, with corresponding HCNH+ abundances relative to H2 of (1.8−9.4)×10−9. Most of these HCNH+ abundances are higher than all reported values in the Milky Way. This highlights the elevated HCNH+ abundances in the CMZ of NGC 253. Furthermore, we observed a trend of decreasing HCNH+ abundances in GMCs as they approach the center of the CMZ.
Using the quantum mechanical coupled states’ approximation, we calculated collisional rate coefficients for HCNH+ induced by para-H2 and ortho-H2 at kinetic temperatures up to 500 K. Incorporating these new coefficients into a non-LTE modeling framework and applying Monte Carlo Markov chain analysis, we suggest that HCNH+ emissions originate from []regions with H2 number densities of ~102.80–103.55 cm−3 with typical errors of ~0.2 dex, confirming HCHN+ as a tracer of low-density regions, even in nuclear starburst environments.
Astrochemical calculations assuming static, PDR, and shock environments have been performed. These modeling results indicate that the unexpectedly high HCNH+ abundances observed in the CMZ of NGC 253 can be attributed to chemical enhancement, driven by elevated gas temperatures and cosmic ray ionization rates in shocked, low-density gas.
The detection of HCNH+ in the CMZ of NGC 253 reveals significant differences compared to its presence in quiescent molecular clouds in the solar neighborhood. This study opens new avenues for understanding the complex chemistry and physical conditions in extreme environments of starburst galaxies. Given its role as a tracer of low-density regions, future investigations could benefit from mapping HCNH+ across various galactic environments to explore its potential as a diagnostic tool for studying various stages of molecular cloud evolution, the early stages of star formation, and the impacts of star formation feedback.
Data availability
Animated figures associated to Fig. 10 are available at https://gongyan2444.github.io/img/c-shock-zeta1e3.gif and https://gongyan2444.github.io/img/c-shock-zeta1e5.gif.
The HCNH+ data cubes and corresponding masks are available via https://zenodo.org/records/14959763.
The masking script is available at https://github.com/shbzhang/MaskingNGC253
Acknowledgement
We acknowledge the ALMA staff for their assistance with our observations. Y.G. is supported by the Strategic Priority Research Program of the Chinese Academy of Sciences, Grant No. XDB0800301. C.H. acknowledges support by the Chinese Academy of Sciences President’s International Fellowship Initiative under grant No. 2025PVA0048. We also acknowledge financial support from the European Research Council (Consolidator Grant COLLEXISM, Grant Agreement No. 811363) and the support from CEA/GENCI for granting us access to the TGCC/IRENE supercomputer under the A0110413001 project. F.J.D. is supported by National Key R&D Program of China grant 2023YFA1608000 and NSFC grant 12041305. S.V and M.B acknowledge the support from the European Research Council (ERC) Advanced Grant MOPPEX 833460. X.D.T. acknowledges the support of the National Key R&D Program of China under grant No. 2023YFA1608002, the Chinese Academy of Sciences (CAS) “Light of West China” Program under grant No. xbzg-zdsys-202212, the Tianshan Talent Program of Xinjiang Uygur Autonomous Region under grant No. 2022TSY- CLJ0005, and the Natural Science Foundation of Xinjiang Uygur Autonomous Region under grant No. 2022D01E06. W.Y. acknowledges the support from the National Natural Science Foundation of China (12403027), China Postdoctoral Science Foundation (2024M751376), and Jiangsu Funding Programme for Excellent Postdoctoral Talent (2024ZB347). This research has made use of spectroscopic and collisional data from the EMAA database (https://emaa.osug.frandhttps://dx.doi.org/10.17178/EMAA). EMAA is supported by the Observatoire des Sciences de l’Univers de Grenoble (OSUG). This research has made use of NASA’s Astrophysics Data System. This work also made use of the Cube Analysis and Rendering Tool for Astronomy (CARTA) software (Comrie et al. 2021) and Python libraries including Astropy (https://www.astropy.org/, Astropy Collaboration 2013), NumPy (https://www.numpy.org/, van der Walt et al. 2011), SciPy (https://www.scipy.org/, Jones et al. 2001), Matplotlib (https://matplotlib.org/, Hunter 2007). This article makes use of the following ALMA data: ADS/JAO.ALMA#2017.1.00161.L and ADS/JAO.ALMA#2018.1.00162.S. ALMA is a partnership of ESO (representing its member states), NSF (USA) and NINS (Japan), together with NRC (Canada), NSTC and ASIAA (Taiwan), and KASI (Republic of Korea), in cooperation with the Republic of Chile. The Joint ALMA Observatory is operated by ESO, AUI/NRAO and NAOJ. The National Radio Astronomy Observatory is a facility of the National Science Foundation operated under cooperative agreement by Associated Universities, Inc. During the review process, we were deeply saddened by the passing of our esteemed colleague, Prof. Karl M. Menten, whose contributions to this work and to the field will always be remembered. We thank the anonymous referee for the helpful comments that improved this manuscript.
Appendix A Assessing errors from coupled state rate coefficients in radiative transfer calculations
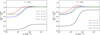 |
Fig. A.1 Dependence of radiation temperature ratios on gas density for the 1 → 0, 2 → 1, 3 → 2, and 4 → 3 emission lines. Superscripts CC and CS denote that the rate coefficients used in the radiative transfer calculations were obtained using the close-coupling (CC) method and the coupled states’ (CS) approximation, respectively. The dashed line indicates perfect agreement between the methods. All calculations are performed under the LVG formalism as implemented in the RADEX code, assuming a FWHM line width of 1.0 km s−1 and an HCNH+ column density of 2.3 × 1013 cm−2 (van der Tak et al. 2007). |
Appendix B Systematic comparison of HCNH+ rate coefficients induced by collisions with o- and p-H2
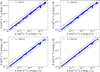 |
Fig. B.1 Comparison of HCNH+ rate coefficients induced by collisions with o- and p-H2 for selected temperatures. The x- and y-axes represent the o- and p-H2 scattering data, respectively. The dashed lines indicate an agreement region within a factor of 2.0. |
Appendix C Modeling the physical properties of GMC6 using the Monte Carlo Markov Chain calculations
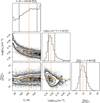 |
Fig. C.1 Posterior probability distributions of gas temperatures, H2 number densities, and HCNH+ column densities for GMC6, with the maximum posterior possibility point in the parameter space highlighted by orange lines and points. Contours represent the 0.5, 1.0, 1.5, and 2.0σ confidence intervals. The vertical dashed lines represent the 1σ spread. |
References
- Agúndez, M., & Wakelam, V. 2013, Chem. Rev., 113, 8710 [Google Scholar]
- Aladro, R., Martín, S., Riquelme, D., et al. 2015, A&A, 579, A101 [NASA ADS] [CrossRef] [EDP Sciences] [Google Scholar]
- Ao, Y., Henkel, C., Menten, K. M., et al. 2013, A&A, 550, A135 [NASA ADS] [CrossRef] [EDP Sciences] [Google Scholar]
- Arthurs, A., & Dalgarno, A. 1960, Proc. R. Soc. London. Ser. A. Math. Phys. Sci., 256, 540 [Google Scholar]
- Astropy Collaboration (Robitaille, T. P., et al.) 2013, A&A, 558, A33 [NASA ADS] [CrossRef] [EDP Sciences] [Google Scholar]
- Bao, M., Harada, N., Kohno, K., et al. 2024, A&A, 687, A43 [NASA ADS] [CrossRef] [EDP Sciences] [Google Scholar]
- Behrens, E., Mangum, J. G., Holdship, J., et al. 2022, ApJ, 939, 119 [NASA ADS] [CrossRef] [Google Scholar]
- Behrens, E., Mangum, J. G., Viti, S., et al. 2024, ApJ, 977, 38 [Google Scholar]
- Bendo, G. J., Beswick, R. J., D’Cruze, M. J., et al. 2015, MNRAS, 450, L80 [NASA ADS] [CrossRef] [Google Scholar]
- Bergner, J. B., Rajappan, M., & Öberg, K. I. 2022, ApJ, 933, 206 [Google Scholar]
- Bolatto, A. D., Warren, S. R., Leroy, A. K., et al. 2013, Nature, 499, 450 [Google Scholar]
- Bop, C. T., & Lique, F. 2023, J. Chem. Phys., 158, 074304 [NASA ADS] [CrossRef] [Google Scholar]
- Bop, C. T., Agúndez, M., Cernicharo, J., Lefloch, B., & Lique, F. 2024, A&A, 681, L19 [NASA ADS] [CrossRef] [EDP Sciences] [Google Scholar]
- Botschwina, P. 1986, Chem. Phys. Lett., 124, 382 [Google Scholar]
- Bouvier, M., Viti, S., Behrens, E., et al. 2024, A&A, 689, A64 [NASA ADS] [CrossRef] [EDP Sciences] [Google Scholar]
- Comrie, A., Wang, K.-S., Hsu, S.-C., et al. 2021, Astrophysics Source Code Library [record ascl:2103.031] [Google Scholar]
- Draine, B. T., Roberge, W. G., & Dalgarno, A. 1983, ApJ, 264, 485 [CrossRef] [Google Scholar]
- Du, F. 2021, Res. Astron. Astrophys., 21, 077 [NASA ADS] [CrossRef] [Google Scholar]
- Du, F., Parise, B., & Bergman, P. 2012, A&A, 538, A91 [NASA ADS] [CrossRef] [EDP Sciences] [Google Scholar]
- Dubernet, M. L., Boursier, C., Denis-Alpizar, O., et al. 2024, A&A, 683, A40 [NASA ADS] [CrossRef] [EDP Sciences] [Google Scholar]
- Elitzur, M. 1992, ARA&A, 30, 75 [NASA ADS] [CrossRef] [Google Scholar]
- Endres, C. P., Schlemmer, S., Schilke, P., Stutzki, J., & Müller, H. S. P. 2016, J. Mol. Spectr., 327, 95 [NASA ADS] [CrossRef] [Google Scholar]
- Ferrero, S., Zamirri, L., Ceccarelli, C., et al. 2020, ApJ, 904, 11 [NASA ADS] [CrossRef] [Google Scholar]
- Fontani, F., Colzi, L., Redaelli, E., Sipilä, O., & Caselli, P. 2021, A&A, 651, A94 [NASA ADS] [CrossRef] [EDP Sciences] [Google Scholar]
- Foreman-Mackey, D., Hogg, D. W., Lang, D., & Goodman, J. 2013, PASP, 125, 306 [Google Scholar]
- Ginsburg, A., Henkel, C., Ao, Y., et al. 2016, A&A, 586, A50 [NASA ADS] [CrossRef] [EDP Sciences] [Google Scholar]
- Goldsmith, P. F., & Langer, W. D. 1999, ApJ, 517, 209 [Google Scholar]
- Gong, Y., Du, F. J., Henkel, C., et al. 2023, A&A, 679, A39 [NASA ADS] [CrossRef] [EDP Sciences] [Google Scholar]
- Goodman, J., & Weare, J. 2010, Commun. Appl. Math. Comput. Sci., 5, 65 [Google Scholar]
- Haasler, D., Rivilla, V. M., Martín, S., et al. 2022, A&A, 659, A158 [CrossRef] [EDP Sciences] [Google Scholar]
- Harada, N., Martín, S., Mangum, J. G., et al. 2021, ApJ, 923, 24 [NASA ADS] [CrossRef] [Google Scholar]
- Harada, N., Martín, S., Mangum, J. G., et al. 2022, ApJ, 938, 80 [NASA ADS] [CrossRef] [Google Scholar]
- Harada, N., Meier, D. S., Martín, S., et al. 2024, ApJS, 271, 38 [NASA ADS] [CrossRef] [Google Scholar]
- Holdship, J., Viti, S., Jiménez-Serra, I., Makrymallis, A., & Priestley, F. 2017, AJ, 154, 38 [NASA ADS] [CrossRef] [Google Scholar]
- Holdship, J., Mangum, J. G., Viti, S., et al. 2022, ApJ, 931, 89 [NASA ADS] [CrossRef] [Google Scholar]
- Hollenbach, D., Kaufman, M. J., Bergin, E. A., & Melnick, G. J. 2009, ApJ, 690, 1497 [NASA ADS] [CrossRef] [Google Scholar]
- Huang, K. Y., Viti, S., Holdship, J., et al. 2023, A&A, 675, A151 [NASA ADS] [CrossRef] [EDP Sciences] [Google Scholar]
- Humire, P. K., Henkel, C., Hernández-Gómez, A., et al. 2022, A&A, 663, A33 [NASA ADS] [CrossRef] [EDP Sciences] [Google Scholar]
- Hunter, J. D. 2007, Comput. Sci. Eng., 9, 90 [NASA ADS] [CrossRef] [Google Scholar]
- Hutson, J., & Green, S. 1994, MOLSCAT computer code, version 14, in Collaborative computational project [Google Scholar]
- Iodice, E., Arnaboldi, M., Rejkuba, M., et al. 2014, A&A, 567, A86 [NASA ADS] [CrossRef] [EDP Sciences] [Google Scholar]
- Jiménez-Serra, I., Caselli, P., Martín-Pintado, J., & Hartquist, T. W. 2008, A&A, 482, 549 [NASA ADS] [CrossRef] [EDP Sciences] [Google Scholar]
- Jones, E., Oliphant, T., Peterson, P., et al. 2001, SciPy: Open source scientific tools for Python [Google Scholar]
- Karachentsev, I. D., Grebel, E. K., Sharina, M. E., et al. 2003, A&A, 404, 93 [CrossRef] [EDP Sciences] [Google Scholar]
- Kerkeni, B., & Simmie, J. M. 2023, J. Phys. Chem. A, 127, 5382 [NASA ADS] [CrossRef] [Google Scholar]
- Knight, J. S., Petrie, S. A. H., Freeman, C. G., et al. 1988, J. Am. Chem. Soc., 110, 5286 [CrossRef] [Google Scholar]
- Leroy, A. K., Bolatto, A. D., Ostriker, E. C., et al. 2015, ApJ, 801, 25 [NASA ADS] [CrossRef] [Google Scholar]
- Loison, J.-C., Wakelam, V., Hickson, K. M., Bergeat, A., & Mereau, R. 2014, MNRAS, 437, 930 [Google Scholar]
- López-Sepulcre, A., Balucani, N., Ceccarelli, C., et al. 2019, ACS Earth Space Chem., 3, 2122 [CrossRef] [Google Scholar]
- Loreau, J., Lique, F., & Faure, A. 2018, ApJ, 853, L5 [NASA ADS] [CrossRef] [Google Scholar]
- Mangum, J. G., Ginsburg, A. G., Henkel, C., et al. 2019, ApJ, 871, 170 [NASA ADS] [CrossRef] [Google Scholar]
- Martín, S., Mauersberger, R., Martín-Pintado, J., Henkel, C., & García-Burillo, S. 2006, ApJS, 164, 450 [Google Scholar]
- Martín, S., Mangum, J. G., Harada, N., et al. 2021, A&A, 656, A46 [NASA ADS] [CrossRef] [EDP Sciences] [Google Scholar]
- McElroy, D., Walsh, C., Markwick, A. J., et al. 2013, A&A, 550, A36 [NASA ADS] [CrossRef] [EDP Sciences] [Google Scholar]
- McGuire, P., & Kouri, D. J. 1974, J. Chem. Phys., 60, 2488 [CrossRef] [Google Scholar]
- Neufeld, D. A., & Wolfire, M. G. 2017, ApJ, 845, 163 [Google Scholar]
- Neufeld, D. A., Melnick, G. J., Sonnentrucker, P., et al. 2006, ApJ, 649, 816 [NASA ADS] [CrossRef] [Google Scholar]
- Padovani, M., Ivlev, A. V., Galli, D., & Caselli, P. 2018, A&A, 614, A111 [NASA ADS] [CrossRef] [EDP Sciences] [Google Scholar]
- Pérez-Beaupuits, J. P., Güsten, R., Harris, A., et al. 2018, ApJ, 860, 23 [Google Scholar]
- Phan, V. H. M., Peretti, E., Cristofari, P., Gusdorf, A., & Mertsch, P. 2024, MNRAS, 531, 2930 [NASA ADS] [CrossRef] [Google Scholar]
- Pirlot Jankowiak, P., Lique, F., & Dagdigian, P. 2023, MNRAS, 523, 3732 [NASA ADS] [CrossRef] [Google Scholar]
- Quénard, D., Vastel, C., Ceccarelli, C., et al. 2017, MNRAS, 470, 3194 [Google Scholar]
- Rekola, R., Richer, M. G., McCall, M. L., et al. 2005, MNRAS, 361, 330 [NASA ADS] [CrossRef] [Google Scholar]
- Rico-Villas, F., Martín-Pintado, J., González-Alfonso, E., Martín, S., & Rivilla, V. M. 2020, MNRAS, 491, 4573 [NASA ADS] [CrossRef] [Google Scholar]
- Sakamoto, K., Mao, R.-Q., Matsushita, S., et al. 2011, ApJ, 735, 19 [CrossRef] [Google Scholar]
- Sanders, D. B., Mazzarella, J. M., Kim, D. C., Surace, J. A., & Soifer, B. T. 2003, AJ, 126, 1607 [Google Scholar]
- Schilke, P., Walmsley, C. M., Millar, T. J., & Henkel, C. 1991, A&A, 247, 487 [Google Scholar]
- Schöier, F. L., van der Tak, F. F. S., van Dishoeck, E. F., & Black, J. H. 2005, A&A, 432, 369 [Google Scholar]
- Shirley, Y. L. 2015, PASP, 127, 299 [Google Scholar]
- Silva, W. G. D. P., Bonah, L., Schmid, P. C., Schlemmer, S., & Asvany, O. 2024, J. Chem. Phys., 160, 071101 [Google Scholar]
- Sobolev, V. V. 1960, Moving Envelopes of Stars (Cambridge: Harvard University Press) [Google Scholar]
- Strickland, D. K., Heckman, T. M., Weaver, K. A., & Dahlem, M. 2000, AJ, 120, 2965 [NASA ADS] [CrossRef] [Google Scholar]
- Tanaka, K., Mangum, J. G., Viti, S., et al. 2024, ApJ, 961, 18 [NASA ADS] [CrossRef] [Google Scholar]
- Tielens, A. G. G. M. 2005, The Physics and Chemistry of the Interstellar Medium (Cambridge: Cambridge University Press) [Google Scholar]
- Tritsis, A., Basu, S., & Federrath, C. 2023, MNRAS, 521, 5087 [NASA ADS] [CrossRef] [Google Scholar]
- Turner, B. E. 1985, ApJ, 299, 312 [NASA ADS] [CrossRef] [Google Scholar]
- Turner, J. L., & Ho, P. T. P. 1985, ApJ, 299, L77 [NASA ADS] [CrossRef] [Google Scholar]
- van der Tak, F. F. S., & van Dishoeck, E. F. 2000, A&A, 358, L79 [NASA ADS] [Google Scholar]
- van der Tak, F. F. S., Black, J. H., Schöier, F. L., Jansen, D. J., & van Dishoeck, E. F. 2007, A&A, 468, 627 [NASA ADS] [CrossRef] [EDP Sciences] [Google Scholar]
- van der Walt, S., Colbert, S. C., & Varoquaux, G. 2011, Comput. Sci. Eng., 13, 22 [Google Scholar]
- van der Tak, F. F. S., Lique, F., Faure, A., Black, J. H., & van Dishoeck, E. F. 2020, Atoms, 8, 15 [Google Scholar]
- Ziurys, L. M., & Turner, B. E. 1986, ApJ, 302, L31 [Google Scholar]
The masking script is available from this link.
In a single spectral plane, each pixel has 9 connected neighbors, including itself. In a data cube, each spectral plane has two adjacent spectral planes. Hence, each pixel has 27 connected neighbors in total. Excluding the pixel itself, 26-connected neighbors remain. If the central pixel has an intensity above 3σ threshold, the 26-connected neighbors are included in the mask.
The data cubes are available via this link.
j2 stands for the rotational quantum number of H2.
j1 stands for the rotational quantum number of HCNH+.
All Tables
All Figures
|
Fig. 1 Distribution of HCNH+ (2−1) in the CMZ of NGC 253. (a) HCNH+ (2−1) integrated intensity map (taken from Harada et al. 2024), clipped at the 3σ level. The contours start from 2.7 K km s−1 (3σ) and increase by 2.7 K km s−1. (b) HCNH+ (21) integrated intensity map that has been convolved to a circular beam of 4″ . The smoothed image manifests the large-scale structures traced by HCNH+ transitions. The contours start from 0.9 K km s−1 (3σ) and increase by 0.9 K km s−1. In each panel, the beam is shown in the lower-left corner, and the pluses indicate the positions of the nine most prominent GMCs. |
| In the text | |
|
Fig. 2 Observed H13CN and HCNH+ spectra (all with a common circular beam of 1.″6) of the nine GMCs indicated in Fig. 1 and Table 1. H13CN (1−0), HCNH+ (2−1), HCNH+ (3−2), HCNH+ (4−3), and HCNH+ (5−4) are indicated by black, red, green, blue, and purple lines, respectively. The fits to the HCNH+ spectra are indicated by black dotted lines. H13CN (1−0) spectra are scaled by a factor of 0.1 for better visualization. In each panel, the systemic LSR velocity is indicated by the vertical black dashed line. The potentially blended lines are marked by short vertical lines in the corresponding panels, with the associated species labeled in the central panel for GMC5. |
| In the text | |
|
Fig. 3 Distributions of HCNH+ (2−1) (a), HCNH+ (3−2) (b), HCNH+ (4−3) (c), and HCNH+ (5−4) (d) emission in the CMZ of NGC 253. All intensity maps are integrated from 100 to 400 km s−1 and share a common integrated-intensity scale indicated by the color bar. In each panel, the overlaid contours represent the integrated intensities of respective HCNH+ transitions, starting at 1.2 K km s−1 and increasing by 1.2 K km s−1. The positions of the nine GMCs are marked with plus symbols. In each panel, the beam is shown in the lower-left corner. |
| In the text | |
|
Fig. 4 Rotational diagrams of HCNH+ for the selected GMCs. In each panel, the dashed line represents the linear least squares fit to the observed data points. The fit results for each GMC are shown in the lower-left corner of each panel. |
| In the text | |
|
Fig. 5 HCNH+ abundances as a function of H2 column density. The colors represent the distances of GMCs to GMC5 which is located at the center of the CMZ of NGC 253. The circles represent HCNH+ abundances derived using the LTE approach (see Sect. 3), while the squares represent those obtained from the non-LTE approach (see Sect. 3.3.2). The cyan-shaded region indicates the observed HCNH+ abundances of ≲2 × 10⁻⁹ previously reported in the Milky Way, while the brown- shaded region marks the abundances reported toward Sgr B2. |
| In the text | |
|
Fig. 6 Temperature dependence of the HCNH+ rate coefficients induced by collisions with p-H2 (dashed lines) and o-H2 (solid lines). |
| In the text | |
|
Fig. 7 Comparison of two datasets of rate coefficients for HCNH+ induced by collisions with p-H2(j2 = 0). The x-axis represents the first dataset, computed using the “exact” CC method (Bop & Lique 2023), while the y-axis represents the second dataset, calculated in this work using the CS approximation. The dashed lines indicate an agreement region within a factor of 2.0. Different colors represent their weighted mean error factors (WMEF) which are defined in Eq. (1). |
| In the text | |
|
Fig. 8 Environmental influence on HCNH+ abundances relative to H2 as a function of time, calculated from the static models of Chempl (Du 2021). (a) Modeling results for different gas temperatures with |
| In the text | |
|
Fig. 9 HCNH+ abundance as a function of visual extinctions at different interstellar radiation fields and cosmic ray ionization rates, calculated from the PDR models of Chempl (Du 2021). The corresponding values are shown in the legend. The cyan-shaded region indicates the observed HCNH+ abundances in this study. |
| In the text | |
|
Fig. 10 Physical structures and the evolution of HCNH+ abundances in C-type shocks, calculated from the UCLCHEM models (Holdship et al. 2017). Top: C-shock physical structures of our models for the three different shock velocities. The black and orange lines represent the density and temperature profiles of shock models. Bottom: HCNH+ abundances as a function of time for C-type shocks. The preshock gas density is fixed to 103 cm−3 in the models. Different lines correspond to different cosmic ray ionization rates and shock velocities which are shown in the legend. The cyan-shaded region indicates the observed HCNH+ abundances in this study. GIF animations of the shock models at a given ζ = 103ζ0 and ζ = 105ζ0 are available via link1 and link2, respectively. |
| In the text | |
|
Fig. 11 Schematic diagram of the simplified chemical network that dominates the HCNH+ chemistry in the shock model. |
| In the text | |
|
Fig. A.1 Dependence of radiation temperature ratios on gas density for the 1 → 0, 2 → 1, 3 → 2, and 4 → 3 emission lines. Superscripts CC and CS denote that the rate coefficients used in the radiative transfer calculations were obtained using the close-coupling (CC) method and the coupled states’ (CS) approximation, respectively. The dashed line indicates perfect agreement between the methods. All calculations are performed under the LVG formalism as implemented in the RADEX code, assuming a FWHM line width of 1.0 km s−1 and an HCNH+ column density of 2.3 × 1013 cm−2 (van der Tak et al. 2007). |
| In the text | |
|
Fig. B.1 Comparison of HCNH+ rate coefficients induced by collisions with o- and p-H2 for selected temperatures. The x- and y-axes represent the o- and p-H2 scattering data, respectively. The dashed lines indicate an agreement region within a factor of 2.0. |
| In the text | |
|
Fig. C.1 Posterior probability distributions of gas temperatures, H2 number densities, and HCNH+ column densities for GMC6, with the maximum posterior possibility point in the parameter space highlighted by orange lines and points. Contours represent the 0.5, 1.0, 1.5, and 2.0σ confidence intervals. The vertical dashed lines represent the 1σ spread. |
| In the text | |
Current usage metrics show cumulative count of Article Views (full-text article views including HTML views, PDF and ePub downloads, according to the available data) and Abstracts Views on Vision4Press platform.
Data correspond to usage on the plateform after 2015. The current usage metrics is available 48-96 hours after online publication and is updated daily on week days.
Initial download of the metrics may take a while.