Fig. 7
Download original image
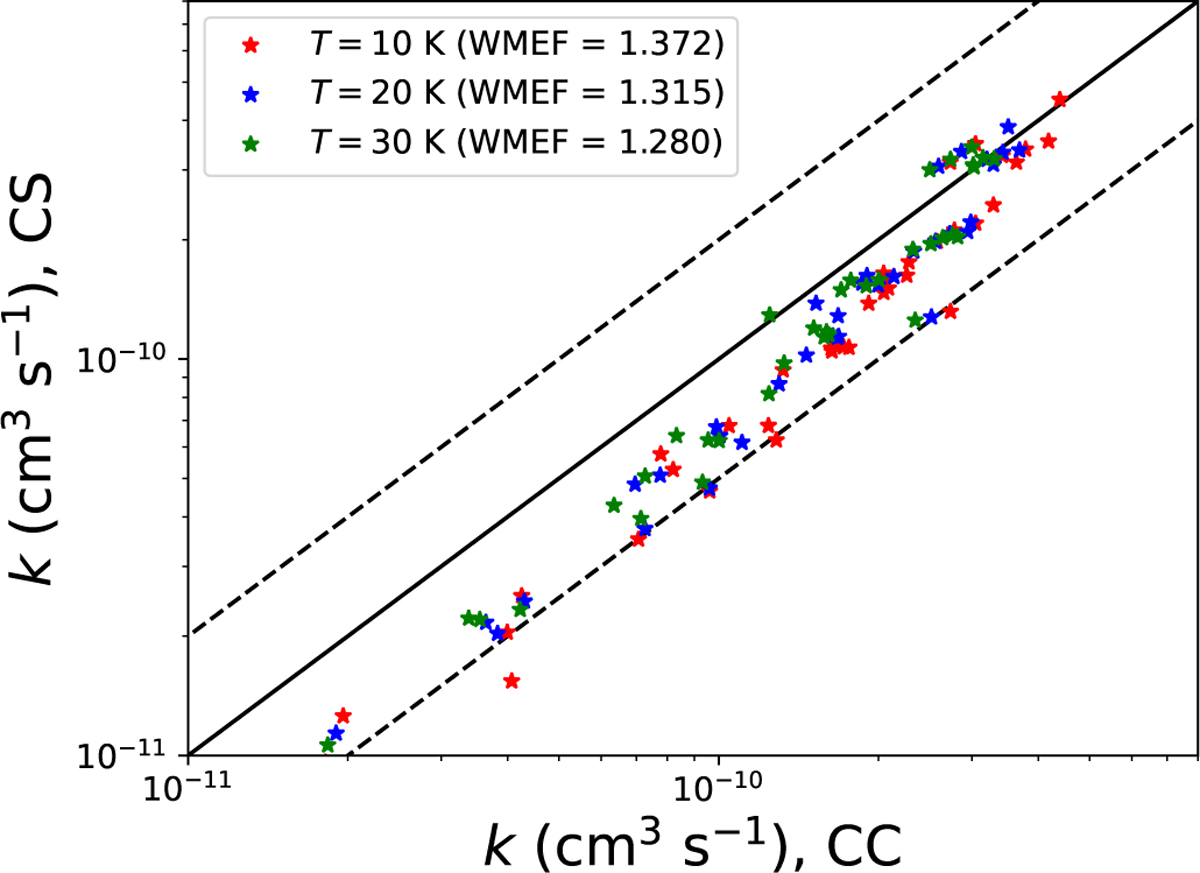
Comparison of two datasets of rate coefficients for HCNH+ induced by collisions with p-H2(j2 = 0). The x-axis represents the first dataset, computed using the “exact” CC method (Bop & Lique 2023), while the y-axis represents the second dataset, calculated in this work using the CS approximation. The dashed lines indicate an agreement region within a factor of 2.0. Different colors represent their weighted mean error factors (WMEF) which are defined in Eq. (1).
Current usage metrics show cumulative count of Article Views (full-text article views including HTML views, PDF and ePub downloads, according to the available data) and Abstracts Views on Vision4Press platform.
Data correspond to usage on the plateform after 2015. The current usage metrics is available 48-96 hours after online publication and is updated daily on week days.
Initial download of the metrics may take a while.