| Issue |
A&A
Volume 699, July 2025
|
|
|---|---|---|
| Article Number | A70 | |
| Number of page(s) | 19 | |
| Section | Extragalactic astronomy | |
| DOI | https://doi.org/10.1051/0004-6361/202554156 | |
| Published online | 08 July 2025 | |
Investigating the chemical link between H2CO and CH3OH within the central molecular zone of NGC 253
1
Leiden Observatory, Leiden University, PO Box 9513 2300 RA Leiden, The Netherlands
2
Department of Astronomy, University of Virginia, PO Box 400325 530 McCormick Road, Charlottesville, VA 22904-4325, USA
3
National Radio Astronomy Observatory, 520 Edgemont Road, Charlottesville, VA 22903-2475, USA
4
Transdisciplinary Research Area (TRA) ‘Matter’/Argelander-Institut für Astronomie, University of Bonn, Auf dem Hügel 71 53121 Bonn, Germany
5
Physics and Astronomy, University College, London, UK
⋆ Corresponding author: This email address is being protected from spambots. You need JavaScript enabled to view it.
Received:
17
February
2025
Accepted:
13
May
2025
Abstract
Context. The formaldehyde (H2CO) and methanol (CH3OH) molecules have served as traditional tracers of the star formation process for decades. Studies of the environments that produce formaldehyde and methanol emission, though, have pointed to significant differences in the physical environments within which each molecule resides.
Aims. In this article we aim to investigate the detailed physical and chemical conditions that give rise to formaldehyde and methanol emission in the nearby starburst galaxy NGC 253.
Methods. We employed high spatial (1.′′6 or ∼28 pc) and spectral (∼10 km/s) resolution imaging of the NGC 253 central molecular zone (CMZ) from the ALCHEMI Large Program to constrain radiative transfer models of the dense gas volume density, kinetic temperature, molecular species column density, and source filling factor within eight giant molecular clouds (GMCs). We also measured the relative abundances of the two nuclear spin isomers of CH3OH to investigate its formation history.
Results. The physical and chemical conditions derived clearly indicate that these two molecular species originate from distinct physical environments. H2CO traces low volume densities and high kinetic temperatures, while CH3OH traces high volume densities and low kinetic temperatures. The H2CO abundances are constant, though poorly constrained, within the eight NGC 253 GMCs analysed, while the CH3OH abundance shows a radial gradient from low to high values within the NGC 253 CMZ.
Conclusions. Our findings highlight the complex chemical and physical differentiation of CH3OH and H2CO in the starburst environment of NGC 253. Methanol formation appears to be influenced by warm, dynamic processes rather than cold cloud chemistry, while formaldehyde primarily forms via gas-phase reactions. These results challenge the assumption of a direct chemical link between CH3OH and H2CO and underscores the impact of starburst-driven shocks, turbulence, and cosmic rays on molecular gas chemistry.
Key words: ISM: molecules / galaxies: ISM / galaxies: individual: NGC 253 / galaxies: nuclei
Jansky Fellow of the National Radio Astronomy Observatory.
© The Authors 2025
 Open Access article, published by EDP Sciences, under the terms of the Creative Commons Attribution License (https://creativecommons.org/licenses/by/4.0), which permits unrestricted use, distribution, and reproduction in any medium, provided the original work is properly cited.
This article is published in open access under the Subscribe to Open model. This email address is being protected from spambots. You need JavaScript enabled to view it. to support open access publication.
1. Introduction
The evolution of galaxies is shaped by several key physical and chemical processes within the interstellar medium (ISM). Such processes are often tied to star formation and active galactic nucleus (AGN) activities. Strong stellar feedback associated with high star-forming rates (SFRs) can trigger outflows of ionized, neutral, and molecular gas. The significant energy input from starburst activities makes starburst galaxies prime targets for investigating feedback processes in the ISM (Melioli & de Gouveia Dal Pino 2004; Krieger et al. 2020)
NGC 253 is a barred spiral galaxy with an inclination of 76° (McCormick et al. 2013) that makes it almost edge-on. The proximity of NGC 253 (D ∼ 3.5 ± 0.2 Mpc, Rekola et al. 2005) also makes it one of the best-studied starburst systems. The central molecular zone (CMZ) of NGC 253 extends approximately 300 × 100 pc (Sakamoto et al. 2011) and encompasses more than ten extensively studied giant molecular clouds (GMCs). With a SFR of ∼2 M⊙ yr−1 arising from its CMZ (Leroy et al. 2015; Bendo et al. 2015), which is half of its global star formation activity, NGC 253 is also classified as a prototype of a nuclear starburst system. A large-scale outflow in NGC 253 has been revealed by multi-wavelength observations: in X-rays (Strickland et al. 2000, 2002), Hα (Westmoquette et al. 2011), molecular emission (Turner 1985; Bolatto et al. 2013; Walter et al. 2017; Krieger et al. 2019), and dust (Levy et al. 2022). This large-scale outflow is considered a result of the galaxy’s starburst activity (McCarthy et al. 1987) due to the lack of AGN signatures (Müller-Sánchez et al. 2010; Lehmer et al. 2013). At more localized scales, shocks and turbulence also contribute mechanical energy to the ISM feedback processes.
To trace shocks, there are well-known molecular tracers such as silicon monoxide (SiO) and isocyanic acid (HNCO) (Martín-Pintado et al. 1997; Schilke et al. 1997; Hüttemeister et al. 1998; Zinchenko et al. 2000; Jiménez-Serra et al. 2008; Martín et al. 2008; Rodríguez-Fernández et al. 2010). The presence of gas-phase methanol (CH3OH) in the ISM of starburst galaxies has also been proposed as an indicator of the shock influence. As the simplest complex organic molecule (COM; Herbst & van Dishoeck 2009), CH3OH can form efficiently in cold environments (12–20 K) on ice grains with continuous hydrogenation of CO (Fuchs et al. 2009) and H-abstraction reaction of radicals on ice grains (Álvarez-Barcia et al. 2018; Simons et al. 2020; Santos et al. 2022). The solid-state CH3OH can be liberated into the gas phase via thermal sublimation or non-thermal desorption processes. In the presence of shocks, ice mantle sputtering quickly releases solid-state CH3OH into the gas phase. On the other hand, the destruction of CH3OH can also take place in the presence of dissociative shock conditions, as was proposed by Suutarinen et al. (2014). Nevertheless, overall, the non-dissociative shocks remain efficient in enhancing gas-phase CH3OH in the ISM.
Formaldehyde (H2CO) is an important precursor of CH3OH in its formation process on ice grains. Unlike methanol, however, H2CO can also form in the cold gas phase by reactions of CH2 and CH3 with O2 and O, respectively, depending on the region (Ramal-Olmedo et al. 2021). In warmer regions, H2CO can form by reactions of CH3+ with OH (Woodall et al. 2007). As a slightly asymmetric rotor, H2CO has been found to be an excellent tracer of the gas kinetic temperature (Mangum & Wootten 1993).
Molecules that host two or more hydrogen atoms, such as H2O, H2CO, and NH3, exist in two isomeric forms: ortho- (hydrogen nuclei spin are parallel) and para- (hydrogen nuclei spin are anti-parallel). Both CH3OH and H2CO have two spin isomers. For CH3OH, they are referred to as E- and A- CH3OH owing to the combinations of nuclear spin alignment in the three H-atoms of the methyl (CH3) group. In A-type CH3OH, the nuclear spins of the three protons in the methyl group are parallel. For E-type CH3OH, one of the protons in the methyl group has an anti-parallel nuclear spin with respect to the others. The E/A ratio can be a probe of the history of methanol formation (see Section 5.3). On the other hand, for H2CO, the two nuclear spin isomers are referred to as o- and p- H2CO. Observationally the spin isomers of both molecules have different spectroscopic properties including transition frequencies.
Both CH3OH and H2CO have been imaged in NGC 253. In particular, Mangum et al. (2019) imaged the CMZ of NGC 253 with multi-transition H2CO observations at spatial resolution  and found that, while at large scales (
 ) Tkin ≳ 50 K, at smaller scales (≲1.5′′) temperatures were at least 300 K, highlighting the importance of having a high spatial resolution in order to determine the real temperature structure of the central region of this starburst galaxy. CH3OH was imaged by the ALMA large program, ‘ALMA Comprehensive High-resolution Extragalactic Molecular Inventory’ (ALCHEMI, Martín et al. 2021). Several ALCHEMI studies have already been published and have revealed a high cosmic-ray ionization rate (Holdship et al. 2021, 2022; Harada et al. 2021; Behrens et al. 2022, 2024), as well as various types of shocks throughout the CMZ (e.g. Humire et al. 2022; Harada et al. 2022; Huang et al. 2023).
The aim of the current study is to investigate both the physical and chemical properties traced by CH3OH and H2CO in the nearby starburst galaxy, NGC 253, and investigate whether the two species are chemically linked. We present a multi-transition molecular study using CH3OH and H2CO observations from the ALMA large program, ALCHEMI (Martín et al. 2021). The paper is structured as follows. In Section 2 we describe the observations and the transition selections for our analysis. In Section 3 we discuss the molecular transition intensity images. In Section 4 we present our non-local thermodynamic equilibrium (non-LTE) radiative transfer analysis in order to constrain the physical conditions of the gas traced by CH3OH and H2CO. We then explore in Section 5 the physical origin of the CH3OH and H2CO emission and investigate whether these two molecules are chemically linked. This discussion includes an assessment of the relative abundances of CH3OH, H2CO, SiO, HNCO, OCS, H2CS, H2S, and CS within eight of the GMCs of the NGC 253 CMZ. We then summarize our findings in Section 6.
2. Observations and data analysis
In this section we summarize the observational set-up and the fundamental properties of the ALCHEMI survey data. Full details regarding the data acquisition, calibration, and imaging are described in Martín et al. (2021). ALCHEMI is an ALMA Large Program (project code 2017.1.00161.L and 2018.1.00162.S) that imaged the CMZ of NGC 253 with rest-frequency coverage from 84.2 to 373.2 GHz, corresponding to the ALMA frequency Bands 3, 4, 5, 6, and 7. With wide and thorough spectral scanning across the CMZ of NGC 253, ALCHEMI provides a comprehensive molecular view of its nucleus. A common rectangular area with a size of 50′′ × 20′′ (850 × 340 pc) at a position angle of 65° was imaged to cover the central nuclear region in NGC 253. A common maximum recoverable angular scale of 15′′ was achieved after combining the 12 m Array and Atacama Compact Array (ACA) measurements at all frequencies. The nominal phase center of the observations is α(ICRS)=00h47m33s.26, δ(ICRS) = −25°17′17 . The angular and spectral resolution of the image cubes generated from these measurements were
  (∼28 pc, Martín et al. 2021) and ∼10 km s−1, respectively.
From the ALCHEMI data, we extracted the spectral cubes of NGC 253 for the selected 39 CH3OH transitions (Table 1) and ten H2CO transitions (Table 2). We chose CH3OH and H2CO transitions based on the following criteria: (1) the transition needs to be bright enough, specifically with a signal-to-noise ratio (S/N) greater than 3; and (2) no significant contamination from other molecule(s) involved. In regard to this criterion, we note that the methanol transitions at 165 GHz and 302 GHz are blended with, respectively, an SO2 transition (∼27%) and an NH2OH transition (∼23%), while the H2CO transitions at 140 GHz and 364 GHz suffer from contamination by, respectively, a transition of NH2CN (∼25%) and a transition of SO2 (∼25%). We have tested the impact of these contaminants on our derivation of physical parameters performed in Section 3 and found that the derived physical parameters are unchanged within the uncertainties in each parameter fit. Note that we do include transitions that show self blending, including among different spin isomers (see Table A.1).
CH3OH transitions in this study
List of H2CO transitions in this study
We note that our compilation of CH3OH transitions is distinct from the set of CH3OH transitions analysed by Humire et al. (2022), which had different transition selection criteria from ours and focused on masing CH3OH. Specifically, our list of CH3OH transitions does not involve any maser candidates from Humire et al. (2022).
We used CubeLineMoment1 (Mangum et al. 2019) to extract integrated spectral-line intensities from our data cubes. CubeLineMoment employs a set of spectral and spatial masks to extract robust integrated intensities for a defined list of target spectral frequencies. The spectral masking process of CubeLineMoment uses a chosen bright spectral line in each cube as a velocity tracer of the inspected gas component. This makes the definition of velocity span for integration precise, while avoiding contamination from adjacent but still separable transitions. Final products from the CubeLineMoment analysis include moment 0 (integrated intensity; Jy beam−1 ⋅ km s−1), 1 (average velocity; km s−1), and 2 (velocity dispersion; km s−1) images masked below a 3σ threshold (channel-based). After making the velocity-integrated maps (moment-0 maps) for all the selected transitions, we converted them from [Jy beam−1 ⋅ km s−1] to [K ⋅ km s−1] for further physical modelling analysis using Equation (1).
3. Molecular line emission
In Fig. 1 we present the velocity-integrated transition intensity images from the CH3OH 96.7 GHz transition group and H2CO 212 − 111 transition as representative cases for each species (see Appendix B for the integrated intensity maps for all transitions listed in Tables 1 and 2). We also show the representative spectra extracted from GMC 6 for all transitions analysed in this work in Appendix A (Figs. A.1 and A.2). We converted the integrated emission from Jy beam−1 km s−1 to K km s−1 using the following expression:
 (1)
(1)
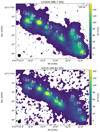 |
Fig. 1. Moment-0 maps of all the CH3OH transitions in the 96 GHz group and the H2CO 212 − 111 transition near 140 GHz showing integrated emission with S/N > 3. White circles indicate the locations of GMCs studied in Huang et al. (2023). The black circle in bottom left corner represents the 1 |

where ν is the rest frequency of the line, θmax and θmin are the major and minor axes, respectively, of our Gaussian beam, and I is the integrated intensity.
The molecular line emission presented in Fig. 1 shows several bright regions across the CMZ of NGC 253. Overall they match well with the line emission spatial distribution reported by prior ALCHEMI studies with other molecular species – including C2H (Holdship et al. 2022), HCO+ and HOC+ (Harada et al. 2021), H3O+ and SO (Holdship et al. 2022), HOCO+ (Harada et al. 2022), HCN and HNC (Behrens et al. 2022, 2024), HNCO and SiO (Huang et al. 2023), sulphur-bearing species (Bouvier et al. 2024), and CO and their isotopologues (Butterworth et al. 2024).
We note that absorption features in GMC 5 – due to the strong continuum in the background towards the center of the galaxy and potential self-absorption in the optically thick regime – have been reported from multiple studies with different species (e.g., Meier et al. 2015; Humire et al. 2022). Such features are also seen in our data. To interpret the intensity measurements from this region requires an advanced radiative-transfer model that includes strong background continuum emission. Such a modelling effort is beyond the scope of the present study. Additionally, in GMC 10, there is a lack of detection in most transitions. As a result, we do not discuss these two regions (GMCs 5 and 10) any further. The positions of all the remaining GMCs are listed in Table 3. These eight GMC regions are also marked as white circles on both representative CH3OH and H2CO moment-0 images shown in Fig. 1.
4. Non-LTE radiative transfer modelling analysis
We performed non-LTE radiative transfer modelling to characterize the average gas properties traced by CH3OH and H2CO over beam-sized ( or 28 pc) structures. Given the plethora of transitions we have measured for both species, spanning a wide range in excitation energy, radiative transfer analysis can be used to properly constrain the gas physical characteristics. We used the radiative transfer code RADEX (van der Tak et al. 2007) via the Python package SpectralRadex2 (Holdship et al. 2021). The collisional excitation rates used for CH3OH are from Dagdigian (2023), while the H2CO rates are from Wiesenfeld & Faure (2013). These rates were obtained from the Excitation of Molecules and Atoms for Astrophysics (EMAA)3 and the LAMDA databases (Schöier et al. 2005), respectively. For kinetic temperature priors below or above the lower or upper limits to the kinetic temperatures at which collisional excitation rates are provided (3 to 250 and 10 to 300 K for CH3OH and H2CO, respectively), SpectralRadex uses the minimum or maximum kinetic temperature at which collisional excitation rates are provided.
One should note that there is a noticeable difference in the derived E-/A- spin isomer column density ratio (EAR) for CH3OH when using the old (from Rabli & Flower 2010) and the new (from Dagdigian 2023) collisional excitation rates. With the Rabli & Flower (2010) rates, the average range for the best EAR was 0.85–2.84, whilst with the Dagdigian (2023) rates, the range is 0.25–1.26. By comparing the brightness temperatures for the 30 − 20A and 2−1 − 1−1E lines of CH3OH at 145.103 GHz and 96.739 GHz, respectively, Dagdigian (2023) showed that the largest difference in both quantities occurred for the E-type transition at low temperature (10 K; see their Fig. 5), with the brightness temperature calculated with the new rates being lower (by maximum 10%) than with the previous rates, in particular for nH2 ≥ 104 cm−3. The difference is less important at 100 K. Although the comparison has been made for one E-type transition, this difference could explain the change in the derived EAR between the old and new excitation rates that we found. The choice of rates used for CH3OH thus seems more critical if one aims to derive the EAR.
We coupled radiative transfer modelling with the Nautilus sampler (Lange 2023)4 for Bayesian posterior and evidence estimation. We then performed the Bayesian inference of the parameter probability distributions. We assumed priors of uniform or log-uniform distribution within the determined ranges (listed in Table 4). We also assumed that the uncertainty on our measured intensities is Gaussian so that our likelihood is given by  where χ2 is the chi-squared statistic between our measured intensities and the RADEX predictions based on a set of parameters, θ. This allowed us to assess the influence of the physical conditions in the excitation of the transitions analysed. Note that for each blending group, we modelled the integrated intensities of the transitions that make up the blending group separately, summed up the emission from each of these lines, and then compared this summed value to the total measured blended intensity for that group.
The following physical parameters were explored: the gas volume density (nH2), the gas kinetic temperature (Tkin), the species column density of both spin isomers of each molecule (N(E-CH3OH) and N(A-CH3OH) for CH3OH and N(o-H2CO) and N(p-H2CO) for H2CO), and the beam filling factor ( ). The prior ranges and distributions are given in Table 4.
We list the best fit for all the explored parameters in Tables 5 and 6, and present the inference results from a representative GMC (GMC 3) for both CH3OH and H2CO in Fig. 2. The rest of the inference results can be found in Appendix C. In the following subsections we discuss our findings.
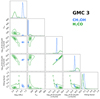 |
Fig. 2. Inference results from GMC 3 with both CH3OH (blue) and H2CO (green). |
4.1. Properties of the gas as traced by CH3OH and H2CO
In general CH3OH traces dense gas components, with a gas volume density ranging from ∼105 − 107 cm−3. The methanol in the inner GMCs (GMCs 3, 4, 6, 7) traces the densest gas components (nH2 ≳ 4 × 10⁵ − 107 cm−3) compared to the rest of the GMCs in the outer regions (nH2 ≤ 2 × 105 cm−3). The gas temperatures probed by CH3OH seem to be surprisingly low, with the lowest temperature being ∼11 K in GMC 2b and not exceeding 30 K in all GMCs except 1a. In this region, we infer a gas temperature of ∼76 K, more than twice the temperature inferred from CH3OH in all other regions across NGC 253. We note that using the more recent CH3OH collisional excitation rates from Dagdigian (2023) resulted in a higher kinetic temperature, whereas the rates calculated by Rabli & Flower (2010) yielded a temperature of ∼36 K. However, both Huang et al. (2023) and Tanaka et al. (2024) also identified high (> 100 K) gas temperatures in GMC 1a using HNCO and a selection of dense gas tracers, respectively. Gorski et al. (2017) also noted the presence of an expanding shell of gas near GMC 1a, and Tanaka et al. (2024) suggest this could indicate that the gas near GMC 1a is being shocked and mechanically heated by a supernova remnant.
While CH3OH seems to largely trace cold gas, Rico-Villas et al. (2020) used vibrationally excited transitions of HC3N to derive gas kinetic temperatures of ≳100 K across all the super star clusters in the inner GMCs of NGC 253, with a gas density of nH2 ≳106 cm−3. It is possible that v = 0 CH3OH is emitted from a lower-temperature gas, especially if we are seeing a post-shocked gas whereby methanol has been released (e.g. via shocks) in the gas phase from ices; nevertheless, it is worth also exploring the possibility that methanol is sub-thermally excited. We therefore inspected the excitation conditions given the low gas temperatures probed by CH3OH. Specifically, we compared the collisional and radiative excitation rate (Goldsmith et al. 2012) based on the on-the-spot measurements of opacity, gas density, and gas temperature in each GMC. We find that overall only about half of the CH3OH transitions may be undergoing sub-thermal excitation conditions. Moreover, at the low temperature probed by CH3OH, the molecule is either expected to still be frozen on the dust (if methanol formed on the ices) or to freeze fairly quickly (if methanol was formed in the gas phase when the gas was warmer5). Alternatively, we can invoke the presence of periodic shocks, and/or desorption via cosmic rays, as a non-thermal desorption process that releases the CH3OH from the ices.
In contrast, H2CO probes gas components of lower density compared to CH3OH. In fact, the gas density traced by H2CO is surprisingly homogeneous across all GMCs (nH2 ∼ 104 cm−3). On the other hand, H2CO traces warmer gas, with Tkin ≳ 100 K across all GMCs, with the highest Tkin in GMCs 4 and 6. We also compared the collisional and radiative excitation rates based on on-the-spot measurements of opacity, gas density, and gas temperature in each GMC for H2CO. Surprisingly the majority of H2CO transitions possess sub-thermal excitation conditions. The fact that we do not see H2CO in the cold component traced by methanol implies that, if methanol is indeed sublimated by non-thermal desorption processes, solid H2CO is not abundant, making it unlikely that their formation paths are chemically connected. We therefore suggest that the H2CO we observe is mainly formed in the gas phase, via reactions of CH3 and atomic oxygen (Loomis et al. 2015; Guzmán et al. 2013). If these two species were to both form on the ices, then once non-thermally desorbed we would expect them to be co-spatial.
4.2. Comparison with existing measurements of CH3OH and H2CO towards NGC 253
Humire et al. (2022) estimated molecular column densities and excitation temperatures (Tex) of E-/A- CH3OH via an LTE analysis assuming optically thin conditions. Comparing our CH3OH column density measurements (Table 5) to those reported by Humire et al. (2022), with the exception of GMC 4, our derived column densities of E- and A- CH3OH are at least 1-2 orders of magnitude higher. This discrepancy can be explained by the fact that their LTE analysis assumed a filling factor of 1. As can be seen in Table 5, all of our best fits derive a much smaller filling factor than 1, with the exception of GMC 4 where the best fit filling factor is ∼0.7. We note that the Tex from Humire et al. (2022) is consistent with our kinetic temperature using non-LTE radiative transfer modelling. Similarly, we also compared our inference of H2CO column density as well as our inferred kinetic temperatures with those derived by Mangum et al. (2019), for which optically thin conditions were also assumed6. Our derived column densities of o- and p- H2CO are at least 1–2 orders of magnitude higher than the prediction by Mangum et al. (2019), again probably due to the fact that they assumed a beam filling factor of 1. Our derived kinetic temperatures are all greater than 80 K, consistent with the high kinetic temperature derived by Mangum et al. (2019).
4.3. Derivation of H2CO and CH3OH abundances
To derive the methanol and formaldehyde abundances, we used the H2 column densities from Mangum et al. (2019). In particular, we used the values of NH2 derived from the continuum emission at 220 GHz (see their Table 5). Since the beam of their observations is slightly smaller compared to ours (1.56′′ × 0.89′′ versus 1.6′′ × 1.6′′), we rescaled their H2 column densities to match our angular resolution. This resulted in multiplying their NH2 by a factor of 0.63. Then, as the column densities derived for H2CO and CH3OH correspond to a certain beam filling factor, we applied a beam filling factor to the scaled H2 column densities for each region, using the values of ηff from Table 5. In Mangum et al. (2019) the H2 column densities being available only for the regions GMC 3 to GMC 7, we used the NH2 values from Harada et al. (2022) for the other regions, i.e. for GMC 1a, GMC 2b, GMC 8a, and GMC 9a. For these regions, we used NH2 = (3 − 10)×1022 cm−2 (see their Figure 4c). As the observations in Harada et al. (2022) are also ALCHEMI observations, we did not rescale NH2. However, we did apply the beam filling factors from Table 6 to the H2 column densities for each region.
The ranges of abundances derived for methanol, XCH3OH, and formaldehyde, XH2CO, are listed in Tables 5 and 6 and shown in Figure 3. Since the column densities of the E- and A- forms of CH3OH are similar when taking account of the range of uncertainties, we derived XCH3OH for both forms together. We did the same for XH2CO, the p- and o- forms having the same column densities within the range of uncertainties derived. Overall, we derive XCH3OH in the range of 4.0 × 10⁻¹⁰ − 1.4 × 10⁻⁷, with the lowest abundances towards GMC 4, and the highest towards the four outermost GMCs, i.e. GMC 1a, GMC 2b, GMC 8a, and GMC 9a. For XH2CO, the range is 1.4 × 10⁻¹⁰ − 1.4 × 10⁻⁶. The range of abundances for H2CO stays relatively constant between the different regions.
5. Discussion
In this section we discuss our results within the framework of determining the physical origin of CH3OH and H2CO and whether they are chemically linked. We first examine whether these two species are tracing shocked gas (Section 5.1 and 5.2) and then attempt to trace their chemical origin and hence their link (or lack thereof) by examining their abundances (Section 5.3) and by exploiting the well measured E/A ratio of methanol to track its origin.
5.1. Comparison with the gas traced by SiO and HNCO
The existing evidence of shocks in NGC 253 includes the detection of HNCO and SiO (García-Burillo et al. 2000; Meier et al. 2015; Huang et al. 2023), the presence of Class I methanol (CH3OH) masers (Humire et al. 2022), and the elevated fractional abundances of CO2 (Harada et al. 2022). Given that HNCO and SiO (Huang et al. 2023) were also observed as part of the ALCHEMI large program, we compared the gas characteristics as traced by these two molecules with our CH3OH and H2CO results. A comparison of these species for GMC 3 is shown in Figure 4, and similar plots for all other GMCs can be found in Appendix E.
5.2. Comparison with S-bearing species
Most S-bearing species have been found to be tracing slow shocks towards the CMZ of NGC 253 (see Bouvier et al. 2024). Comparing the gas parameters traced by methanol with those traced by these S-bearing species (see Figure 4 and Appendix E), we see in general that the densities and temperatures derived from methanol are close to those derived from the sulphur-bearing species, in particular H2CS and OCS. This is somewhat consistent with the conclusion that CH3OH may trace slow shocks or post-shocked gas. This possibility is also consistent with the fact that Class I methanol masers were detected in the CMZ (Humire et al. 2022). Interestingly, from Fig. 3, we can see that the abundance behaviour of CH3OH and OCS throughout the GMCs seem to be relatively similar, with a clear decrease towards the innermost GMCs. Looking at the other S-bearing species, there is not such variation in their abundance across the GMCs, which could indicate that CH3OH and OCS are tracing similar types of shocks. H2CO, on the other hand, is clearly almost always ‘displaced’ in density and temperature from the gas traced by sulphur-bearing species, again supporting our previous conclusion that it is unlikely to trace the same gas as methanol.
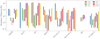 |
Fig. 3. Molecular abundances of CH3OH and H2CO, as well as for the other shock tracers. The values for CH3OH and H2CO are taken from Tables 5 and 6, respectively. The abundances for the other species are displayed in Table D.1. |
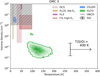 |
Fig. 4. Temperature and volume density ranges towards GMC 3 for the species studied here, as well as for other species studied using the ALCHEMI survey measurements. Ranges for HNCO and SiO are taken from Huang et al. (2023), and ranges for all sulphur-bearing species are taken from Bouvier et al. (2024). Note that T(SiO) > 400 K, so its density range is indicated by the vertical black bar. CH3OH and H2CO contours encompass the middle 66% of the temperature and density posterior distributions derived from our Bayesian inference procedure. |
5.3. Methanol and formaldehyde abundances
In this section we briefly discuss the derived abundances for methanol and formaldehyde. In particular we note that the abundance range of methanol across the GMCs is consistent with the large ranges found towards massive young stars: for example, van der Tak et al. (2000) find an abundance of ∼10−9 for the coldest sources and of up to ∼10−7 for the warmest sources. They trace the origin of the methanol to icy mantles and hence propose methanol as an evolutionary indicator. While we are unable to correlate in a similar manner our abundances to a temperature gradient, we note that there is a distinct gap in abundance between the inner (3, 4, and 6) and outer (1a, 2b, 7, 8a, 9a) GMCs, with the outer regions being richer in methanol. Moreover, abundances in GMCs 3, 4, and 6 are consistent with those found in infrared dark clouds (e.g. Gomez et al. 2011), possibly implying that the inner regions are at a younger evolutionary stage than the outer regions and in agreement with van der Tak et al. (2000) conclusions. van der Tak et al. (2000) also present H2CO abundances for the same sample of massive young star-forming regions and find that H2CO traces cooler gas than methanol, in contrast to our findings. The derived van der Tak et al. (2000) abundances are constant at 10−9, which is in fact closer to the lower limit for our outer GMCs, with the inner GMCs showing a higher abundance of this species. It is unlikely that we are tracing the same type of gas. Interestingly, they also conclude that H2CO is primarily produced in the gas phase and not correlated to methanol.
5.4. The E/A ratio in NGC 253 as a probe of methanol formation and destruction
Methanol is characterized by two spin isomers, E and A. The latter has three parallel protons in the methyl group, while in the former one of the protons has an anti-parallel spin compared to the others. Their importance lies in the fact that the conversion of one isomer to the other is highly unlikely within the lifetime of an average methanol molecule (Wirström et al. 2011). Hence the ratio of these two isomers should be fixed at the time of the formation of methanol (Kawakita & Kobayashi 2009). In thermal equilibrium (TE)7, the relative population between the E- and A- CH3OH is given by:
![Mathematical equation: $$ \begin{aligned} \mathrm{EAR} \equiv E/A = \frac{\sum _{i} {g}_{i}^\mathrm{E-type}\exp (-\frac{{E}_{i}^\mathrm{E-type}}{k_{B}T_{\rm spin}})}{\sum _{i} {g}_{i}^\mathrm{A-type}\exp (-\frac{{E}_{i}^\mathrm{A-type}}{k_{B}T_{\rm spin}})} \in [0.0,1.0]. \end{aligned} $$](/articles/aa/full_html/2025/07/aa54156-25/aa54156-25-eq61.gif) (2)
(2)
At cold temperatures (e.g. 10 − 15 K), EAR < 1.0 is expected (Friberg et al. 1988; Wirström et al. 2011). If CH3OH is formed at warmer temperatures, the EAR will reach its theoretical upper limit of 1.0. Interestingly, the measured EAR in Galactic star-forming regions is not always consistent with the theoretical predictions (e.g., Friberg et al. 1988; Wirström et al. 2011). Indeed, whilst an EAR ≤ 1 has been measured in cold dense cores [e.g.,][]Friberg1988,Bizzocchi2014,JimenezSerra2021,Megias2023, Galactic outflows (e.g., Holdship et al. 2019), and high-mass star-forming regions (e.g., Menten et al. 1988; Zhao et al. 2023), EAR > 1 has been measured in some Galactic high-mass star-forming regions (e.g., Wirström et al. 2011; Purcell et al. 2009; Kalenskii & Kurtz 2016; Hernández-Hernández et al. 2019) and proto-brown dwarfs (Riaz et al. 2023).
From Table 5 we see that, in most GMCs, the overall isomer ratios, while high, are less than unity. This suggests that, for these GMCs, methanol has formed on the ices. The kinetic temperatures of the GMCs are generally too high to allow methanol formation on the ices, and hence the observed methanol is a fossil record of a previous colder gas. However, for the inner GMCs (3, 4 and 6), the EAR is > 1. This may suggest that methanol has formed in the gas phase at higher temperatures. Qualitatively, this is also consistent with the picture that the CMZ of NGC 253 is a very dynamic region where large-scale outflows, starburst events, and high cosmic-ray ionization rates (CRIR; e.g. Holdship et al. 2022; Behrens et al. 2022, 2024) are present. On the other hand, proton exchange reactions with H3+ with HCO+ can in principle equalize the A and E methanol abundances (Wirström et al. 2011) if these ions are very abundant, which may be the case in NGC 253 due to the high CRIR (e.g. Holdship et al. 2022). In this case, methanol can still form in the ice but its EAR would not be fixed at formation.
Inferred gas properties traced by CH3OH from the Bayesian inference processes over the GMC regions investigated.
Inferred gas properties traced by H2CO from the Bayesian inference processes over the GMC regions investigated.
In extragalactic environments, there are only three other existing E-/A- ratio measurements. The EAR inferred by Muller et al. (2021) for PKS 1830-211 at z = 0.89 and the EAR estimated by Huang et al. (2024) for the nearby galaxy NGC 1068 are both fairly close to unity. Both analyses employed non-LTE radiative transfer modelling. On the other hand, the LTE analysis for NGC 253 by Humire et al. (2022) gave a wide range of EAR, varying between ∼1.1 − 5.0 (Table 3 in Humire et al. 2022) but with a caveat due to the opacity discussed in their Sect. 4.1. However, we note that in the Muller et al. (2021) and Huang et al. (2024) studies the collisional rates for methanol from Dagdigian (2023) were not employed.
6. Conclusions
We have performed a multi-transition study using methanol (CH3OH) and formaldehyde (H2CO) transitions to constrain the physical properties of the gas at GMC scales (∼ 28 pc) in the CMZ of NGC 253 using ALCHEMI data. We conclude the following:
-
CH3OH and H2CO trace distinct physical environments. Both molecular species show significant differences in kinetic temperatures and densities. CH3OH is found in high-density (≈107 cm−3) and low-temperature (Tkin < 40 K) regions, while H2CO is associated with lower-density (≈104 cm−3) but warm gas (Tkin > 100 K). The presence of sub-thermal excitation conditions in many CH3OH and H2CO transitions suggests that different non-thermal desorption mechanisms, such as periodic shocks or cosmic ray-induced desorption, may be responsible for maintaining methanol in the gas phase. This suggests that the formation processes of these two species are not directly linked within NGC 253’s starburst environment.
-
CH3OH and H2CO do not trace the same gas conditions as classical shock tracers such as silicon monoxide (SiO) and isocyanic acid (HNCO). CH3OH is found in significantly denser regions and appears to trace slow shocks or post-shock gas, rather than fast shocks. In contrast, H2CO traces a different gas component, likely associated with local heating sources rather than direct shock interactions.
-
The density and temperature conditions traced by CH3OH closely resemble those of sulphur-bearing species like H2CS and OCS, further supporting its association with slow shocks. The similar abundance trends of CH3OH and OCS across the GMCs suggest they may trace the same type of shock-driven chemistry, while other sulphur-bearing species show more uniform distributions. H2CO, however, remains distinct, reinforcing that it does not trace the same gas as CH3OH.
-
Molecular abundances of methanol suggest an evolutionary trend. The CH3OH abundance shows a radial gradient, with higher values in the outer GMCs, suggesting different chemical histories or evolutionary stages between the inner and outer CMZ regions. A distinct abundance gap is found between the inner (3, 4, and 6) and outer (1a, 2b, 7, 8a, 9a) GMCs, with the outer regions being methanol-rich. This suggests that the inner GMCs may be at a younger evolutionary stage, similar to infrared dark clouds, and aligns with the idea that CH3OH abundance may be an indicator of star-forming region evolution.
-
While previous Galactic studies have found that H2CO traces cooler gas than methanol, our findings indicate the opposite. The derived H2CO abundances in NGC 253 suggest that it is primarily formed in the gas phase, rather than through sublimation from icy mantles. This is consistent with the proposed chemical formation pathway via reactions of CH3 and atomic oxygen. The uniformity of its volume density across the GMCs further supports this interpretation.
-
The EAR of methanol provides an insight into its formation mechanisms in NGC 253. In most GMCs, EAR values remain below unity, indicating ice-grain formation at colder temperatures. However, in inner GMCs (3, 4, and 6), EAR > 1 suggests gas-phase methanol formation at higher temperatures, possibly influenced by strong outflows, starburst activity, and high cosmic-ray ionization rates. Proton exchange reactions with H3+ and HCO+ may further modify the EAR, preventing it from being solely dictated by formation conditions. Compared to other extragalactic environments, the EAR in NGC 253 displays distinct behavior, emphasizing the impact of starburst-driven processes on molecular chemistry.
7. Data availability
All of the integrated intensities for the CH3OH and H2CO transitions listed in Tables 1 and 2 towards the GMC positions listed in Table 3 are available https://doi.org/10.5281/zenodo.15442733.
As a side note, we find that Nautilus is substantially more efficient than UltraNest (Buchner 2021) (used in Holdship et al. 2022; Behrens et al. 2022; Huang et al. 2023), while providing indistinguishable results.
At nH2 ∼107 cm−3 the freeze-out time scale ∼109/nH2 ∼ 102 yrs; this can be longer if one considers non-thermal desorption (Roberts et al. 2007)
Mangum et al. (2019) assumed an excitation temperature T = 150 K and a beam filling factor of 1.
This is generally expected for reactions taking place on ice grains.
Acknowledgments
KYH, SV, and MB received funding from the European Research Council (ERC) Advanced Grant MOPPEX 833460. KYH acknowledges assistance from Allegro, the European ALMA Regional Center node in the Netherlands. This paper makes use of the following ALMA data: ADS/JAO.ALMA#2017.1.00161.L, ADS/JAO.ALMA#2018.1.00162.S. ALMA is a partnership of ESO (represent- ing its member states), NSF (USA) and NINS (Japan), together with NRC (Canada), MOST and ASIAA (Taiwan), and KASI (Republic of Korea), in co-operation with the Republic of Chile. The Joint ALMA Observatory is operated by ESO, AUI/NRAO and NAOJ. This research has made use of spectroscopic and collisional data from the EMAA database (https://emaa.osug.fr and https://dx.doi.org/10.17178/EMAA). EMAA is supported by the Observatoire des Sciences de l’Univers de Grenoble (OSUG).
References
- Álvarez-Barcia, S., Russ, P., Kästner, J., & Lamberts, T. 2018, MNRAS, 479, 2007 [Google Scholar]
- Behrens, E., Mangum, J. G., Holdship, J., et al. 2022, ApJ, 939, 119 [NASA ADS] [CrossRef] [Google Scholar]
- Behrens, E., Mangum, J. G., Viti, S., et al. 2024, ApJ, 977, 38 [Google Scholar]
- Bendo, G. J., Beswick, R. J., D’Cruze, M. J., et al. 2015, MNRAS, 450, L80 [NASA ADS] [CrossRef] [Google Scholar]
- Bizzocchi, L., Caselli, P., Spezzano, S., & Leonardo, E. 2014, A&A, 569, A27 [NASA ADS] [CrossRef] [EDP Sciences] [Google Scholar]
- Bolatto, A. D., Warren, S. R., Leroy, A. K., et al. 2013, Nature, 499, 450 [Google Scholar]
- Bouvier, M., Viti, S., Behrens, E., et al. 2024, A&A, 689, A64 [NASA ADS] [CrossRef] [EDP Sciences] [Google Scholar]
- Buchner, J. 2021, J. Open Source Softw., 6, 3001 [CrossRef] [Google Scholar]
- Butterworth, J., Viti, S., Van der Werf, P. P., et al. 2024, A&A, 686, A31 [NASA ADS] [CrossRef] [EDP Sciences] [Google Scholar]
- Dagdigian, P. J. 2023, MNRAS, 527, 2209 [Google Scholar]
- Endres, C. P., Schlemmer, S., Schilke, P., Stutzki, J., & Müller, H. S. P. 2016, J. Mol. Spectros., 327, 95 [Google Scholar]
- Friberg, P., Madden, S. C., Hjalmarson, A., & Irvine, W. M. 1988, A&A, 195, 281 [Google Scholar]
- Fuchs, G. W., Cuppen, H. M., Ioppolo, S., et al. 2009, A&A, 505, 629 [NASA ADS] [CrossRef] [EDP Sciences] [Google Scholar]
- García-Burillo, S., Martín-Pintado, J., Fuente, A., & Neri, R. 2000, A&A, 355, 499 [NASA ADS] [Google Scholar]
- Goldsmith, P. F., Langer, W. D., Pineda, J. L., & Velusamy, T. 2012, ApJS, 203, 13 [Google Scholar]
- Gorski, M., Ott, J., Rand, R., et al. 2017, ApJ, 842, 124 [CrossRef] [Google Scholar]
- Guzmán, V. V., Goicoechea, J. R., Pety, J., et al. 2013, A&A, 560, A73 [Google Scholar]
- Harada, N., Martín, S., Mangum, J. G., et al. 2021, ApJ, 923, 24 [NASA ADS] [CrossRef] [Google Scholar]
- Harada, N., Martín, S., Mangum, J. G., et al. 2022, ApJ, 938, 80 [NASA ADS] [CrossRef] [Google Scholar]
- Herbst, E., & van Dishoeck, E. F. 2009, ARA&A, 47, 427 [NASA ADS] [CrossRef] [Google Scholar]
- Hernández-Hernández, V., Kurtz, S., Kalenskii, S., et al. 2019, AJ, 158, 18 [NASA ADS] [CrossRef] [Google Scholar]
- Holdship, J., Viti, S., Codella, C., et al. 2019, ApJ, 880, 138 [NASA ADS] [CrossRef] [Google Scholar]
- Holdship, J., Viti, S., Martín, S., et al. 2021, A&A, 654, A55 [NASA ADS] [CrossRef] [EDP Sciences] [Google Scholar]
- Holdship, J., Mangum, J. G., Viti, S., et al. 2022, ApJ, 931, 89 [NASA ADS] [CrossRef] [Google Scholar]
- Huang, K.-Y., & Viti, S. 2023, FaDi, 245, 181 [Google Scholar]
- Huang, K. Y., Viti, S., Holdship, J., et al. 2023, A&A, 675, A151 [NASA ADS] [CrossRef] [EDP Sciences] [Google Scholar]
- Huang, K. Y., Abbink, D., Viti, S., & García-Burillo, S. 2024, A&A, 688, A130 [NASA ADS] [CrossRef] [EDP Sciences] [Google Scholar]
- Humire, P. K., Henkel, C., Hernández-Gómez, A., et al. 2022, A&A, 663, A33 [NASA ADS] [CrossRef] [EDP Sciences] [Google Scholar]
- Hüttemeister, S., Dahmen, G., Mauersberger, R., et al. 1998, A&A, 334, 646 [NASA ADS] [Google Scholar]
- Jiménez-Serra, I., Caselli, P., Martín-Pintado, J., & Hartquist, T. W. 2008, A&A, 482, 549 [NASA ADS] [CrossRef] [EDP Sciences] [Google Scholar]
- Jiménez-Serra, I., Vasyunin, A. I., Spezzano, S., et al. 2021, ApJ, 917, 44 [CrossRef] [Google Scholar]
- Kalenskii, S. V., & Kurtz, S. 2016, Astron. Rep., 60, 702 [NASA ADS] [CrossRef] [Google Scholar]
- Kawakita, H., & Kobayashi, H. 2009, ApJ, 693, 388 [NASA ADS] [CrossRef] [Google Scholar]
- Krieger, N., Bolatto, A. D., Walter, F., et al. 2019, ApJ, 881, 43 [NASA ADS] [CrossRef] [Google Scholar]
- Krieger, N., Bolatto, A. D., Koch, E. W., et al. 2020, ApJ, 899, 158 [Google Scholar]
- Lange, J. U. 2023, MNRAS, 525, 3181 [NASA ADS] [CrossRef] [Google Scholar]
- Lehmer, B. D., Wik, D. R., Hornschemeier, A. E., et al. 2013, ApJ, 771, 134 [NASA ADS] [CrossRef] [Google Scholar]
- Leroy, A. K., Bolatto, A. D., Ostriker, E. C., et al. 2015, ApJ, 801, 25 [NASA ADS] [CrossRef] [Google Scholar]
- Levy, R. C., Bolatto, A. D., Leroy, A. K., et al. 2022, ApJ, 935, 19 [NASA ADS] [CrossRef] [Google Scholar]
- Loomis, R. A., Cleeves, L. I., Öberg, K. I., Guzman, V. V., & Andrews, S. M. 2015, ApJ, 809, L25 [Google Scholar]
- Mangum, J. G., & Wootten, A. 1993, ApJS, 89, 123 [Google Scholar]
- Mangum, J. G., Ginsburg, A. G., Henkel, C., et al. 2019, ApJ, 871, 170 [NASA ADS] [CrossRef] [Google Scholar]
- Martín, S., Requena-Torres, M. A., Martín-Pintado, J., & Mauersberger, R. 2008, ApJ, 678, 245 [CrossRef] [Google Scholar]
- Martín, S., Mangum, J. G., Harada, N., et al. 2021, A&A, 656, A46 [NASA ADS] [CrossRef] [EDP Sciences] [Google Scholar]
- Martín-Pintado, J., de Vicente, P., Fuente, A., & Planesas, P. 1997, ApJ, 482, L45 [NASA ADS] [CrossRef] [Google Scholar]
- McCarthy, P. J., van Breugel, W., & Heckman, T. 1987, AJ, 93, 264 [NASA ADS] [CrossRef] [Google Scholar]
- McCormick, A., Veilleux, S., & Rupke, D. S. N. 2013, ApJ, 774, 126 [NASA ADS] [CrossRef] [Google Scholar]
- Megías, A., Jiménez-Serra, I., Martín-Pintado, J., et al. 2023, MNRAS, 519, 1601 [Google Scholar]
- Meier, D. S., Walter, F., Bolatto, A. D., et al. 2015, ApJ, 801, 63 [NASA ADS] [CrossRef] [Google Scholar]
- Melioli, C., & de Gouveia Dal Pino, E. M. 2004, A&A, 424, 817 [NASA ADS] [CrossRef] [EDP Sciences] [Google Scholar]
- Menten, K. M., Walmsley, C. M., Henkel, C., & Wilson, T. L. 1988, A&A, 198, 253 [NASA ADS] [Google Scholar]
- Müller, H. S. P., & Lewen, F. 2017, J. Mol. Spectros., 331, 28 [Google Scholar]
- Müller, H. S. P., Schlöder, F., Stutzki, J., & Winnewisser, G. 2005, J. Mol. Struct., 742, 215 [Google Scholar]
- Muller, S., Ubachs, W., Menten, K. M., Henkel, C., & Kanekar, N. 2021, A&A, 652, A5 [NASA ADS] [CrossRef] [EDP Sciences] [Google Scholar]
- Müller-Sánchez, F., González-Martín, O., Fernández-Ontiveros, J. A., Acosta-Pulido, J. A., & Prieto, M. A. 2010, ApJ, 716, 1166 [CrossRef] [Google Scholar]
- Pickett, H. M., Poynter, R. L., Cohen, E. A., et al. 1998, J. Quant. Spectr. Rad. Transf., 60, 883 [Google Scholar]
- Purcell, C. R., Longmore, S. N., Burton, M. G., et al. 2009, MNRAS, 394, 323 [NASA ADS] [CrossRef] [Google Scholar]
- Rabli, D., & Flower, D. R. 2010, MNRAS, 406, 95 [Google Scholar]
- Ramal-Olmedo, J. C., Menor-Salván, C. A., Fortenberry, R. C., et al. 2021, A&A, 656, A148 [NASA ADS] [CrossRef] [EDP Sciences] [Google Scholar]
- Rekola, R., Richer, M. G., McCall, M. L., et al. 2005, MNRAS, 361, 330 [NASA ADS] [CrossRef] [Google Scholar]
- Riaz, B., Thi, W. F., & Machida, M. N. 2023, MNRAS, 522, 4934 [Google Scholar]
- Rico-Villas, F., Martín-Pintado, J., González-Alfonso, E., Martín, S., & Rivilla, V. M. 2020, MNRAS, 491, 4573 [NASA ADS] [CrossRef] [Google Scholar]
- Roberts, J. F., Rawlings, J. M. C., Viti, S., & Williams, D. A. 2007, MNRAS, 382, 733 [NASA ADS] [CrossRef] [Google Scholar]
- Rodríguez-Fernández, N. J., Tafalla, M., Gueth, F., & Bachiller, R. 2010, A&A, 516, A98 [Google Scholar]
- Sakamoto, K., Mao, R.-Q., Matsushita, S., et al. 2011, ApJ, 735, 19 [CrossRef] [Google Scholar]
- Santos, J. C., Chuang, K.-J., Lamberts, T., et al. 2022, ApJ, 931, L33 [NASA ADS] [CrossRef] [Google Scholar]
- Schilke, P., Walmsley, C. M., Pineau des Forets, G., & Flower, D. R. 1997, A&A, 321, 293 [NASA ADS] [Google Scholar]
- Schöier, F. L., van der Tak, F. F. S., van Dishoeck, E. F., & Black, J. H. 2005, A&A, 432, 369 [Google Scholar]
- Simons, M. A. J., Lamberts, T., & Cuppen, H. M. 2020, A&A, 634, A52 [NASA ADS] [CrossRef] [EDP Sciences] [Google Scholar]
- Strickland, D. K., Heckman, T. M., Weaver, K. A., & Dahlem, M. 2000, AJ, 120, 2965 [NASA ADS] [CrossRef] [Google Scholar]
- Strickland, D. K., Heckman, T. M., Weaver, K. A., Hoopes, C. G., & Dahlem, M. 2002, ApJ, 568, 689 [NASA ADS] [CrossRef] [Google Scholar]
- Suutarinen, A. N., Kristensen, L. E., Mottram, J. C., Fraser, H. J., & van Dishoeck, E. F. 2014, MNRAS, 440, 1844 [Google Scholar]
- Tanaka, K., Mangum, J. G., Viti, S., et al. 2024, ApJ, 961, 18 [NASA ADS] [CrossRef] [Google Scholar]
- Turner, B. E. 1985, ApJ, 299, 312 [NASA ADS] [CrossRef] [Google Scholar]
- van der Tak, F. F. S., van Dishoeck, E. F., & Caselli, P. 2000, A&A, 361, 327 [NASA ADS] [Google Scholar]
- van der Tak, F. F. S., Black, J. H., Schöier, F. L., Jansen, D. J., & van Dishoeck, E. F. 2007, A&A, 468, 627 [NASA ADS] [CrossRef] [EDP Sciences] [Google Scholar]
- Walter, F., Bolatto, A. D., Leroy, A. K., et al. 2017, ApJ, 835, 265 [NASA ADS] [CrossRef] [Google Scholar]
- Westmoquette, M. S., Smith, L. J., & Gallagher, J. S. I. 2011, MNRAS, 414, 3719 [NASA ADS] [CrossRef] [Google Scholar]
- Wiesenfeld, L., & Faure, A. 2013, MNRAS, 432, 2573 [NASA ADS] [CrossRef] [Google Scholar]
- Wirström, E. S., Geppert, W. D., Hjalmarson, Å., et al. 2011, A&A, 533, A24 [NASA ADS] [CrossRef] [EDP Sciences] [Google Scholar]
- Woodall, J., Agúndez, M., Markwick-Kemper, A. J., & Millar, T. J. 2007, A&A, 466, 1197 [CrossRef] [EDP Sciences] [Google Scholar]
- Xu, L.-H., Fisher, J., Lees, R. M., et al. 2008, J. Mol. Spectros., 251, 305 [Google Scholar]
- Zhao, J. Y., Zhang, J. S., Wang, Y. X., et al. 2023, ApJS, 266, 29 [Google Scholar]
- Zinchenko, I., Henkel, C., & Mao, R. Q. 2000, A&A, 361, 1079 [NASA ADS] [Google Scholar]
Appendix A: CH3OH and H2CO spectra
The CH3OH and H2CO spectra sampled from GMC 6 are shown in Figures A.1 and A.2. Table A.1 lists velocity offsets for each CH3OH and H2CO transition group.
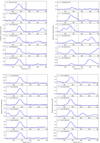 |
Fig. A.1. The GMC 6 spectra of CH3OH transitions investigated in this work. The solid gray lines represent the systemic velocity of NGC 253 (258 km s−1), and the dashed gray lines denote the velocity offsets from Table A.1 for each of the blending groups. |
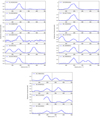 |
Fig. A.2. The GMC 6 spectra of CH3OH (upper-left panel; continued from Figure A.1) and H2CO (upper-right and lower panel) transitions investigated in this work. |
Velocity offsets for each CH3OH and H2CO transition group (Figures A.1 and A.2).
Appendix B: Moment-0 maps
The CH3OH and H2CO integrated intensity (Moment-0) images for all transitions in this study are shown in Figures B.1 and B.2, respectively.
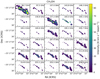 |
Fig. B.1. Moment-0 maps for all CH3OH transitions listed in Table 1 with 3σ clipping. Black circle in bottom left corner represents the ALCHEMI 1.′′6/28 pc beam. |
Appendix C: All corner plots
CH3OH and H2CO corner plots for GMC 1a, 2b, 4, and 6 (Figure C.1) and GMCs 7, 8a, and 9a. (Figure C.2).
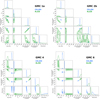 |
Fig. C.1. Posterior distribution for GMCs 1a, 2b, 4, and 6 obtained using constraints from CH3OH (blue) and H2CO (green). |
Appendix D: Abundances
We list in Table D.1 the abundances derived for HNCO, SiO, and the S-bearing species presented in Fig. 3. To calculate the abundances, we used the column densities of HNCO and SiO from Huang et al. (2023) and of the S-bearing species from Bouvier et al. (2024). We used the same H2 column densities as for CH3OH and H2CO, and we applied the beam filling factor derived for each region and each species from the non-LTE analyses performed in Huang et al. (2023, see their Table 5) and Bouvier et al. (2024, see their Tables 3 and C.1). The beam filling factor was calculated from the source’s size using the formula for the beam filling factor (Section 4).
Abundance ranges derived for HNCO, SiO, and the S-bearing species shown in Fig. 3.
Appendix E: Temperature versus density plots
Kinetic temperature versus volume density plots showing the same information as Figure 4 but for GMCs 1a, 2b, 4, 6, 7, 8a, and 9a.
All Tables
Inferred gas properties traced by CH3OH from the Bayesian inference processes over the GMC regions investigated.
Inferred gas properties traced by H2CO from the Bayesian inference processes over the GMC regions investigated.
Velocity offsets for each CH3OH and H2CO transition group (Figures A.1 and A.2).
Abundance ranges derived for HNCO, SiO, and the S-bearing species shown in Fig. 3.
All Figures
|
Fig. 1. Moment-0 maps of all the CH3OH transitions in the 96 GHz group and the H2CO 212 − 111 transition near 140 GHz showing integrated emission with S/N > 3. White circles indicate the locations of GMCs studied in Huang et al. (2023). The black circle in bottom left corner represents the 1 |
| In the text | |
|
Fig. 2. Inference results from GMC 3 with both CH3OH (blue) and H2CO (green). |
| In the text | |
|
Fig. 3. Molecular abundances of CH3OH and H2CO, as well as for the other shock tracers. The values for CH3OH and H2CO are taken from Tables 5 and 6, respectively. The abundances for the other species are displayed in Table D.1. |
| In the text | |
|
Fig. 4. Temperature and volume density ranges towards GMC 3 for the species studied here, as well as for other species studied using the ALCHEMI survey measurements. Ranges for HNCO and SiO are taken from Huang et al. (2023), and ranges for all sulphur-bearing species are taken from Bouvier et al. (2024). Note that T(SiO) > 400 K, so its density range is indicated by the vertical black bar. CH3OH and H2CO contours encompass the middle 66% of the temperature and density posterior distributions derived from our Bayesian inference procedure. |
| In the text | |
|
Fig. A.1. The GMC 6 spectra of CH3OH transitions investigated in this work. The solid gray lines represent the systemic velocity of NGC 253 (258 km s−1), and the dashed gray lines denote the velocity offsets from Table A.1 for each of the blending groups. |
| In the text | |
|
Fig. A.2. The GMC 6 spectra of CH3OH (upper-left panel; continued from Figure A.1) and H2CO (upper-right and lower panel) transitions investigated in this work. |
| In the text | |
|
Fig. B.1. Moment-0 maps for all CH3OH transitions listed in Table 1 with 3σ clipping. Black circle in bottom left corner represents the ALCHEMI 1.′′6/28 pc beam. |
| In the text | |
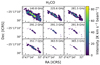 |
Fig. B.2. Same as in Figure B.1 but for H2CO with transitions listed in Table 2. |
| In the text | |
|
Fig. C.1. Posterior distribution for GMCs 1a, 2b, 4, and 6 obtained using constraints from CH3OH (blue) and H2CO (green). |
| In the text | |
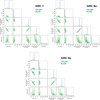 |
Fig. C.2. Same as in Figure C.1 but for GMCs 7, 8a, and 9a. |
| In the text | |
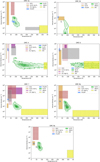 |
Fig. E.1. Same as in Figure 4 but for GMCs 1a, 2b, 4, 6, 7, 8a, and 9a. |
| In the text | |
Current usage metrics show cumulative count of Article Views (full-text article views including HTML views, PDF and ePub downloads, according to the available data) and Abstracts Views on Vision4Press platform.
Data correspond to usage on the plateform after 2015. The current usage metrics is available 48-96 hours after online publication and is updated daily on week days.
Initial download of the metrics may take a while.