Open Access
Fig. A.1.
Download original image
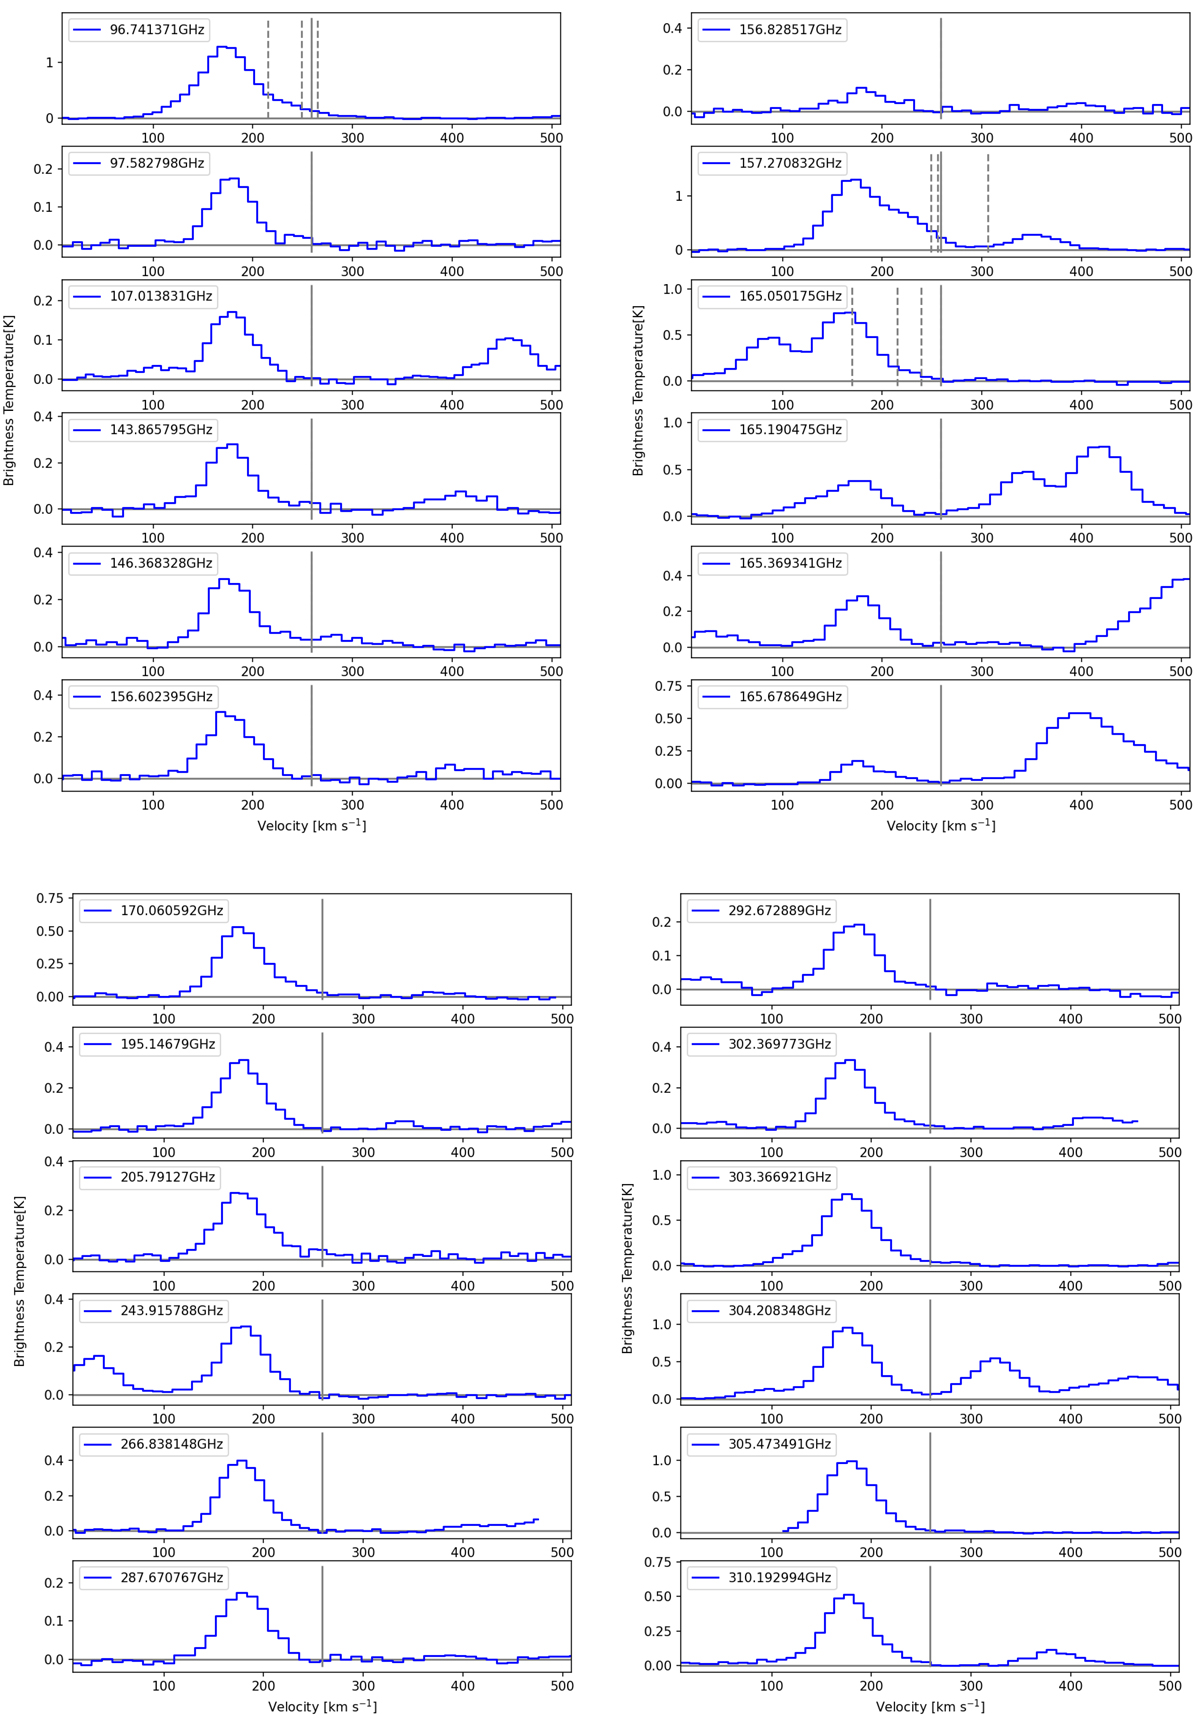
The GMC 6 spectra of CH3OH transitions investigated in this work. The solid gray lines represent the systemic velocity of NGC 253 (258 km s−1), and the dashed gray lines denote the velocity offsets from Table A.1 for each of the blending groups.
Current usage metrics show cumulative count of Article Views (full-text article views including HTML views, PDF and ePub downloads, according to the available data) and Abstracts Views on Vision4Press platform.
Data correspond to usage on the plateform after 2015. The current usage metrics is available 48-96 hours after online publication and is updated daily on week days.
Initial download of the metrics may take a while.