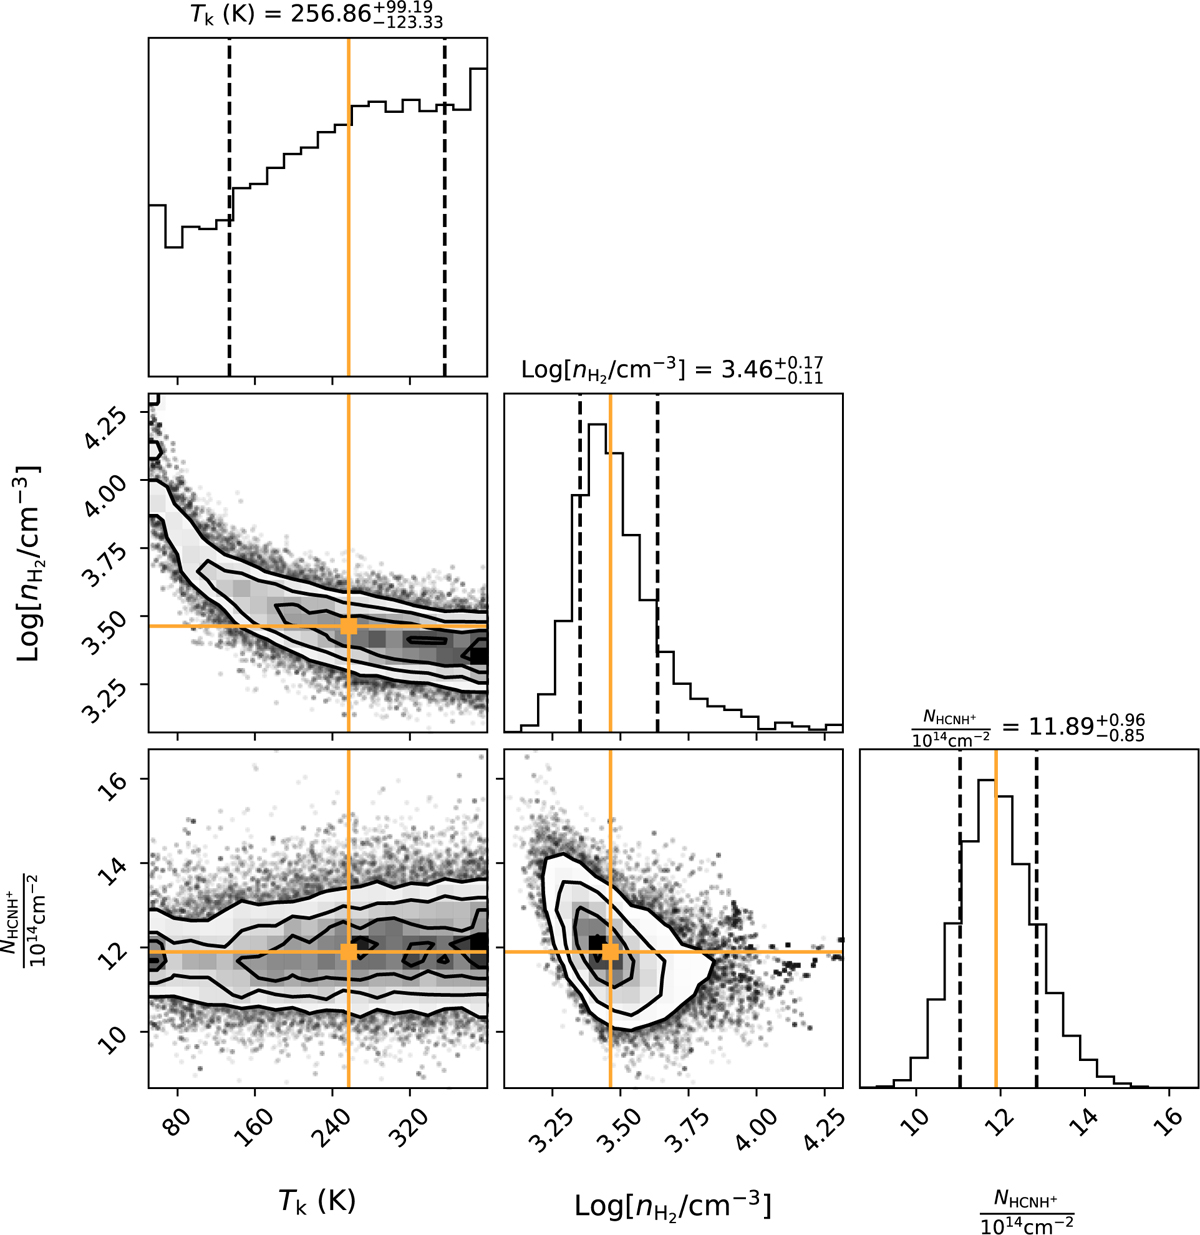
Fig. C.1
Download original image
Posterior probability distributions of gas temperatures, H2 number densities, and HCNH+ column densities for GMC6, with the maximum posterior possibility point in the parameter space highlighted by orange lines and points. Contours represent the 0.5, 1.0, 1.5, and 2.0σ confidence intervals. The vertical dashed lines represent the 1σ spread.
Current usage metrics show cumulative count of Article Views (full-text article views including HTML views, PDF and ePub downloads, according to the available data) and Abstracts Views on Vision4Press platform.
Data correspond to usage on the plateform after 2015. The current usage metrics is available 48-96 hours after online publication and is updated daily on week days.
Initial download of the metrics may take a while.