Fig. 3
Download original image
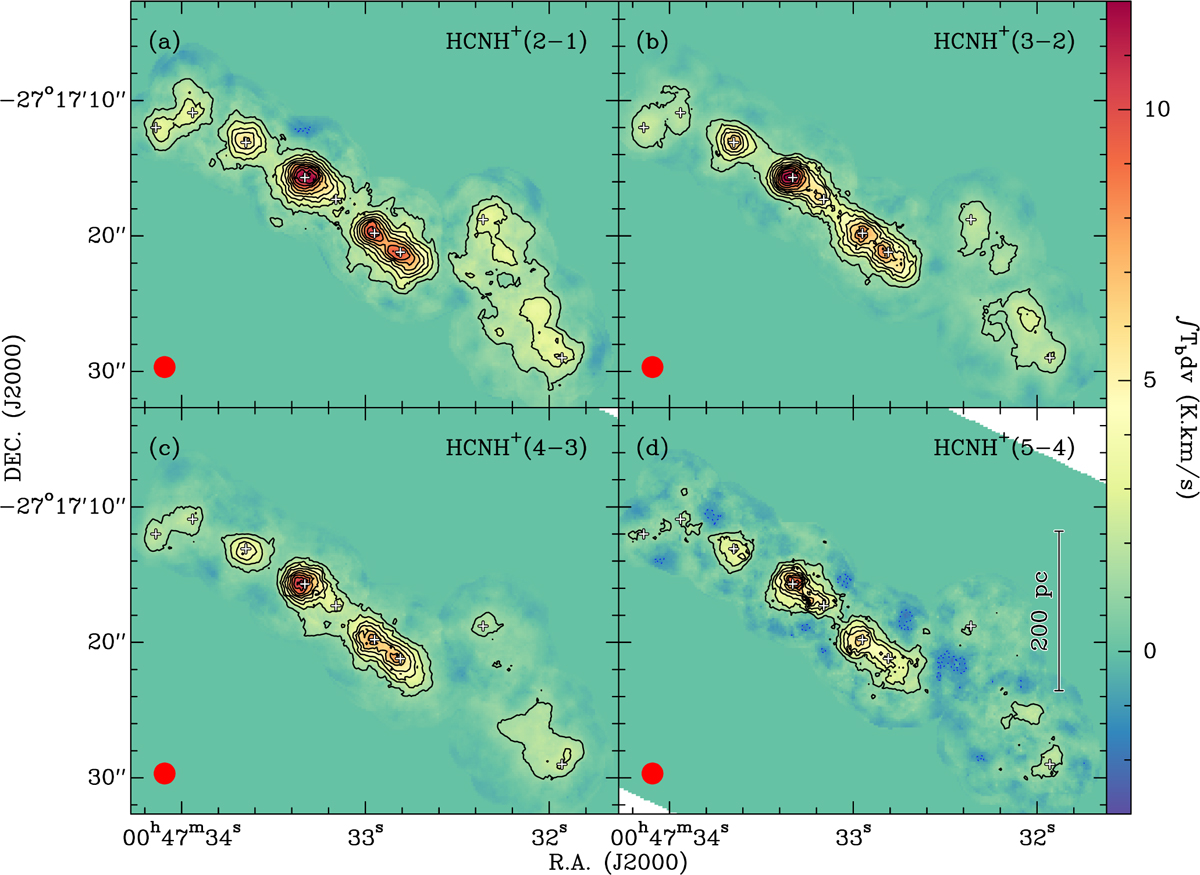
Distributions of HCNH+ (2−1) (a), HCNH+ (3−2) (b), HCNH+ (4−3) (c), and HCNH+ (5−4) (d) emission in the CMZ of NGC 253. All intensity maps are integrated from 100 to 400 km s−1 and share a common integrated-intensity scale indicated by the color bar. In each panel, the overlaid contours represent the integrated intensities of respective HCNH+ transitions, starting at 1.2 K km s−1 and increasing by 1.2 K km s−1. The positions of the nine GMCs are marked with plus symbols. In each panel, the beam is shown in the lower-left corner.
Current usage metrics show cumulative count of Article Views (full-text article views including HTML views, PDF and ePub downloads, according to the available data) and Abstracts Views on Vision4Press platform.
Data correspond to usage on the plateform after 2015. The current usage metrics is available 48-96 hours after online publication and is updated daily on week days.
Initial download of the metrics may take a while.