Fig. 2
Download original image
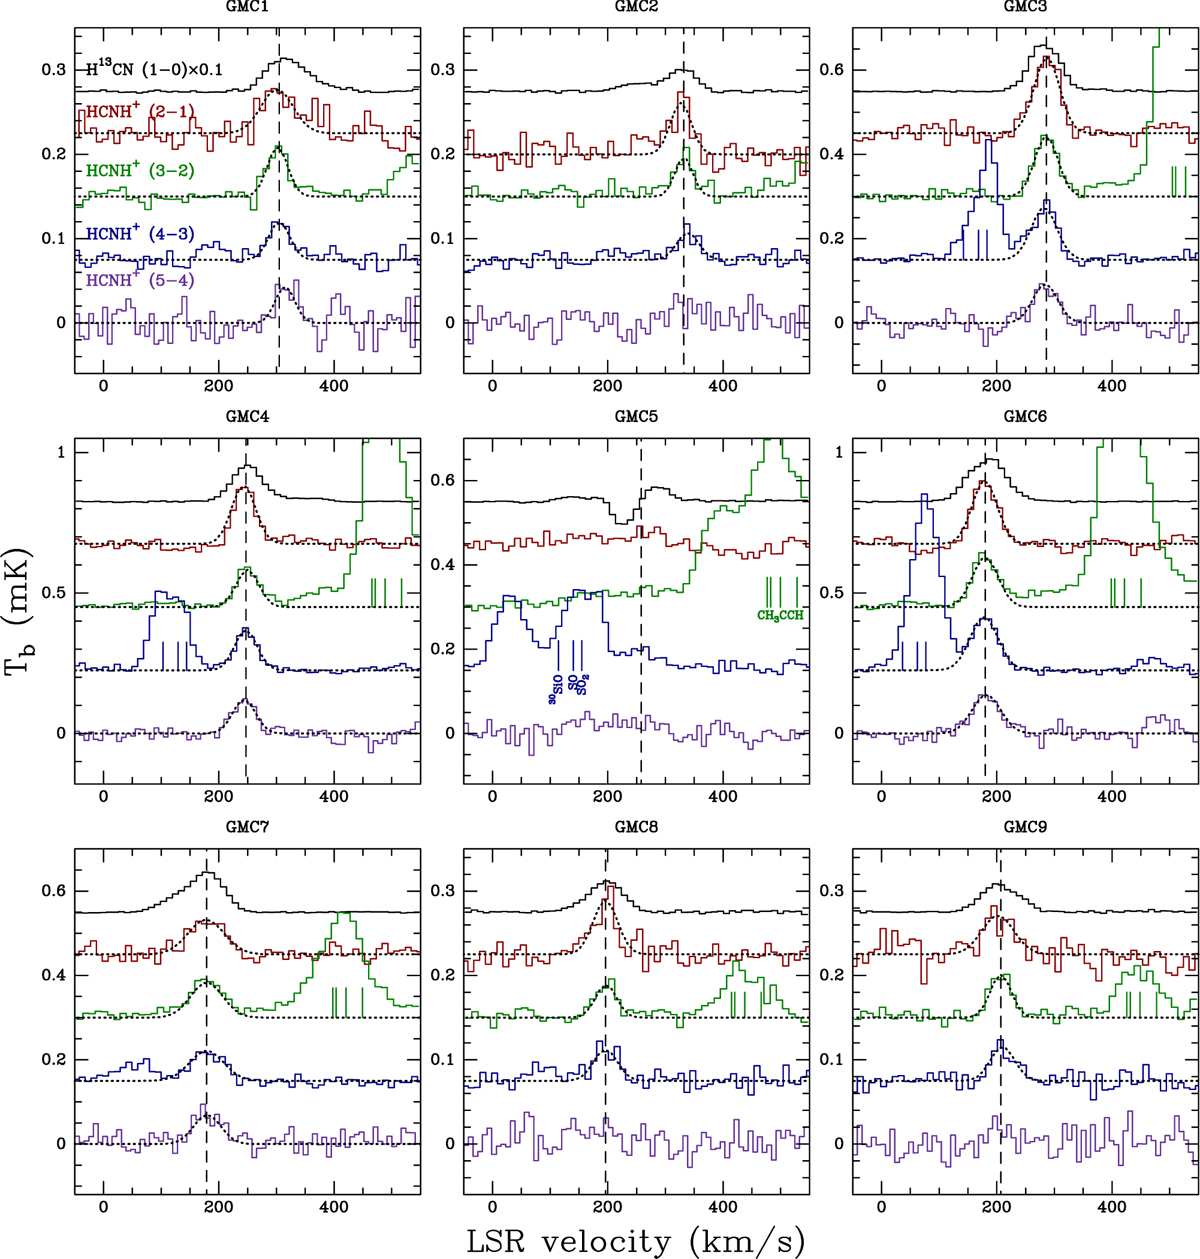
Observed H13CN and HCNH+ spectra (all with a common circular beam of 1.″6) of the nine GMCs indicated in Fig. 1 and Table 1. H13CN (1−0), HCNH+ (2−1), HCNH+ (3−2), HCNH+ (4−3), and HCNH+ (5−4) are indicated by black, red, green, blue, and purple lines, respectively. The fits to the HCNH+ spectra are indicated by black dotted lines. H13CN (1−0) spectra are scaled by a factor of 0.1 for better visualization. In each panel, the systemic LSR velocity is indicated by the vertical black dashed line. The potentially blended lines are marked by short vertical lines in the corresponding panels, with the associated species labeled in the central panel for GMC5.
Current usage metrics show cumulative count of Article Views (full-text article views including HTML views, PDF and ePub downloads, according to the available data) and Abstracts Views on Vision4Press platform.
Data correspond to usage on the plateform after 2015. The current usage metrics is available 48-96 hours after online publication and is updated daily on week days.
Initial download of the metrics may take a while.