Fig. 10
Download original image
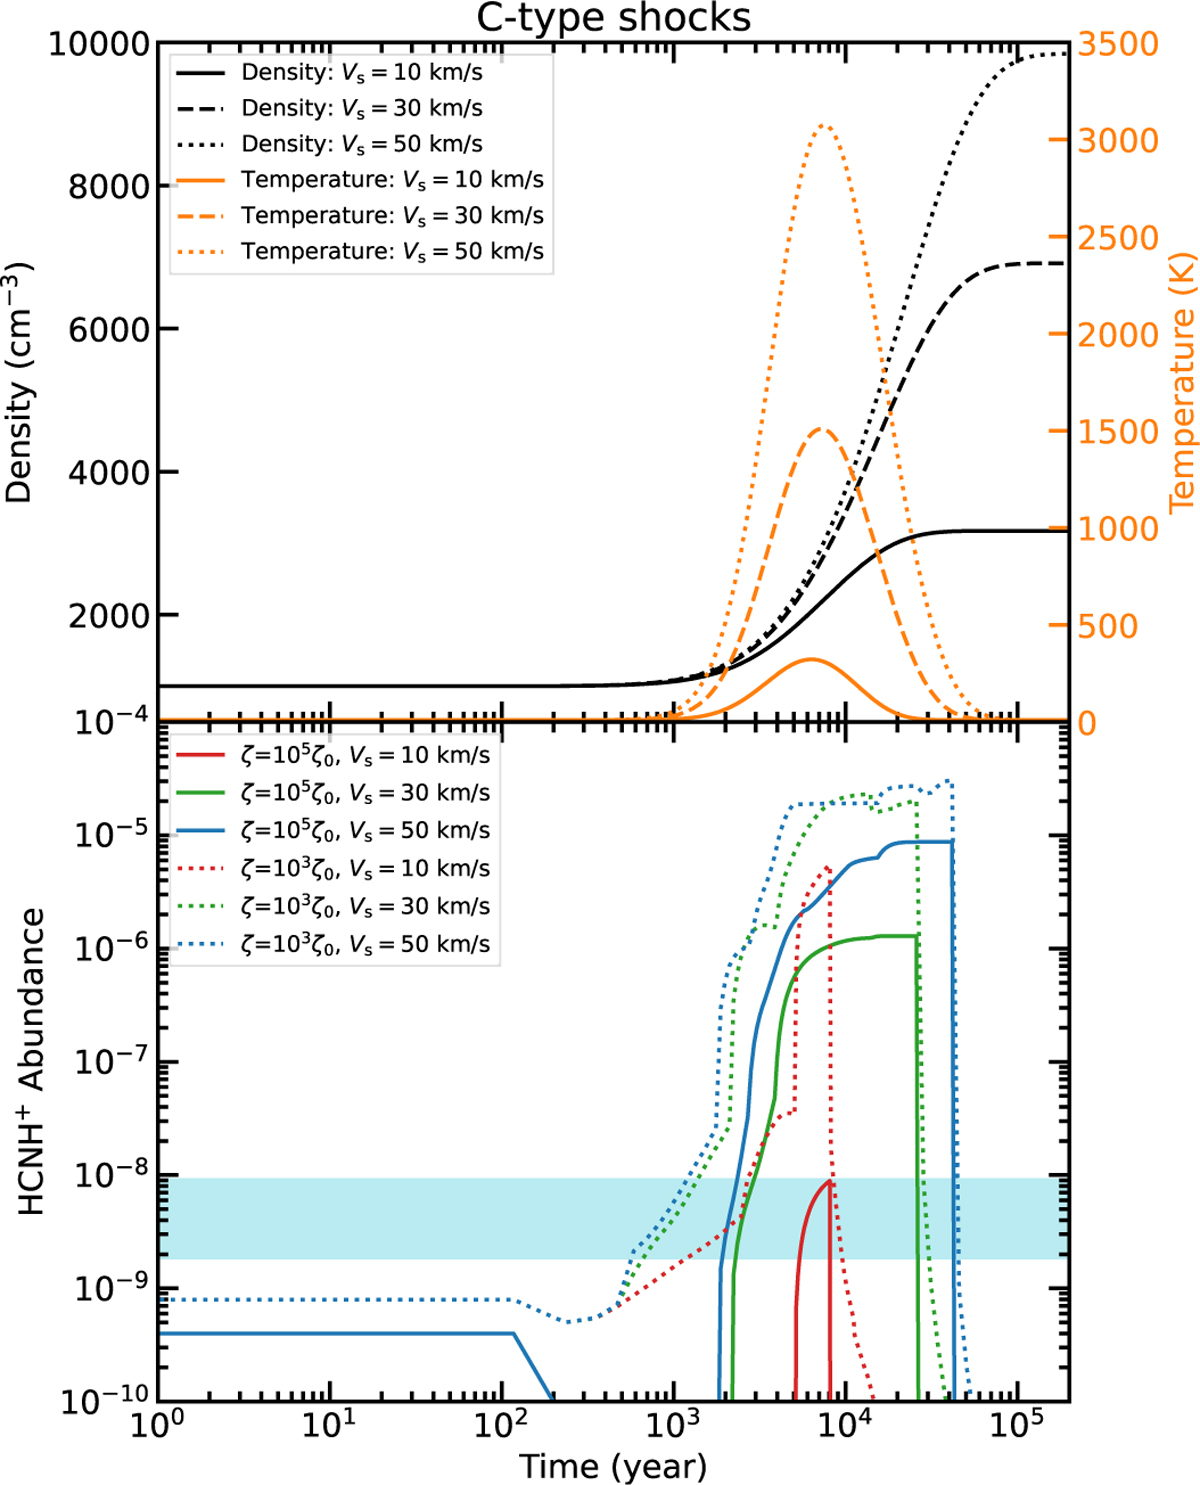
Physical structures and the evolution of HCNH+ abundances in C-type shocks, calculated from the UCLCHEM models (Holdship et al. 2017). Top: C-shock physical structures of our models for the three different shock velocities. The black and orange lines represent the density and temperature profiles of shock models. Bottom: HCNH+ abundances as a function of time for C-type shocks. The preshock gas density is fixed to 103 cm−3 in the models. Different lines correspond to different cosmic ray ionization rates and shock velocities which are shown in the legend. The cyan-shaded region indicates the observed HCNH+ abundances in this study. GIF animations of the shock models at a given ζ = 103ζ0 and ζ = 105ζ0 are available via link1 and link2, respectively.
Current usage metrics show cumulative count of Article Views (full-text article views including HTML views, PDF and ePub downloads, according to the available data) and Abstracts Views on Vision4Press platform.
Data correspond to usage on the plateform after 2015. The current usage metrics is available 48-96 hours after online publication and is updated daily on week days.
Initial download of the metrics may take a while.