Fig. 8
Download original image
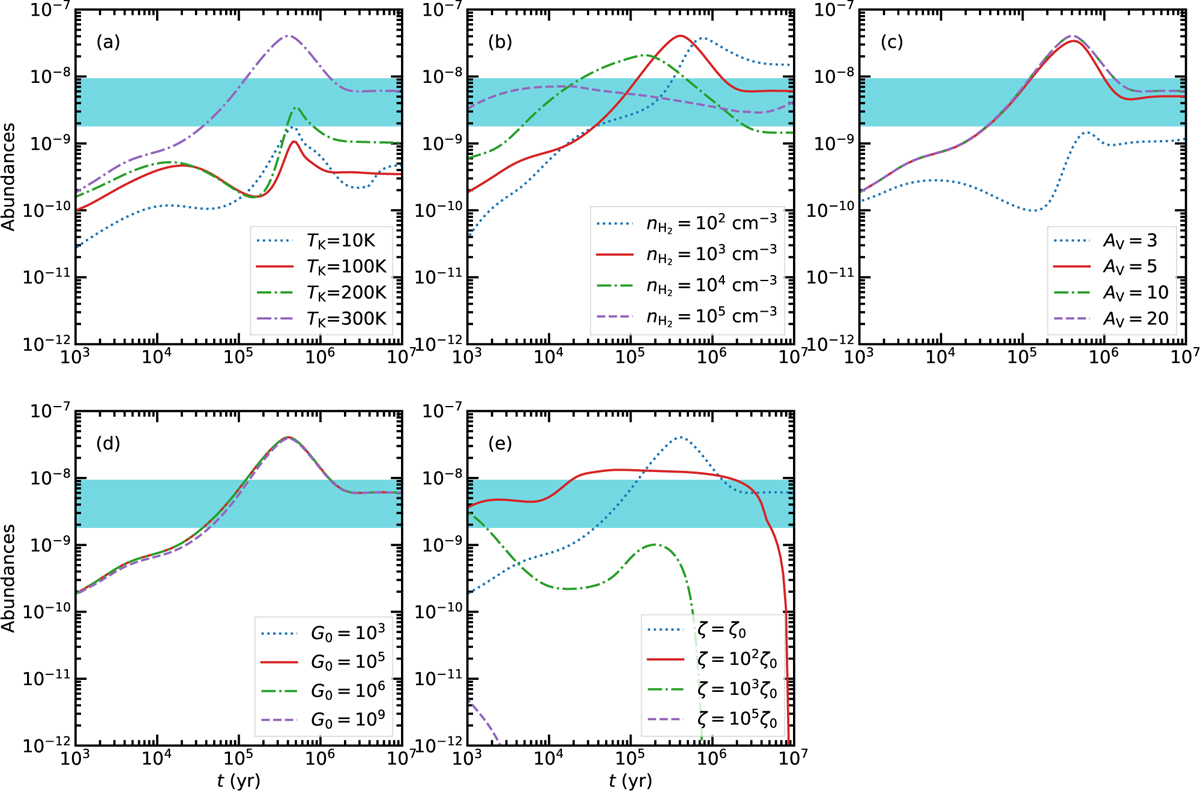
Environmental influence on HCNH+ abundances relative to H2 as a function of time, calculated from the static models of Chempl (Du 2021). (a) Modeling results for different gas temperatures with ![]() , Av =10, G0=1, and ζ = ζ0. (b) Modeling results for different H2 number densities with TK = 300 K, Av =10, G0 =1, and ζ = ζ0. (c) Modeling results for different visual extinctions with TK = 300 K,
, Av =10, G0=1, and ζ = ζ0. (b) Modeling results for different H2 number densities with TK = 300 K, Av =10, G0 =1, and ζ = ζ0. (c) Modeling results for different visual extinctions with TK = 300 K, ![]() , G0=1, and ζ = ζ0. (d) Modeling results for different interstellar radiation fields with TK = 300 K,
, G0=1, and ζ = ζ0. (d) Modeling results for different interstellar radiation fields with TK = 300 K, ![]() , Av =20, and ζ = ζ0. (e) Modeling results for different cosmic ray ionization rates with TK = 300 K,
, Av =20, and ζ = ζ0. (e) Modeling results for different cosmic ray ionization rates with TK = 300 K, ![]() , Av =20, and G0 = 105. In all panels, the cyan-shaded regions indicate the observed HCNH+ abundances derived from our non-LTE analysis (see Table 2).
, Av =20, and G0 = 105. In all panels, the cyan-shaded regions indicate the observed HCNH+ abundances derived from our non-LTE analysis (see Table 2).
Current usage metrics show cumulative count of Article Views (full-text article views including HTML views, PDF and ePub downloads, according to the available data) and Abstracts Views on Vision4Press platform.
Data correspond to usage on the plateform after 2015. The current usage metrics is available 48-96 hours after online publication and is updated daily on week days.
Initial download of the metrics may take a while.