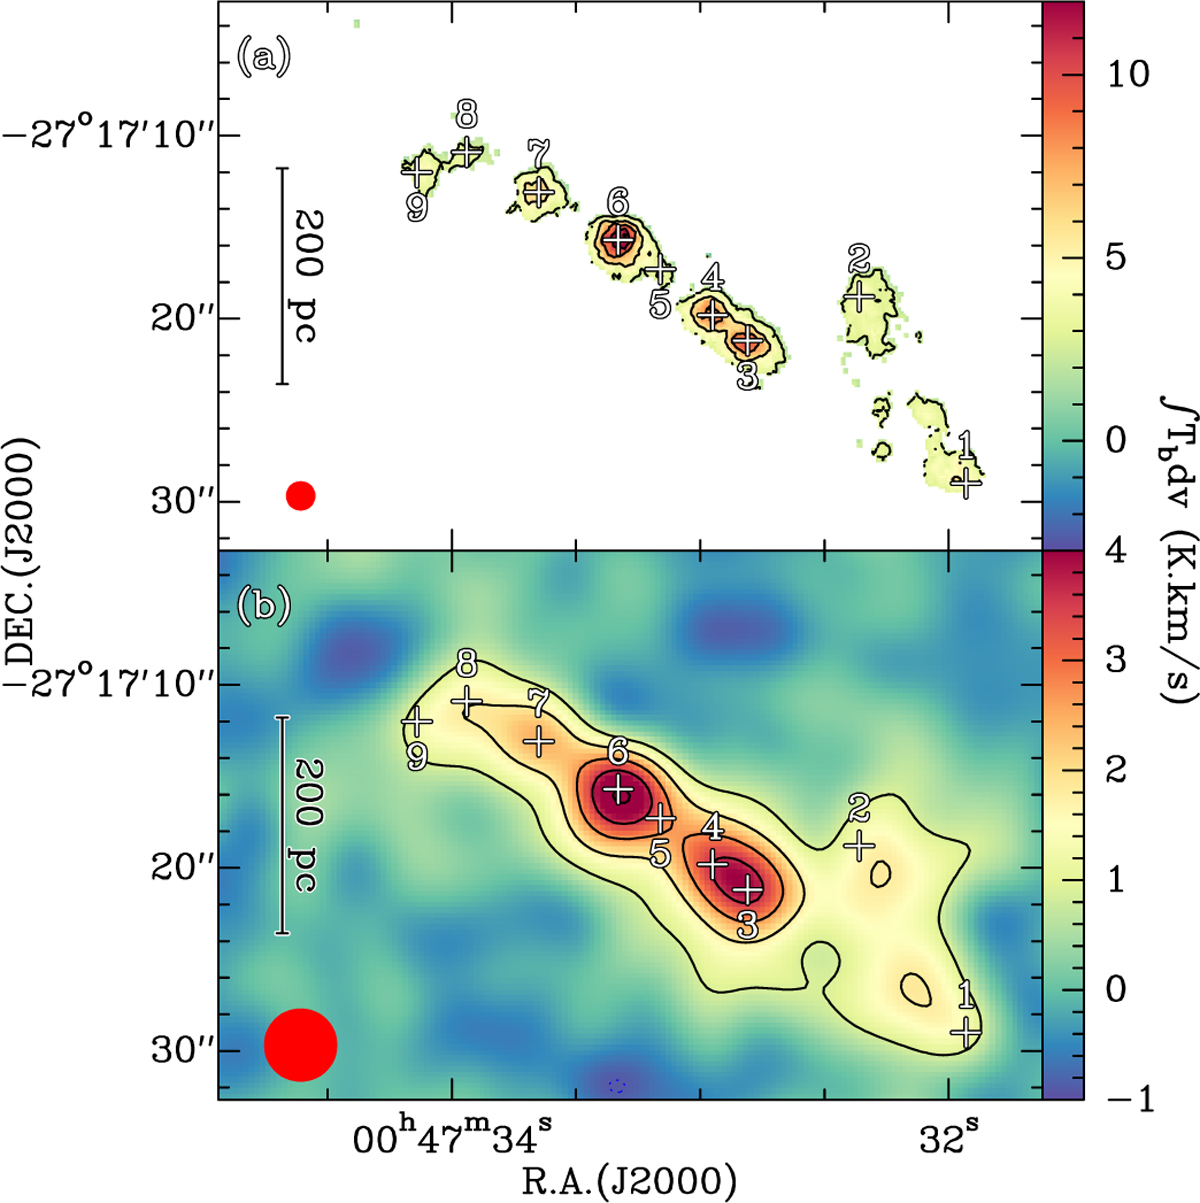
Fig. 1
Download original image
Distribution of HCNH+ (2−1) in the CMZ of NGC 253. (a) HCNH+ (2−1) integrated intensity map (taken from Harada et al. 2024), clipped at the 3σ level. The contours start from 2.7 K km s−1 (3σ) and increase by 2.7 K km s−1. (b) HCNH+ (21) integrated intensity map that has been convolved to a circular beam of 4″ . The smoothed image manifests the large-scale structures traced by HCNH+ transitions. The contours start from 0.9 K km s−1 (3σ) and increase by 0.9 K km s−1. In each panel, the beam is shown in the lower-left corner, and the pluses indicate the positions of the nine most prominent GMCs.
Current usage metrics show cumulative count of Article Views (full-text article views including HTML views, PDF and ePub downloads, according to the available data) and Abstracts Views on Vision4Press platform.
Data correspond to usage on the plateform after 2015. The current usage metrics is available 48-96 hours after online publication and is updated daily on week days.
Initial download of the metrics may take a while.