Fig. 5
Download original image
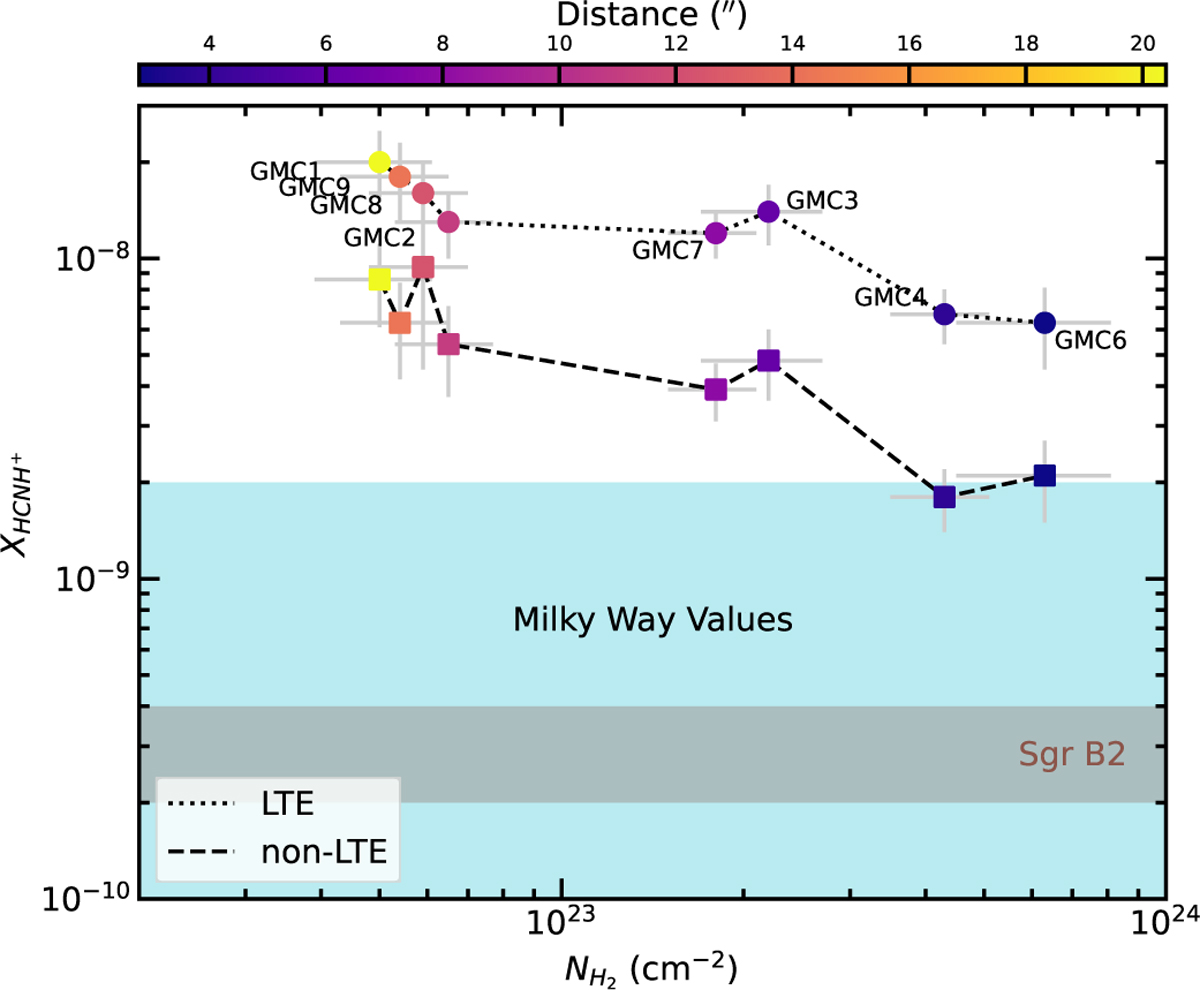
HCNH+ abundances as a function of H2 column density. The colors represent the distances of GMCs to GMC5 which is located at the center of the CMZ of NGC 253. The circles represent HCNH+ abundances derived using the LTE approach (see Sect. 3), while the squares represent those obtained from the non-LTE approach (see Sect. 3.3.2). The cyan-shaded region indicates the observed HCNH+ abundances of ≲2 × 10⁻⁹ previously reported in the Milky Way, while the brown- shaded region marks the abundances reported toward Sgr B2.
Current usage metrics show cumulative count of Article Views (full-text article views including HTML views, PDF and ePub downloads, according to the available data) and Abstracts Views on Vision4Press platform.
Data correspond to usage on the plateform after 2015. The current usage metrics is available 48-96 hours after online publication and is updated daily on week days.
Initial download of the metrics may take a while.