| Issue |
A&A
Volume 696, April 2025
|
|
|---|---|---|
| Article Number | A162 | |
| Number of page(s) | 32 | |
| Section | Planets, planetary systems, and small bodies | |
| DOI | https://doi.org/10.1051/0004-6361/202452689 | |
| Published online | 18 April 2025 | |
Planetesimal formation via the streaming instability in simulations of infall-dominated young disks
1
Institut für Theoretische Astrophysik, Zentrum für Astronomie der Universität Heidelberg,
Albert-Ueberle-Str. 2,
69120
Heidelberg,
Germany
2
Université Paris-Saclay, Université Paris-Cité, CEA, CNRS, AIM,
91191
Gif-sur-Yvette,
France
3
Interdisziplinäres Zentrum für Wissenschaftliches Rechnen, Universität Heidelberg,
Im Neuenheimer Feld 205,
69120
Heidelberg,
Germany
4
Dipartimento di Fisica, Università degli Studi di Milano,
Via Celoria, 16,
20133
Milano,
Italy
5
INAF – Istituto di Astrofisica e Planetologia Spaziali (INAF-IAPS),
Via Fosso del Cavaliere 100,
00133
Roma,
Italy
6
Dipartimento di Fisica e Astronomia “Augusto Righi”, ALMA Mater Studiorum – Universitị Bologna,
via Gobetti 93/2,
40190
Bologna,
Italy
7
Harvard-Smithsonian Center for Astrophysics,
60 Garden Street,
Cambridge,
MA
02138,
U.S.A.
8
Elizabeth S. and Richard M. Cashin Fellow at the Radcliffe Institute for Advanced Studies at Harvard University,
10 Garden Street,
Cambridge,
MA
02138,
U.S.A.
9
Institute of Space Sciences (ICE), CSIC, Campus UAB, Carrer de Can Magrans s/n,
08193
Barcelona,
Spain
10
ICREA,
Pg. Lluís Companys 23,
Barcelona,
Spain
★ Corresponding author; huehn@uni-heidelberg.de
Received:
21
October
2024
Accepted:
17
March
2025
Protoplanetary disks naturally emerge during protostellar core collapse. In their early evolutionary stages, infalling material dominates their dynamical evolution. In the context of planet formation, this means that the conditions in young disks are different from the ones in the disks typically considered in which infall has subsided. High inward velocities are caused by the advection of accreted material that is deficient in angular momentum, rather than being set by viscous spreading, and accretion gives rise to strong velocity fluctuations. Therefore, we aim to investigate when it is possible for the first planetesimals to form and for subsequent planet formation to commence. We analyzed the disks obtained in numerical 3D nonideal magnetohydrodynamical simulations, which served as a basis for 1D models representing the conditions during the class 0/I evolutionary stages. We integrated the 1D models with an adapted version of the TwoPopPy code to investigate the formation of the first planetesimals via the streaming instability. In disks with temperatures such that the snow line is located at ~10 AU and in which it is assumed that velocity fluctuations felt by the dust are reduced by a factor of 10 compared to the gas, ~10−3 M⊙ of planetesimals may be formed already during the first 100 kyr after disk formation, implying the possible early formation of giant planet cores. The cold-finger effect at the snow line is the dominant driver of planetesimal formation, which occurs in episodes and utilizes solids supplied directly from the envelope, leaving the reservoir of disk solids intact. However, if the cold-finger effect is suppressed, early planetesimal formation is limited to cold disks with an efficient dust settling whose dust-to-gas ratio is initially enriched to ε0 ≥ 0.03.
Key words: magnetohydrodynamics (MHD) / turbulence / methods: numerical / planets and satellites: formation / protoplanetary disks / ISM: clouds
© The Authors 2025
 Open Access article, published by EDP Sciences, under the terms of the Creative Commons Attribution License (https://creativecommons.org/licenses/by/4.0), which permits unrestricted use, distribution, and reproduction in any medium, provided the original work is properly cited.
This article is published in open access under the Subscribe to Open model. Subscribe to A&A to support open access publication.
1 Introduction
Forming planets from dust grains present in protoplanetary disks surrounding young stars remains an uncertain process, whereby grains have to grow over many orders of magnitude and accumulate to eventually form planetary cores (for a review, see Drążkowska et al. 2023). It is currently believed that a complex string of processes needs to occur in order to result in the formation of a planetary system akin to the ones observed. Protoplanetary disks need to maintain a sufficient solid mass for the formation of these planets and are required to meet specific conditions that are believed to be favorable for these processes. Fundamental aspects of the dynamics of protoplanetary disks remain subject to debate (for a review, see Lesur et al. 2023), and progress in understanding one aspect of planet formation is usually made while assuming a reasonable understanding of the others. Such approaches are reasonable given the vast range of spatial and time scales involved. However, they have the down-side of losing self-consistency regarding the initial conditions of protoplanetary disks, such as the total available solid mass or the elapsed time since the initial formation of the star and disk system from the parent molecular cloud.
Observations have revealed the presence of circumstellar disks all along the star formation sequence, from young, deeply embedded protostars (class 0 systems, Maury et al. 2019; Sheehan et al. 2022) to pre-main-sequence stars a few million years old (class II young stellar objects (YSOs), Andrews et al. 2018). Observations reveal a large diversity in the properties of these disks, from being very compact and potentially massive around the youngest protostars (for a review, see Tsukamoto et al. 2023) to being less gas-rich and very structured when they are revealed around T Tauri stars (for a review, see Miotello et al. 2023). Interestingly, recent observations of protoplanetary disks have challenged the existing model of planet formation. A large fraction of class II disks may have difficulties forming planetary systems similar to the ones observed, as their solid budget available for planet formation may be too low (Manara et al. 2018) to form, for example, the giant planets present around 10–20% of stars (Cumming et al. 2008; Mayor et al. 2011). Even under the optimistic assumption of a high degree of efficiency when converting available solids to giant planet cores, only ~16% of observed class II disks have a dust disk mass of ≳10 M⊕ (van der Marel & Mulders 2021), commonly cited to be the minimal core mass of giant planets in the core accretion scenario. Additionally, observations of dust masses in 1–2 Myr-old disks around brown dwarfs reveal through direct measurements that they contain only small amounts of dust, with Mdust ⪅ 1 M⊕ (Testi et al. 2016; Sanchis et al. 2020). This is considerably lower than the total mass of the planetary systems found around Trappist-1 (7–10 M⊕) and Proxima Centauri (> 1–2 M⊕), further suggesting that insufficient amounts of dust are available to form known planetary systems.
Furthermore, substructures are abundant phenomena in class II disks, as large observational programs obtaining images with the Atacama Large Millimeter/submillimeter Array (ALMA) such as “DSHARP” (Andrews et al. 2018) have shown. They are believed to be related to planet formation, either by serving as their birthplace (e.g., Testi et al. 2014) or by being caused by the presence of a planet in the disk (see, e.g., Teague et al. 2018; Bae et al. 2023). In any case, the formation of these substructures would take time, but they are observed even in young disks like HL Tau (ALMA Partnership 2015), which is a class I/II disk. In addition, the dust trapped in these substructures could be secondary dust produced from fragmenting collisions of planetesimals stirred up by a planet (Turrini et al. 2019; Testi et al. 2022), which would require giant planets to be present in young disks already, in turn requiring an early onset of planet formation. Convincing indications of annular structures have only been reported toward a couple of class I disks (Segura-Cox et al. 2020; Flores et al. 2023); however, it may be that substructures are common in young protostellar disks but obscured by the high optical depth of the dust emission. Altogether, these observations question the current planet formation paradigm, whose starting point is a ~2 Myr-old fully formed disk with negligible amounts of mass being accreted from the molecular cloud.
It is therefore imperative to put more emphasis on investigating the conditions reigning during the earlier evolutionary stages of protoplanetary disks, and the implications for planet formation. Indeed, during the protostellar class 0 phase, the mass budget for forming planetary bodies is naturally more favorable as a large amount of material, up to a few times the final stellar mass, is available in the dense envelope surrounding the protostellar embryo and its disk (Lada 1987; Andre et al. 2000). Solid masses of young disks obtained from observations (Tychoniec et al. 2020; Sheehan et al. 2022) are generally uncertain (Tung et al. 2024), but observations of protostellar cores show signatures of vigorous mass transfer, of up to ~10−5 M⊙ yr−1 (Evans et al. 2015), from the surrounding envelope down to disk scales. Sometimes observed to be episodic (Bjerkeli et al. 2023), these infall and accretion events may allow the disk scales to be replenished efficiently with both gas and dust, coming either from the inner envelope (Sai et al. 2022), or from the mass reservoir at larger scales (Pineda et al. 2023; Cacciapuoti et al. 2024). Despite its short duration (<0.1 Myr, Maury et al. 2011; Kristensen & Dunham 2018), the class 0 phase could thus be key in evolving the solid particles and starting the assemblage of the building blocks of planetary cores during the early protoplanetary disk formation stages.
In the most promising current picture of planet formation, the first stage is the formation of kilometer-sized objects, so-called planetesimals. An often employed idea is that the so-called streaming instability facilitates the formation of planetesimals through the direct gravitational collapse of accumulations of dust grains (Youdin & Goodman 2005, see also reviews by Johansen et al. 2014; Lesur et al. 2023). In previous works, planetesimal formation during the infall stage was investigated by considering the drift of large dust grains about 10 μm in size in the envelope of young, embedded disks (Bate & Lorén-Aguilar 2017; Lebreuilly et al. 2020). While theoretical details of grain growth in the envelope and the achievable maximum grain size are highly debated (Ormel et al. 2009; Guillet et al. 2020; Silsbee et al. 2022; Bate 2022; Lebreuilly et al. 2023), observational evidence indicates the presence of large grains around young, embedded disks at a distance of 500 AU (Galametz et al. 2019; Valdivia et al. 2019; Cacciapuoti et al. 2023). Cridland et al. (2022) find that, in some cases, the drift of large grains in the envelope can increase the dust-to-gas ratio of infalling material to the point where conditions for planetesimal formation are met without the need for any processes accumulating dust within the disk. While it remains unclear how efficiently dust can grow in the envelope, disks with a dust-to-gas ratio that is initially higher than 1% could form in this scenario, exceeding what is found in the solar neighborhood. In this work, however, we put the focus on disk processes facilitating the onset of the streaming instability inside the disk.
Theoretical studies have been undertaken in the past about the possibility of planetesimal formation in the disk buildup stage via disk processes. Vorobyov et al. (2024) found using 3D hydrodynamics that dust density enhancements can already occur in the midplane in the first 20 kyr after disk formation, neglecting the magnetic field. Drążkowska & Dullemond (2018) have modeled the buildup and evolution of protoplanetary disks all the way to the end of class II in a 1D viscous evolution scenario, employing an analytical prescription of the infalling material (Hueso & Guillot 2005; Shu 1977; Ulrich 1976). However, their setup was strongly simplified, neglecting the magnetic field. It would have a significant impact on the properties of a young disk, because the infall profile and disk size is expected to be different in a magnetized scenario. They also did not consider the impact infall has on the dynamics of early disks, which is substantially different from class II disk dynamics. Improvements have been made by Morbidelli et al. (2022) and Marschall & Morbidelli (2023) by employing more realistic infall and dynamical prescriptions based on results from Lee et al. (2021), while remaining focused on the Solar System and sticking to semi-analytical descriptions.
Given these simplifying assumptions about the conditions present in early disks made in the past, we have investigated the possibility of an early onset of planet formation under more realistic conditions. We based our model on 3D nonideal magnetohydrodynamical (MHD) models of core collapse from Hennebelle et al. (2020b, H20) in which disks emerge naturally as the central star forms. An example of such a disk can be seen in Fig. 1, which shows one snapshot of the core collapse simulations that will be used as the main reference in this work. We used these simulations to directly compute parameter profiles for use in a 1D disk evolution framework, describing the infall and resulting time evolution of the gas disk, which we combined with a two-population approximate dust evolution (Birnstiel et al. 2012) to model the accumulation of solids to the point where the streaming instability could potentially facilitate the formation of planetesimals.
In Sect. 2, we describe how we used the quantities from the H20 core collapse simulations as a basis for a 1D disk evolution model. After that, we discuss key aspects and resulting model quantities of one simulation from H20 in Sect. 3, which serves as our reference simulation for the discussion of planetesimal formation. The key characteristics are presented in Sect. 3.1, the disk parameters we obtain in Sects. 3.2, 3.3, and 3.4, and the resulting disk evolution in Sect. 3.5. Based on that, we discuss the possibility of planetesimal formation in Sect. 4. Subsequently, we consider additional core collapse simulations in Sect. 5 and how the choice of planetesimal formation criterion influences our results in Sect. 6. Finally, we discuss the limitations and implications of our work in Sect. 7 and conclude our paper in Sect. 8.
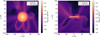 |
Fig. 1 Snapshot of the protoplanetary disk from the R2 run of H20 at t = 109.46 kyr. Left: slice in the x-y plane with z = 0.02 AU. Right: slice in the x-z plane with y = −0.44 AU. The color denotes the density on a logarithmic scale. |
2 Methods
Our model comprises two components. First, we obtained azimuthally and vertically averaged profiles for protoplanetary disk quantities from 3D nonideal MHD simulations of isolated core collapse performed by H20 which have a resolution of Δx = 1 AU at the highest level of refinement. These profiles were used as a basis for our modified version of the TwoPopPy 1D evolution code, which was used to model the dust and gas evolution in the two population approximation (Birnstiel et al. 2012). We considered two species of solids, silicates and water ice, as well as two gaseous species, the background gas consisting of hydrogen and helium, and water vapor.
2.1 Gas disk model
The H20 simulations were performed on a Cartesian grid with adaptive mesh refinement using RAMSES (Teyssier 2002). We used the physical quantities found on that grid to infer disk quantities for use in a 1D evolution model context. To achieve this, we first calculated the relevant quantity on the Cartesian grid for every cell, and then perform an average over those cells that lie within cylindrical shells with radial and vertical widths Δr and Δz, respectively. To account for different levels of refinement and the Cartesian nature of the grid, we choose the radial width to be
![$\[\Delta r(r)=\max (\Delta r_{\min}, \Delta r_0 r),\]$](/articles/aa/full_html/2025/04/aa52689-24/aa52689-24-eq1.png) (1)
(1)
where Δrmin = 2 AU. The values for Δr0 were chosen individually for each simulation according to Table 1. Furthermore, we chose the vertical extent, Δz, motivated by the vertical extent of three pressure scale heights, resulting in
![$\[\Delta z=3 H_0\left(\frac{r}{10 ~\mathrm{AU}}\right)^q,\]$](/articles/aa/full_html/2025/04/aa52689-24/aa52689-24-eq2.png) (2)
(2)
where H0 and q were also chosen individually according to Table 1 in an effort to maintain a good balance between the physical extent of three pressure scale heights varying over time and numerical stability. When performing the average, cell quantities were weighted either by cell volume or mass. If a quantity was related to material vertically falling onto the disk, it was evaluated for cells with z = ±Δz(r) within one resolution element, and the average was performed only in the vertical and azimuthal direction.
The surface density was calculated as
![$\[\Sigma(r)=\frac{M_{\Delta r}(r)}{2 \pi r \Delta r},\]$](/articles/aa/full_html/2025/04/aa52689-24/aa52689-24-eq3.png) (3)
(3)
with MΔr(r) being the mass contained in the cylindrical shell of thickness Δr centered at r. The temperature is taken as a volume-weighted average,
![$\[T_{\mathrm{MHD}}(r)=\frac{\sum_i T_i d x_i^3}{\sum d x_i^3},\]$](/articles/aa/full_html/2025/04/aa52689-24/aa52689-24-eq4.png) (4)
(4)
was with dxi the size of an individual cell and the sum being taken over all cells within the cylindrical shell centered around r with thickness Δr.
In the core collapse simulations performed by H20, the temperature was treated using a strongly simplified approximation. They followed a simple prescription as a function of the particle density, n, mimicking radiative transfer and the thermal properties of the gas,
![$\[T_{\text {pres }}=T_0\left(1+\frac{\left(n / n_1\right)^{\gamma_1-1}}{1+\left(n / n_2\right)^{\gamma_1-\gamma_2}}\right),\]$](/articles/aa/full_html/2025/04/aa52689-24/aa52689-24-eq5.png) (5)
(5)
employing the parameters T0 = 10 K, n1 = 1010 cm−3, n2 = 3 × 1011 cm−3, and γ1 = 5/3, γ2 = 7/5. This prescription does not contain any heating sources related to stellar irradiation or the accretion shock, so the disk temperature is likely underestimated. In fact, the accretion luminosity from the stellar surface in particular is believed to be a significant, albeit poorly constrained, heating source. Therefore, we artificially raised the temperature and performed a parameter study to investigate the consequences in later sections. We raised the temperature computed via Eq. (4) by a multiplication with a constant factor, ξ,
![$\[T(r)=\xi ~T_{\mathrm{MHD}}(r),\]$](/articles/aa/full_html/2025/04/aa52689-24/aa52689-24-eq6.png) (6)
(6)
while simultaneously reducing model parameters scaled by the temperature by the same factor as is shown in subsequent paragraphs. By employing this choice, we ensured that the underlying dynamics remains unchanged by the temperature scaling. We note that, while a change in the disk temperature affects the disk scale height, which is in turn used to determine the extent of the vertical averaging, the scaling is applied only after the averaging has taken place. Applying the scaling first would not change the results, as the extent of the vertical region would increase together with the scale height, yielding the same result.
An external source term was calculated to account for the significant mass infall during the disk buildup stage,
![$\[\dot{\Sigma}_{\text {ext }}(r)=\left[-\rho(r, z)\left(v_z(r, z)-v_r(r, z) \tan (\theta(r))\right)\right]_{-\Delta z}^{\Delta z},\]$](/articles/aa/full_html/2025/04/aa52689-24/aa52689-24-eq7.png) (7)
(7)
where θ(r) denotes angle of the disk surface described by the vertical extent, tan ![$\[\theta(r)=\frac{d(\Delta z)}{d r}\]$](/articles/aa/full_html/2025/04/aa52689-24/aa52689-24-eq8.png) .
.
To model the gas evolution of the disk, we took inspiration from the prescription of Tabone et al. (2022),
![$\[\frac{\partial \Sigma}{\partial t}-\frac{3}{r} \frac{\partial}{\partial r}\left(\frac{1}{r \Omega_K} \frac{\partial}{\partial r}\left(r^2 \alpha_{\mathrm{SS}} \Sigma c_s^2\right)\right)-\frac{3}{2 r} \frac{\partial}{\partial r}\left(\frac{\alpha_{\mathrm{EA}} \Sigma c_s^2}{\Omega_K}\right)=\dot{\Sigma}_{\mathrm{ext}},\]$](/articles/aa/full_html/2025/04/aa52689-24/aa52689-24-eq9.png) (8)
(8)
where ΩK is the Keplerian frequency, ![$\[c_{s}=\sqrt{k_{B} T / \mu}\]$](/articles/aa/full_html/2025/04/aa52689-24/aa52689-24-eq10.png) is the isothermal sound speed, μ is the mean molecular weight, kB is the Boltzmann constant, and αSS is the viscosity parameter,
is the isothermal sound speed, μ is the mean molecular weight, kB is the Boltzmann constant, and αSS is the viscosity parameter, ![$\[\alpha_{\mathrm{SS}}=v \Omega_{K} / c_{s}^{2}\]$](/articles/aa/full_html/2025/04/aa52689-24/aa52689-24-eq11.png) (Shakura & Sunyaev 1973). The model assumes that vϕ ≈ ΩKr, where vϕ is the azimuthal velocity of the disk, which holds true for the disks we consider in this work. The equation has been modified from its original form to account for material infall. Instead of an outflow caused by disk winds exerting an external torque characterized by αDW, the accretion of envelope material causes an external torque. Combined with the magnetic component of the stress tensor (Balbus & Hawley 1998), the envelope accretion parameter, αEA, is given by
(Shakura & Sunyaev 1973). The model assumes that vϕ ≈ ΩKr, where vϕ is the azimuthal velocity of the disk, which holds true for the disks we consider in this work. The equation has been modified from its original form to account for material infall. Instead of an outflow caused by disk winds exerting an external torque characterized by αDW, the accretion of envelope material causes an external torque. Combined with the magnetic component of the stress tensor (Balbus & Hawley 1998), the envelope accretion parameter, αEA, is given by
![$\[\alpha_{\mathrm{EA}}=-\frac{4 r}{3 \sum c_s^2}\left[\dot{\Sigma} \delta v_\phi^{\text {infall}}+\frac{B_z B_\phi}{4 \pi}\right]_{-\Delta z}^{\Delta z} \xi^{-1},\]$](/articles/aa/full_html/2025/04/aa52689-24/aa52689-24-eq12.png) (9)
(9)
with the magnetic field components Br,z,ϕ and ![$\[\delta v_{\phi}^{\text {infall }}=v_{\phi}^{\text {infall }}-r \Omega_{K}\]$](/articles/aa/full_html/2025/04/aa52689-24/aa52689-24-eq13.png) . The infalling material constitutes a positive contribution to αEA due to it being deficient in angular momentum; that is,
. The infalling material constitutes a positive contribution to αEA due to it being deficient in angular momentum; that is, ![$\[\delta v_{\phi}^{\text {infall}}<0\]$](/articles/aa/full_html/2025/04/aa52689-24/aa52689-24-eq14.png) . The deficiency in angular momentum is a consequence of magnetic braking in the envelope. The infall contribution to αEA, and therefore has the same sign as in a scenario of disk-wind-driven evolution of class II disks, where outflowing material has an excess of angular momentum (Blandford & Payne 1982).
. The deficiency in angular momentum is a consequence of magnetic braking in the envelope. The infall contribution to αEA, and therefore has the same sign as in a scenario of disk-wind-driven evolution of class II disks, where outflowing material has an excess of angular momentum (Blandford & Payne 1982).
Furthermore, αSS can be calculated as
![$\[\alpha_{\mathrm{SS}}=\frac{2}{3 c_s^2}\left(\left\langle\delta v_r \delta v_\phi\right\rangle-\frac{\left\langle B_r B_\phi\right\rangle}{4 \pi}\right) \xi^{-1}.\]$](/articles/aa/full_html/2025/04/aa52689-24/aa52689-24-eq15.png) (10)
(10)
Here, ⟨δvrδvϕ⟩ was obtained as the mass-weighted average of the product of the individual cells’ deviation from the mean flow, ⟨vr,ϕ⟩,
![$\[\delta v_{r, \phi; i}=v_{r, \phi; i}-\langle v_{r, \phi}\rangle,\]$](/articles/aa/full_html/2025/04/aa52689-24/aa52689-24-eq16.png) (11)
(11)
where the mean flow was in turn also calculated as the massweighted average,
![$\[\left\langle v_{r, \phi}\right\rangle=\frac{\sum_i v_{r, \phi; i} \rho_i d x_i^3}{\sum_i \rho_i d x_i^3}.\]$](/articles/aa/full_html/2025/04/aa52689-24/aa52689-24-eq17.png) (12)
(12)
A mass-weighted average was also applied to compute the product of the vertical and azimuthal magnetic field components.
Parameters used for the calculation of radial resolution and vertical extent.
2.2 Dust model
We used the two population approximation to model the dust evolution with TwoPopPy (Birnstiel et al. 2012). For details about the model, we refer to the corresponding publication. In the following, our adaptations to that model are highlighted.
Two solid components, silicates and water ice, were considered and evolved separately, such that
![$\[\frac{\partial \Sigma_i}{\partial t}+\frac{1}{r} \frac{\partial}{\partial r}\left[r\left(\Sigma_i \bar{v}_d-D_d \Sigma_g \frac{\partial}{\partial r}\left(\frac{\Sigma_i}{\Sigma_g}\right)\right)\right]=\dot{\Sigma}_{\mathrm{ext}, \mathrm{i}},\]$](/articles/aa/full_html/2025/04/aa52689-24/aa52689-24-eq18.png) (13)
(13)
where the index, i, denotes the respective solid species. Equation (13) uses the mass-weighted velocity of the two population approximation (see Birnstiel et al. 2012), the total gas surface density composed of hydrogen, helium and water vapor, Σg = ΣH+He + Σvap, and the dust diffusivity,
![$\[D_d=\frac{\delta_r c_s^2}{\Omega_K},\]$](/articles/aa/full_html/2025/04/aa52689-24/aa52689-24-eq19.png) (14)
(14)
where we make an assumption for the Stokes number, St = tstopΩK, of St ≪ 1, where tstop is the particle stopping time. Furthermore, following the assumption of Drążkowska & Dullemond (2018) that 50% of the infalling solids are water ice and silicates, respectively, the external source term is given by
![$\[\dot{\Sigma}_{\mathrm{ext}, \mathrm{i}}=\frac{1}{2} \epsilon_0 \Sigma_{\mathrm{ext}},\]$](/articles/aa/full_html/2025/04/aa52689-24/aa52689-24-eq20.png) (15)
(15)
with the dust-to-gas ratio of the infalling material, ε0. In Eq. (14), the parameter αSS used in the original model has been replaced by a direct characterization of the turbulent root-mean-square (RMS) velocities. As the diffusion term in Eq. (13) describes mixing in the radial direction, we only considered velocities in the radial direction,
![$\[\delta_r=\frac{\left\langle\delta v_r^2\right\rangle}{c_s^2} \xi^{-1} \chi^{-1},\]$](/articles/aa/full_html/2025/04/aa52689-24/aa52689-24-eq21.png) (16)
(16)
to separate turbulence-induced angular momentum transport and passive tracer diffusion caused by velocity fluctuations. We introduce an additional scaling factor χ in Eq. (16), which we use in the following sections to investigate the influence of the turbulent diffusion strength on planetesimal formation. Because water vapor acts as a tracer in the background gas, we also describe the water vapor surface density evolution according to Eq. (13), employing Σi = Σvap, setting ![$\[\dot{\Sigma}_{\text {ext,i }}=0\]$](/articles/aa/full_html/2025/04/aa52689-24/aa52689-24-eq22.png) and replacing
and replacing ![$\[\bar{v}_{d}\]$](/articles/aa/full_html/2025/04/aa52689-24/aa52689-24-eq23.png) with the gas radial velocity, vgas.
with the gas radial velocity, vgas.
In accordance with the aforementioned separation between angular momentum transport and tracer diffusion, an analogous separation between diffusion in different spatial direction was made, by defining
![$\[\delta_z=\frac{\left\langle\delta v_z^2\right\rangle}{c_s^2} \xi^{-1} \chi^{-1},\]$](/articles/aa/full_html/2025/04/aa52689-24/aa52689-24-eq24.png) (17)
(17)
to describe mixing in the vertical direction, counteracting the settling of dust grains. Furthermore, we defined a parameter for mixing that is not direction-dependent,
![$\[\delta_t=\frac{\left\langle\delta v_r^2\right\rangle+\left\langle\delta v_\phi^2\right\rangle+\left\langle\delta v_z^2\right\rangle}{3 c_s^2} \xi^{-1} \chi^{-1}.\]$](/articles/aa/full_html/2025/04/aa52689-24/aa52689-24-eq25.png) (18)
(18)
The relative turbulent velocity for similar-sized grains is then given by
![$\[\Delta v_{\mathrm{turb}}=\sqrt{3 \delta_t \mathrm{St}} c_s,\]$](/articles/aa/full_html/2025/04/aa52689-24/aa52689-24-eq26.png) (19)
(19)
which results from adapting the expression for the Reynolds number used in the derivation of this quantity by Ormel & Cuzzi (2007) to be
![$\[\operatorname{Re}=\frac{U L}{\nu_{\mathrm{mol}}}=\frac{v_{\mathrm{RMS}}^2}{\Omega_K \nu_{\mathrm{mol}}}=\frac{\delta_t c_s^2}{\Omega_K \nu_{\mathrm{mol}}},\]$](/articles/aa/full_html/2025/04/aa52689-24/aa52689-24-eq27.png) (20)
(20)
where U and L are the length scale and velocity of the largest eddies, respectively, vmol is the molecular kinematic viscosity, and ![$\[\frac{U}{L}=\Omega_{K}\]$](/articles/aa/full_html/2025/04/aa52689-24/aa52689-24-eq28.png) is assumed. The dust scale height was in turn adapted from Dubrulle et al. (1995),
is assumed. The dust scale height was in turn adapted from Dubrulle et al. (1995),
![$\[H_d=H_g \sqrt{\frac{\delta_z}{\delta_z+\mathrm{St}}},\]$](/articles/aa/full_html/2025/04/aa52689-24/aa52689-24-eq29.png) (21)
(21)
with the gas pressure scale height, Hg = cs/ΩK. Equation (21) can be interpreted as a prescription for dust grain settling, where it is assumed that the settling efficiency instantaneously adapts to the strength of vertical mixing and the particle Stokes number. We note that introducing the temperature scaling factor, ξ, to δz (see Eq. (17)) leads to a small artificial decrease in the dust scale height, because the Stokes number of a grain of a given size does not scale with the temperature, so that for St ≫ δz, ![$\[H_{g} / H_{d} \propto \sqrt{\xi}\]$](/articles/aa/full_html/2025/04/aa52689-24/aa52689-24-eq30.png) (cf. Eq. (21)). However, the dominant parameter affecting settling in our model is χ, as Hg/Hd ∝ χ for St ≫ δz and if the grain size is limited by fragmentation, as is the case for our models.
(cf. Eq. (21)). However, the dominant parameter affecting settling in our model is χ, as Hg/Hd ∝ χ for St ≫ δz and if the grain size is limited by fragmentation, as is the case for our models.
By applying Eqs. (19) and (21) to the growth rate of monodisperse coagulation, ![$\[\dot{a}=\rho_{g} / \rho_{\bullet} \Delta v_{\text {turb }}\]$](/articles/aa/full_html/2025/04/aa52689-24/aa52689-24-eq31.png) (Kornet et al. 2001), the growth timescale of the dust grains can be written as
(Kornet et al. 2001), the growth timescale of the dust grains can be written as
![$\[\tau_{\text {growth }}=\frac{a}{\dot{a}} \approx \frac{1}{\Omega_K \epsilon} \sqrt{\frac{\delta_z \mathrm{St}}{\delta_t\left(\delta_z+\mathrm{St}\right)}},\]$](/articles/aa/full_html/2025/04/aa52689-24/aa52689-24-eq32.png) (22)
(22)
with ρ• the dust grain internal density and a the dust grain size. Equation (22) introduces an additional factor, ![$\[\sqrt{\delta_{z} \mathrm{St} /\left(\delta_{t}(\delta_{z}+\mathrm{St}\right))}\]$](/articles/aa/full_html/2025/04/aa52689-24/aa52689-24-eq33.png) , compared to Birnstiel et al. (2012). In particular, the growth timescale depends on the local dust grain size via the Stokes number in our model, which is approximated as the current maximal size of the large grain population in the two-population model for convenience. Our results are not affected greatly by this choice, as the dust grain size is limited by fragmentation for the majority of the simulation.
, compared to Birnstiel et al. (2012). In particular, the growth timescale depends on the local dust grain size via the Stokes number in our model, which is approximated as the current maximal size of the large grain population in the two-population model for convenience. Our results are not affected greatly by this choice, as the dust grain size is limited by fragmentation for the majority of the simulation.
Furthermore, the limiting Stokes number due to fragmentation is now given by
![$\[\mathrm{St}_{\mathrm{frag}}=\frac{1}{3} \frac{v_{\mathrm{frag}}^2}{\delta_t c_s^2}.\]$](/articles/aa/full_html/2025/04/aa52689-24/aa52689-24-eq34.png) (23)
(23)
Here, the fragmentation velocity, vfrag, was set based on the water content in each radial grid cell, such that vfrag = 10 m s−1 where Σice/(Σice + Σsil) > 0.01, and vfrag = 1 m s−1 otherwise (Gundlach & Blum 2015; Aumatell & Wurm 2014), with a smooth transition for numerical stability. In total, the fragmentation velocity is therefore given by
![$\[\frac{v_{\text {frag }}}{1 \mathrm{~m} \mathrm{~s}^{-1}}=1+\frac{9}{1+\exp \left(-1000\left(\frac{\Sigma_{\text {iee }}}{\Sigma_{\text {ice }}+\Sigma_{\text {sil }}}-0.01\right)\right)}.\]$](/articles/aa/full_html/2025/04/aa52689-24/aa52689-24-eq35.png) (24)
(24)
The dust grain internal density and gas mean molecular weight were calculated dynamically following Drążkowska & Alibert (2017),
![$\[\mu=\left(\Sigma_{\mathrm{H}+\mathrm{He}}+\Sigma_{\text {vap }}\right)\left(\frac{\Sigma_{\mathrm{H}+\mathrm{He}}}{\mu_{\mathrm{H}+\mathrm{He}}}+\frac{\Sigma_{\text {vap }}}{\mu_{\text {vap }}}\right)^{-1},\]$](/articles/aa/full_html/2025/04/aa52689-24/aa52689-24-eq36.png) (25)
(25)
![$\[\rho_{\bullet}=\left(\Sigma_{\text {sil }}+\Sigma_{\text {ice }}\right)\left(\frac{\Sigma_{\text {sil }}}{\rho_{\bullet, \text { sil }}}+\frac{\Sigma_{\text {ice }}}{\rho_{\bullet, \text { ice }}}\right)^{-1},\]$](/articles/aa/full_html/2025/04/aa52689-24/aa52689-24-eq37.png) (26)
(26)
with μH+He = 2.34mp, μvap = 18mp, ρ•,sil = 3 g cm−3, ρ•ice = 1 g cm−3 and mp the proton mass.
Envelope material entering the disk is assumed to exhibit the same dust-to-gas ratio as the initial dust-to-gas ratio of the disk, which is varied in the following sections. Additionally, when new dust enters a radial grid cell due to infall, the new pebble size, a1, used by the two population model is adjusted following Morbidelli et al. (2022). It was set to be the mass-weighted average of the previous size, a1,prev, and the size of the newly injected material, given by the monomer size, a0,
![$\[a_1=\frac{a_0 \dot{\Sigma}_{\text {dust }} d t+\left(\Sigma_{\text {sil }}+\Sigma_{\text {ice }}\right) a_{1, \mathrm{prev}}}{\dot{\Sigma}_{\mathrm{dust}}+\Sigma_{\mathrm{sil}}+\Sigma_{\mathrm{ice}}}.\]$](/articles/aa/full_html/2025/04/aa52689-24/aa52689-24-eq38.png) (27)
(27)
2.3 Solid composition
We employed the prescription by Schoonenberg & Ormel (2017) to model the time-dependent evaporation and condensation of water ice and vapor, respectively1. After every integration time step, we calculated the equilibrium vapor pressure according to the Clausius-Clapeyron equation,
![$\[P_{\mathrm{eq}}=P_{\mathrm{eq}, 0} \exp \left(-\frac{A}{T}\right),\]$](/articles/aa/full_html/2025/04/aa52689-24/aa52689-24-eq39.png) (28)
(28)
with Peq,0 = 1.14 × 10¹³ g cm−1 s−2 and A = 6062 K (Lichtenegger & Komle 1991). The condensation and evaporation rates are then given by
![$\[R_c=8 \sqrt{\frac{k_B T}{\mu_{\mathrm{vap}}}} \frac{3}{4 \pi \rho_{\bullet} \bar{a}} \frac{\Omega_K}{c_s},\]$](/articles/aa/full_html/2025/04/aa52689-24/aa52689-24-eq40.png) (29)
(29)
![$\[R_e=8 \sqrt{2 \pi} \frac{3}{4 \pi \rho_{\bullet} \bar{a}} \sqrt{\frac{\mu_{\mathrm{vap}}}{k_B T}} P_{\mathrm{eq}},\]$](/articles/aa/full_html/2025/04/aa52689-24/aa52689-24-eq41.png) (30)
(30)
respectively. Here, we assume a typical particle size, ![$\[\bar{a}\]$](/articles/aa/full_html/2025/04/aa52689-24/aa52689-24-eq42.png) , given by the particle-number-weighted average,
, given by the particle-number-weighted average,
![$\[\bar{a}=\frac{N_0 a_0+N_1 a_1}{N_0+N_1}=\frac{\left(1-f_m\right) a_0 a_1^3+f_m a_1 a_0^3}{\left(1-f_m\right) a_1^3+f_m a_0^3},\]$](/articles/aa/full_html/2025/04/aa52689-24/aa52689-24-eq43.png) (31)
(31)
with the number of particles belonging to the small and large population, N0 and N1, respectively, as well as their corresponding particles sizes, a0 = 1 μm and a1. The particle size of the large population, a1, is a function of time and radial distance and given by the two population model. In later sections, we investigate the impact of our choice of a0 and the corresponding mean particle size on our results. Consequently, the time derivatives of vapor and ice surface density read as
![$\[\dot{\Sigma}_{\text {ice}}=R_c \Sigma_{\text {ice}} \Sigma_{\text {vap}}-R_e \Sigma_{\text {ice}},\]$](/articles/aa/full_html/2025/04/aa52689-24/aa52689-24-eq44.png) (32)
(32)
![$\[\dot{\Sigma}_{\text {vap}}=-R_c \Sigma_{\text {ice}} \Sigma_{\text {vap}}+R_e \Sigma_{\text {ice}}.\]$](/articles/aa/full_html/2025/04/aa52689-24/aa52689-24-eq45.png) (33)
(33)
In our dust model, we rely on the assumption that the dust composition is homogenous at all times due to instantaneous vertical mixing and establishment of the coagulation-fragmentation equilibrium. In particular, this assumption means that the ice primarily condensing on the small grains of the distribution is instantaneously also distributed to the large grains of the distribution. This approach is reasonable given the high magnitude of the vertical mixing parameter, δz, we find in the core collapse simulations (see Sect. 3.4).
2.4 Planetesimal formation
When employing the model for planetesimal formation via the streaming instability by Drążkowska & Alibert (2017), we require that two criteria are met to consider the conditions favorable for the formation of planetesimals via streaming instability to occur. First, the Stokes number of the large population, St1, needs to be larger than a threshold value, St1 ≥ 10−2 (Bai & Stone 2010). Second, the mass ratio of the large dust to the gas needs to be large enough, ρdust,1/ρgas ≥ εmid,crit. If a radial grid cell satisfies this criterion, planetesimals are formed from a fraction of the large dust, Σdust,1 = fmΣdust,
![$\[\dot{\Sigma}_{\mathrm{pltm}}=\zeta \Sigma_{\text {dust }, 1} \Omega_K,\]$](/articles/aa/full_html/2025/04/aa52689-24/aa52689-24-eq46.png) (34)
(34)
employing a planetesimal formation efficiency of ζ = 10−3 (Simon et al. 2016; Drążkowska et al. 2016).
For a given vertically integrated dust-to-gas ratio Σdust/Σgas, the threshold value εmid,crit can be seen as a limit to the vertical mixing (see Eq. (21)). A minimal value for the bulk dust-to-gas ratio in the absence of turbulence also exists (Carrera et al. 2015), but given the strong turbulent mixing found in the core collapse simulations (see Fig. 8), requiring a minimal midplane dust-to-gas ratio of εmid,crit always serves as the stronger condition. Requiring St ≥ 10−2 is restrictive compared to St ≥ 3 × 10⁻³ found by Carrera et al. (2015), and more recent works indicate that the streaming instability might lead to strong clumping for even smaller dust grains given a high enough bulk dust-to-gas ratio (Yang et al. 2017; Li & Youdin 2021). Despite that, we have still employed the more restrictive criterion for two reasons. First, the vertical stirring parameter we use in our 1D model is substantially higher than what is typically used in the aforementioned studies (δz > 10−2). Even though vertical stirring is encapsulated as a limiting mechanism in the requirement of εmid,crit, it remains to be investigated whether small grains can also be clumped under these conditions. Second, realistic systems, especially those that experience many fragmenting collisions like in our system, exhibit a grain size distribution, and it remains unclear how the critical condition for streaming instability behaves in such cases (Bai & Stone 2010; Krapp et al. 2019; Paardekooper et al. 2020; Schaffer et al. 2021; Yang & Zhu 2021). In our simulations, the condition on the midplane dust-to-gas ratio is stronger than the one on size in most cases.
Consequently, a sink term for ices and silicates is introduced,
![$\[\dot{\Sigma}_{\text {ice,pltm }}=-\frac{\Sigma_{\text {ice }}}{\Sigma_{\text {ice }}+\Sigma_{\text {sil }}} \dot{\Sigma}_{\mathrm{pltm}},\]$](/articles/aa/full_html/2025/04/aa52689-24/aa52689-24-eq47.png) (35)
(35)
![$\[\dot{\Sigma}_{\text {sil,pltm }}=-\frac{\Sigma_{\text {sil }}}{\Sigma_{\text {ice }}+\Sigma_{\text {sil }}} \dot{\Sigma}_{\text {pltm }}.\]$](/articles/aa/full_html/2025/04/aa52689-24/aa52689-24-eq48.png) (36)
(36)
In the following sections, we employ two different threshold values: first, a more strict criterion of εmid,crit = 1 (Drążkowska et al. 2016; Youdin & Goodman 2005), and second, a weaker criterion of εmid,crit = 0.5 (Gole et al. 2020).
3 Reference core collapse simulation
We computed parameters that govern the surface density time evolution of disks arising in the 3D core collapse simulations. They employed nonideal MHD on a Cartesian grid with adaptive mesh refinement. In particular, the model “R2” from H20 was used as a reference, with a comparison to models “R1” and “R7” in later sections. This simulation was run for a physical time of 100 kyr, with a resolution of dx = 1 AU at the highest AMR refinement level. Only the gas disk was modeled.
The initial core mass of the models in H20 is 1 M⊙. We started considering snapshots once the central sink particle, mimicking the star, had formed and the initially violent dynamics had subsided. In the case of R2, this corresponds to t0 = 74.49 kyr. At this stage, the sink particle has a mass of M⋆ 13 Mdisk = 0.25 M⊙. The evolution of the sink particle mass is shown in Fig. 2. At the end of the R2 simulation, the mass has progressed to M⋆ = 26 Mdisk = 0.44 M⊙.
3.1 Simulation resolution
A zoom-in of the disk that is formed in the reference model R2 (see Fig. 1) is shown in Fig. 3, where the x-z plane is shown. The height corresponding to one pressure scale height Hg is marked. The snapshot corresponds to a physical time of 109.46 kyr after the beginning of core collapse. At this time, M⋆ = 0.41 M⊙ = 34 Mdisk. It can be seen that the disk itself is approximately axisymmetric, while the same does not hold true for the infall. However, for simplicity, this was neglected here so that we can model the disk only in the radial dimension, averaging in the azimuthal direction and vertically when applicable. As a higher spatial resolution is computationally expensive, it is currently not feasible for simulations running for ~100 kyr to be run with higher resolution. Thus, we were restricted to models with a limited resolution of at most three cells per scale height in the outer regions of the disk, with the resolution being worse in the inner disk. Therefore, we did not make a distinction between the bulk of the disk and the disk midplane at this time, even though the dynamics caused by the strong infall likely has a less severe impact on the midplane, which is the region large dust grains settle to and thus most relevant for planetesimal formation.
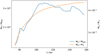 |
Fig. 2 Mass evolution over time of the sink particle at the center of the R2 simulation from H20. The blue line shows the fraction M⋆/Mdisk with values indicated on the left axis, whereas the orange line shows the sink particle mass in units of solar masses, with values indicated on the right axis. |
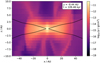 |
Fig. 3 Zoom-in on the disk from R2 of H20 in the x-z plane at t = 109.46 kyr, showing the density on a logarithmic scale. To accommodate for the disk’s shape, x and z axes are scaled differently. The gas pressure scale height, Hg, is marked by black lines. |
3.2 Disk parameters
The left panel of Fig. 4 shows the azimuthally averaged surface density for all available snapshots. The goal of this section is to reconstruct the time evolution shown in this figure by integrating a 1D advection-diffusion equation. The employed parameter profiles were then used to model dust and gas evolution simultaneously in a 1D framework. In particular, the profiles of the torque-related parameters, which will be discussed in Sect. 3.3, show that the time evolution of the disk during the infall stage is best described by an infall induced external torque, rather than a viscosity-induced internal one, which is a fundamental difference from previous 1D models and may not be immediately obvious when just considering Fig. 4. A disk driven by an external torque is similar to a wind-driven accretion case for class II disks (Tabone et al. 2022), but the fundamental physical difference to the disk shown in Fig. 4 is that the torque is a result of the accretion of angular momentum-deficient material, which has undergone magnetic braking, rather than the ejection of material whose angular momentum is increased due to the magnetic lever arm.
Figure 5 shows the azimuthally and vertically averaged disk temperature without an additional scaling factor ξ discussed in Sect. 2.1. It is apparent that in this case, the disk is cooler than what is typically assumed for protoplanetary disks in their early evolutionary stages. In fact, since T < 150 K everywhere in the simulation grid, we cannot consider effects related to the snow line using this temperature profile, because the snow line is within the central resolution element around the star. Therefore, the snow line can only be considered as a potential planetesimal formation site for scaling factors ξ > 1 that allow cells in the simulation grid to reach T ≥ 150 K.
Some disks found by H20 are gravitationally unstable, and modeling them would require approximating the impact of the long-range gravitational force as a local phenomenon to fit into the picture of a viscously evolving gas disk. Additionally, separate treatment for dust evolution is typically necessary. In order to constrain this work to disks whose surface density evolution can be approximated in a 1D framework to reasonable accuracy, we only considered core collapse simulations with disks that remained stable during the runtime. The treatment of planetesimal formation in gravitationally unstable early-stage disks remains subject to future work. We verified that the disk in R2 is gravitationally stable throughout the simulations runtime; that is, that the Toomre parameter,
![$\[Q=\frac{\Omega c_s}{\pi G \Sigma},\]$](/articles/aa/full_html/2025/04/aa52689-24/aa52689-24-eq49.png) (37)
(37)
was larger than 1 for all snapshots. In fact, we find that Q ≳ 10 throughout the simulation. We also find the disks from other core collapse simulations discussed in Sect. 5 to be gravitationally stable according to this criterion.
Figure 6 shows the radial profile of the azimuthally averaged infall from the envelope onto the disk. It is apparent that it is very centrally concentrated, with ![$\[\dot{\Sigma}\]$](/articles/aa/full_html/2025/04/aa52689-24/aa52689-24-eq50.png) dropping by four orders of magnitude before reaching the disk outer radius in the first simulation time step. Some outflow can be observed at the outer edge of the disk. However, in the interest of numerical stability, outflow is not considered, and the source term is set to zero at radii where it is negative. This simplification is also justified by the small magnitude and radial extend of the outflow compared to the infall.
dropping by four orders of magnitude before reaching the disk outer radius in the first simulation time step. Some outflow can be observed at the outer edge of the disk. However, in the interest of numerical stability, outflow is not considered, and the source term is set to zero at radii where it is negative. This simplification is also justified by the small magnitude and radial extend of the outflow compared to the infall.
The right-hand side of Fig. 6 shows the total – that is, the radially integrated – mass infall rate. Over the course of the simulation, it drops by an order of magnitude as the initially vigorous infall starts subsiding. In order to compute the radially integrated infall rate, we excluded the region r < 6 AU as this region uses cells from within the sink particle accretion radius of rsink = 4dx for the calculation of ![$\[\dot{\Sigma}\]$](/articles/aa/full_html/2025/04/aa52689-24/aa52689-24-eq51.png) . Numerical issues produce unphysically high values here, which was previously found by Lee et al. (2021). If the region was included, the magnitude of the infall rate would be
. Numerical issues produce unphysically high values here, which was previously found by Lee et al. (2021). If the region was included, the magnitude of the infall rate would be ![$\[\dot{M}\]$](/articles/aa/full_html/2025/04/aa52689-24/aa52689-24-eq52.png) = 10−4 M⊙ yr−1, which is very large compared to the values of ~10−6 M⊙ yr−1 typically assumed for 1D infall models.
= 10−4 M⊙ yr−1, which is very large compared to the values of ~10−6 M⊙ yr−1 typically assumed for 1D infall models.
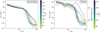 |
Fig. 4 Gas surface density, Σgas, as a function of radial distance. The line color denotes the elapsed simulation time as indicated by the color bar, where a darker color indicates later times. Left: Calculated directly from the R2 core collapse simulation. Right: Obtained in our 1D model when starting from the first core collapse snapshot and employing the previously extracted model parameters. The dashed black line indicates the median relative error of Σgas obtained from the 1D model compared to the R2 simulation, with values indicated on the right ordinate. |
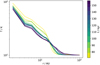 |
Fig. 5 Average temperature as a function of radial distance found in R2. Different line colors indicate different simulation times according to the color bar, as in Fig. 4. |
3.3 Torque parameters
Modeling the time evolution of the protoplanetary disk requires a characterization of both the internal torques, αSS, and external torques, αEA (cf. Eq. (8)).
The radial profile of the azimuthally and vertically averaged αSS, given by Eq. (10), is shown in the left panel of Fig. 7. It can be seen that αSS reaches negative values in most radial grid cells inside the disk radius, which is caused by ⟨δvr δvϕ⟩ < 0 dominating Eq. (10). This is unlike the positive values used in commonly used 1D viscous evolution models for class II and early-stage disks. In fact, αSS > 0 in Eq. (8) results in a diffusion of the gas surface density over time in accordance with the outward angular momentum transport induced by turbulent motion. Mathematically, there is no constraint on the sign of αSS, and a negative value describes the transport of angular momentum toward the inner edge instead. In the context of a 1D radial diffusion model, αSS < 0 is not physical, though, as it leads to diffusion backward in time, removing entropy and violating thermodynamics. Instabilities at the root of turbulence in class II disks, such as the magnetorotational instability (MRI), lead to the outward transport of angular momentum, but the MRI energy injection scales are much smaller than the resolution of the core collapse simulations, as ![$\[L=\sqrt{\alpha_{\mathrm{MRI}}} H_{p}\]$](/articles/aa/full_html/2025/04/aa52689-24/aa52689-24-eq53.png) .
.
We did not investigate whether the velocity fluctuations found in the core collapse simulations are caused by disk turbulence or other processes like sound or shock waves from the infall, because such an investigation is out of scope of this work. As the observed angular momentum transport is not in a direction where the commonly applied 1D viscous evolution equation is applicable, αSS as shown in Fig. 7 could not be used. Instead, we used a constant value of αSS = 10−1 and in doing so also neglected the very high values at r ≳ 20 AU, as this region contains orders of magnitude less mass than the inner region (see Fig. 4) due to it being outside the disk. While this values still implies considerable angular momentum transport, we find that this choice produces the closest match between the evolution of the disk in the core collapse simulation and the 1D framework. We scaled this constant value with ξ, analogously to αEA (cf. Eq. (9)). Other processes related to dust and vapor evolution that are often modeled using αSS were modeled with other diffusion parameters instead. They are related to the RMS of the velocity fluctuations to uphold the best possible level of self-consistency (see Sect. 3.4).
Furthermore, the usage of this constant value for αSS can be further justified by the fact that the parameter characterizing the external torque, αEA (cf. Eq. (9)), caused mainly by the infall in this scenario, largely dominates the evolution. This is shown on the right-hand side of Fig. 7. The angular momentum deficit of the infalling material causes values of αEA to reach a few tens in the inner disk and on the order of one closer to the outer edge of the disk. The contribution of the magnetic field (cf. Eq. (9)) is negligible in comparison, only reaching values up to ~10−1 at the disk edge. With the positive sign of αEA corresponding to inward advection of disk mass, the evolution is similar to a class II disk whose evolution is dominated by disk winds, as discussed above. However, the different physical origin of the external torque results in higher values for αEA than found for αDW in disk-wind scenarios. Additionally, Fig. 7 shows that αEA reaches negative values for large radii late in the evolution. As this is outside the disk radius, and in the interest of numerical stability, we set αEA = 0 in the corresponding radial grid cells instead.
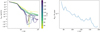 |
Fig. 6 Source term of gas entering the disk bounds in R2. Left: time derivative of the surface density caused by mass entering the disk bounds, azimuthally averaged as a function of radial distance. The ordinate is scaled linearly if the absolute value is below 10−12, but logarithmically otherwise. Line coloring like in Fig. 4. Right: total instantaneously infalling mass as a function of time. |
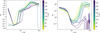 |
Fig. 7 Torque parameters describing the dynamical evolution of the gas disk in R2, with line coloring like in Fig. 4. Left: radial profile of the internal torque parameter αSS (cf. Eq. (10)), which is scaled linearly if the absolute value is less than 10−4, but logarithmically otherwise. Right: radial profile of the external torque parameter αEA (cf. Eq. (9)) on a logarithmic scale. |
3.4 Dust evolution parameters
To describe the radial diffusion of dust and vapor, vertical settling of dust and the fragmentation limit in the two-population framework (Birnstiel et al. 2012), αSS was replaced by δr, δz, and δt, respectively (see Sect. 2). The profiles we calculated from the core collapse simulation are shown in Fig. 8.
The first panel in Fig. 8 shows δr. It can be seen that values within the disk outer radius range between δr ~ 10−3 and δr ~ 10−2. While the magnitude is high for small radii, which is likely related to the sink accretion and overestimated mass infall as described above, the magnitude drops for increasing radius, but increases again for larger radii while still within the disk outer radius. In other words, there is a region in the disk where, for some snapshots, the radial diffusion parameter drops by an order of magnitude. The profile of δz is shaped similarly, but with a greater magnitude of up to several 10−1. For some snapshots, the vertical settling parameter drops by up to two orders of magnitude at r ~ 10 AU, which translates to more favorable conditions for planetesimal formation. Lastly, the third panel of Fig. 8 shows that δt does not exhibit strong variation in its magnitude, staying at δt ~ 10−1 within the disk.
3.5 Gas evolution in the 1D framework
By employing the parameter profiles described in this section, the gas surface density evolution found in the core collapse simulation was reconstructed from an initial snapshot, which was chosen such that initial strong changes in the surface density have subsided. Log interpolation was used to obtain the corresponding radial profiles on the 1D simulation grid. Furthermore, the parameter profile at any given moment in time was found by performing a linear interpolation at each time step. Therefore, the runtime of the 1D simulation was limited to the runtime of the original core collapse simulation. The right panel of Fig. 4 shows the time evolution of the surface density as found in the 1D framework without including any dust evolution. It can be seen that it matches the original in order of magnitude, which we consider to be sufficient for the investigation of planetesimal formation. We preferred such an approximate model of the disk evolution and dynamics over the direct application of the disk surface density and gas velocities as found in the core collapse simulations. The reason for this is that a direct application would not result in a self-consistent simultaneous description of the gas and solid surface density due to the usage of averages in azimuthal and vertical direction, as well as the mismatch of internal and output time step size of the core collapse simulation.
The kink seen in the 1D model’s surface density profiles at r = 6 AU, as well the increased total disk mass of the 1D model compared to the core collapse simulation, are related to two effects. First, the calculation of the mass infall rate may result in unphysically high values within the sink particle accretion radius. Second, we do not consider the removal of mass exceeding the sink particle accretion threshold within the sink’s accretion radius in the 1D model. In fact, we find that a change in the sink particle accretion mass threshold affects the slope and magnitude of the surface density profiles considerably beyond the sink particle accretion radius. Increasing the accretion threshold leads to a higher disk mass, which gives a better match to the disk mass found in our 1D model. However, in the interest of investigating simulations that cover the longest physical time period, we constrained our analysis to the R2 simulation of H20 where the threshold was not increased. This simulation employs a threshold density of nacc = 1013 cm−3. While the magnitude of the surface density affects the Stokes number of the dust grains, this has no considerable effect on our results, as we find planetesimal formation to occur predominantly at r ≳ 10 AU in the following sections, whereas the mass mismatch occurs at r ≲ 6 AU. We note that the increase in the median relative error indicated in Fig. 4 at 20 AU is caused by the disk cutoff radius mismatch between the core collapse simulation and the 1D model as shown in Fig. 10. This has no considerable effect on the planetesimal formation model. Furthermore, while a potential change in the pressure gradient impacts the drift speed of dust grains, dust drift is not impactful in our model as it occurs on timescales that exceed the simulated physical time. Because the surface density is overestimated in the inner disk regions, the total disk mass, shown in Fig. 9, is also overestimated by our 1D model by a factor of ~3. It exhibits only minor variations over time, which implies that the infalling mass and the strong advection caused by it create a balance where infalling material is not retained in the disk. Lastly, a detailed explanation of the boundary conditions is given in Appendix A.
To characterize the disk that forms in the R2 run and the quality of our reconstruction in the 1D framework, a series of fits was applied to the surface density profile over time, with a fit function of
![$\[\Sigma(r)=\Sigma_0\left(\frac{r}{R_0}\right)^{-\gamma} \exp \left(-\left(\frac{r}{R_{\mathrm{cut}}}\right)^\delta\right)+\Sigma_{\mathrm{env}},\]$](/articles/aa/full_html/2025/04/aa52689-24/aa52689-24-eq54.png) (38)
(38)
with R0 = 12 AU. The resulting fit parameters are shown in Fig. 10. The magnitude of the surface density at a fixed location, Σ0, as well as the disk cutoff radius Rcut, match the order of magnitude. While the cutoff radius increases over time with the disk growing, Σ0 shows less variation over time. The slope of the surface density profile, γ, exhibits greater deviation between MHD simulation and 1D model, as it is likely impacted by inaccurate physics near the sink particle accretion radius. We note that the quality of the fits varies between snapshots, causing fluctuations in the fit parameters.
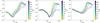 |
Fig. 8 Radial profiles of model parameters describing dust properties and evolution, calculated from the disk in R2 and with line coloring like in Fig. 4. Left: radial diffusion parameter, δr (cf. Eq. (16)). Middle: vertical mixing parameter δz (cf. Eq. (17)). Right: turbulence parameter, δt (cf. Eq. (18)). |
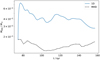 |
Fig. 9 Disk mass as a function of time, calculated directly from the R2 core collapse simulation (dashed black line) and from the surface density profiles obtained in our 1D model (blue line). |
4 Planetesimal formation study
In this section, we investigate the possibility of planetesimal formation taking place in the disk found in the R2 core collapse simulation over the runtime of the simulation. We conducted a parameter study by varying the temperature scaling parameter, ξ ∈ [1, 9], the initial vertically integrated and infall dust-to-gas ratio, ε0 ∈ [0.01, 0.07], the critical value of the mid-plane dust-to-gas ratio for the onset of the streaming instability, εmid,crit ∈ {0.5, 1}, and the velocity fluctuation reduction factor, χ ∈ [1, 100], as well as the dust monomer size, a0, throughout the following subsections. For a0, we considered both 1 μm and 0.1 μm, as well as a scenario without small grains, so that both the monomer size and the average grain size are given by the size of the large population, ![$\[\bar{a}\]$](/articles/aa/full_html/2025/04/aa52689-24/aa52689-24-eq55.png) = a0 = a1. The various parameters that are the subject of this study are summarized in Table 2.
= a0 = a1. The various parameters that are the subject of this study are summarized in Table 2.
Promising mechanisms that lead to an enrichment in dust that is sufficient to trigger planetesimal formation via the streaming instability are the traffic-jam effect (Drążkowska & Alibert 2017; Schoonenberg & Ormel 2017) and the cold-finger effect (Cuzzi & Zahnle 2004). The traffic-jam effect relies on a difference in radial drift speed between dust aggregates of different composition to create a local enhancement at the location of evaporation fronts. However, radial drift does not play a significant role during the short early infall phase, because the time it takes for pebbles in the outer disk regions to drift to the inner disk is larger than the simulation runtime of ~100 kyr. Therefore, we focussed our study on the ability of the cold-finger effect to produce local enhancements in the dust-to-gas ratio. The cold-finger effect relies on the evaporation of solid material as dust grains cross evaporation fronts. In particular, we put our focus on the evaporation of water ice at the snow line. Here, new water vapor is supplied by the arrival of grains with ice mantles from the outer disk. This vapor is, in turn, redistributed toward both hotter and colder regions in the disk by turbulent diffusion. Consequently, a fraction of the water vapor created at the snow line reaches a location of low-enough temperature to condense back on the solid grains. This cycle results in the retention of a fraction of the solid flux through the snow line location, thereby enhancing the local dust-to-gas ratio. Unlike the traffic-jam effect, the enhancement caused by the cold-finger effect is not reliant on the differential drift of dust grains compared to the gas, as long as sufficient flux of solids passes the snow line and radial diffusion is strong enough to offset the missing speed difference. Because the local dust-to-gas ratio is enhanced by the retention of ice, planetesimals formed by the cold-finger effect have a large water fraction, unlike the ones formed by the traffic-jam effect for which the enhancement is driven by silicates.
 |
Fig. 10 Parameters describing the disk surface density profile according to Eq. (38) as a function of time. Fits to the profiles calculated directly from the R2 simulation are shown in dashed black lines, whereas fits to the profiles obtained in our 1D model are depicted with solid blue lines. Left: surface density at reference radial distance r = 12 AU. Middle: disk cutoff radius, describing the radial distance where the surface density starts dropping exponentially. Right: slope of the surface density profile. |
4.1 Impact of the disk temperature
First, we investigated the role of ξ, whose main effect on the simulations is to change the location of the snow line rsnow in the disk, defined as the radial location where the fragmentation velocity increases sharply (cf. Eq. (24)). Figure 11 presents rsnow as a function of time for all investigated values of ξ. In the case of ξ = 1, the snow line is not located within the simulation grid; that is, it lies inside 2 AU. Therefore, no snow line related effects can occur in runs with ξ = 1, whereas the snow line is located within the simulation grid for higher values of ξ. For ξ = 3 and ξ = 7, the mean location of the snow line is rsnow ~ 4 AU and rsnow ~ 16 AU, respectively, with limited movement covering ~2 AU. Movement of the snow line is more significant for ξ = 5 and ξ = 9, covering ~6 AU and ~5 AU, respectively. In those cases, the mean snow line locations are at 11 AU and 20 AU, respectively.
In simulations for which the snow line is not found inside the simulation grid, in other words where ξ = 1, material is not accumulated, due to the absence of any snow-line related effects. Therefore, the vertically integrated dust-to-gas ratio (also called metallicity in the literature), (Σsil + Σice)/(Σvap + ΣH+He), does not exceed the initial value of 1%. The high magnitude of the δz parameter (see Fig. 8) means that settling is inefficient. As a result, the midplane dust-to-gas ratio, the value indicative of the possibility of planetesimal formation, cannot reach the threshold value, and no planetesimals form in the ξ = 1 scenario. This choice of ξ corresponds to a cold disk that is not heated by the release of gravitational energy from the accretion.
By comparing to core collapse simulations that have a limited runtime but that use a more detailed temperature model including radiative transfer and contributions of the accretion luminosity (Hennebelle et al. 2020a; Lee et al. 2021; Lebreuilly et al. 2024), we find, using visual inspection, that applying a factor of ξ = 5 to ξ = 7 to our temperature profile produces a good match to these models. On the left-hand side of Fig. 12, the vertically integrated dust-to-gas ratio of a run with ξ = 5 is presented. With the snow line now being at a location within the radial grid of the 1D mode, the cold-finger effect leads to a very significant increase in the bulk dust-to-gas ratio, reaching a value of 1 after ~50 kyr and even reaching 10 at the very end of the simulation. We note that, in principle, such high values of the bulk dust-to-gas ratio warrant a treatment of the back-reaction of the dust onto the gas, which we neglect here. We discuss this further in Sect. 7.5. Dust grains remain small, however, as they reach the low fragmentation limit set by high relative velocities, described by a high value of δt (see Fig. 8). As vertical settling remains inefficient, the midplane dust-to-gas ratio is not increased compared to the bulk dust-to-gas ratio, but the critical value is exceeded by orders of magnitude regardless.
The time evolution of the radial profile of St1 is shown on the right-hand side of Fig. 12. Due to the nature of the two population model, the Stokes number is a direct result of the limiting Stokes number due to drift or fragmentation, multiplied by a fudge factor fd or ff, respectively. In this work, grains are always fragmentation limited, so that the Stokes number of the large grains is given by St1 = ffStfrag = 0.37Stfrag. In the region at r > 30 AU, the Stokes number exceeds the limit given by fragmentation only because the lower limit given by the monomer size leads to larger Stokes numbers due to the very low density. While the Stokes number could in principle be lower than ffStfrag due to being limited by growth or the mixing with infalling small particles (cf. Eq. (27)), these two effects are not significant for the run shown in Fig. 12. Therefore, despite the density criterion for planetesimal formation being met, the Stokes number of the large grains St1 never reaches the required value of St1 ≥ 10−2. Inside the disk, the maximal Stokes number only reaches values of ~10−3. Therefore, planetesimals do not form for any run with χ = 1; that is, the full turbulence obtained directly from the 3D core collapse simulation. While a relaxation of the size criterion discussed in Sect. 2.4 would lead to planetesimal formation in this scenario, it also represents the case of the most violent dynamics, and it is unclear whether the streaming instability can produce strong clumping for very small grains under these conditions.
The reason for the strong enrichment of the vertically integrated dust-to-gas ratio even beyond a value of 1 is the large flux of material crossing the snow line, so that a large mass of ice can evaporate and condense, retaining a fraction of the material that was advected past the snow line. In fact, in contrast to class II disks, the dust drift is not the dominant reason for a high radial speed of solids. Due to the high value of αEA caused by the strong infall, gas is advected with a high radial speed, between 103 cm s−1 in the outer disk and 105 cm s−1 in the inner disk. Dust drift only leads to an increase in speed by at most a factor of ~10 for simulations with the largest grains (χ = 100). These high advection speeds in combination with a high infall rate (see Fig. 6) enable the cold-finger effect to be highly efficient, and thus result in a high bulk dust-to-gas ratio at the snow line. The flux passing through the snow line is naturally also related to its location. It is diminishing for increasing radial distance, as both the radial velocity and the dust surface density decrease with radial distance from the star. In a class II disk with no infalling material, the total dust mass would be decreasing due to radial drift, and snow line related effects only concentrate solids present in the disk initially in order to achieve a higher local dust-to-gas ratio. In class 0/I disks, the picture is different. Here, the large amount of mass accreted from the envelope is balanced by rapid accretion onto the star, so that the gas disk mass remains approximately constant over time. At the same time, the cold finger effect allows some accreted dust to be retained in the disk, increasing the total dust-to-gas ratio and thereby potentially establishing conditions favorable for planetesimals to form from the accreted solids. The time evolution of the total dust and gas masses, as well as the total dust-to-gas ratio, are shown in Fig. 13.
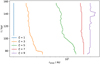 |
Fig. 11 Radial location of the snow line as a function of time. The line color corresponds to the temperature scaling factor, ξ. |
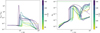 |
Fig. 12 TwoPopPy simulation based on R2 quantities, but with the temperature scaled by ξ = 5. The line color denotes the time in the simulation according to the color bar, with a darker color indicating a later time. Left: radial profile of the vertically integrated dust-to-gas ratio Σdust/Σgas. Right: radial profile of the pebble Stokes number St1, i.e., the Stokes number of the large grains in the two-population approximation. The dashed lines indicate the value expected from the two population model for this setup, ffStfrag. The separate dashed green line at St1 = 10−2 indicates the minimal Stokes number required for strong clumping via the streaming instability. |
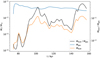 |
Fig. 13 Total gas (orange line) and dust (blue line) masses as a function of time for a run with temperature scaling ξ = 5. In addition, the total dust-to-gas ratio Mdust/Mgas is shown on a separate axis using a black line. |
4.2 Relevance of the average dust grain size
In our model, we find a strong dependence of the total mass of formed planetesimals on the average particle size. This can be understood by considering the timescale of evaporation of the ice mantle of a single dust grain and the distance covered by the particle during that time. Water vapor created during the evaporation must diffuse across the snow line to condense in order for the cold-finger effect to be efficient in retaining solids in the disk. If the distance covered by an evaporating particle increases, a smaller fraction of water vapor diffuses backward over the snow line and the cold-finger effect’s effectiveness decreases. In order to gain a qualitative understanding of the importance of the grain size for the effectiveness of the cold-finger effect, we made the simplifying assumptions that the particles are fully made of ice and that the disk quantities stay constant during the evaporation process. Under these assumptions, the evaporation of the particle takes place on the timescale
![$\[\tau_{\text {evap }}=\bar{a}\left|\frac{d a}{d t}\right|^{-1}=\bar{a} \rho_{\bullet} \sqrt{\frac{\pi k_B T}{8 \mu_{\mathrm{vap}}}} P_{\mathrm{eq}}^{-1}.\]$](/articles/aa/full_html/2025/04/aa52689-24/aa52689-24-eq56.png) (39)
(39)
The radially outward mixing of a passive tracer in gas is described by (Pavlyuchenkov & Dullemond 2007)
![$\[\frac{\Sigma_i}{\Sigma}=\sigma_i^{(0)}+\sigma_i^{(1)}\left(\frac{r_1}{r}\right)^{\frac{3}{2} \widetilde{\mathrm{Sc}}},\]$](/articles/aa/full_html/2025/04/aa52689-24/aa52689-24-eq57.png) (40)
(40)
with the equivalent Schmidt number, ![$\[\widetilde{\mathrm{Sc}}=\alpha_{\mathrm{EA}} / \delta_{r}\]$](/articles/aa/full_html/2025/04/aa52689-24/aa52689-24-eq58.png) , describing the relative strength of advection and diffusion, Σi being the tracer surface density,
, describing the relative strength of advection and diffusion, Σi being the tracer surface density, ![$\[\sigma_{i}^{(0)}\]$](/articles/aa/full_html/2025/04/aa52689-24/aa52689-24-eq59.png) the tracer background abundance, and
the tracer background abundance, and ![$\[\sigma_{i}^{(1)}\]$](/articles/aa/full_html/2025/04/aa52689-24/aa52689-24-eq60.png) the abundance of the tracer at an arbitrary location, r1. We assume that water vapor is created, on average, a certain distance inward of the snow line due to the finite time of the sublimation of water from the pebble as it drifts inward. This distance is given by revap = rsnow + vgasτevap with vgas < 0. By applying
the abundance of the tracer at an arbitrary location, r1. We assume that water vapor is created, on average, a certain distance inward of the snow line due to the finite time of the sublimation of water from the pebble as it drifts inward. This distance is given by revap = rsnow + vgasτevap with vgas < 0. By applying ![$\[\sigma_{i}^{(0)}=0, r_{1}=r_{\text {evap}}\]$](/articles/aa/full_html/2025/04/aa52689-24/aa52689-24-eq61.png) and
and ![$\[\sigma_{i}^{(1)}=\Sigma_{\text {vap }}\left(r_{\text {evap }}\right) / \Sigma\left(r_{\text {evap }}\right)\]$](/articles/aa/full_html/2025/04/aa52689-24/aa52689-24-eq62.png) to Eq. (40), we find that the fraction of vapor that reaches the snow line is given by
to Eq. (40), we find that the fraction of vapor that reaches the snow line is given by
![$\[\frac{\Sigma_{\text {vap}}\left(r_{\text {snow}}\right)}{\sum_{\text {vap}}\left(r_{\text {evap}}\right)}=\left(1+\frac{v_{\text {gas}} \tau_{\text {evap}}}{r_{\text {snow}}}\right)^{\frac{3}{2} \tilde{\mathrm{Sc}}} \frac{\Sigma\left(r_{\text {snow}}\right)}{\sum\left(r_{\text {evap}}\right)}.\]$](/articles/aa/full_html/2025/04/aa52689-24/aa52689-24-eq63.png) (41)
(41)
In the R2 core collapse simulation, we typically have ![$\[\widetilde{\mathrm{Sc}} \sim 100\]$](/articles/aa/full_html/2025/04/aa52689-24/aa52689-24-eq65.png) , whereas the Schmidt number Sc = ν/D is at least an order of magnitude smaller in class II disks, reaching values of Sc ~ 10 (Carballido et al. 2005). Equation (41) shows that
, whereas the Schmidt number Sc = ν/D is at least an order of magnitude smaller in class II disks, reaching values of Sc ~ 10 (Carballido et al. 2005). Equation (41) shows that ![$\[\frac{\Sigma_{\text {vap}}(r_{\text {snow}})}{\Sigma_{\text {vap}}(r_{\text {evap}})} \sim \tau_{\text {evap}}^{1.5 \tilde{\mathrm{Sc}}}\]$](/articles/aa/full_html/2025/04/aa52689-24/aa52689-24-eq66.png) , with
, with ![$\[\tau_{\text {evap }} \sim \bar{a}\]$](/articles/aa/full_html/2025/04/aa52689-24/aa52689-24-eq67.png) . Therefore, the Schmidt number being at least an order of magnitude larger makes the choice of the average particle size very impactful, in contrast to class II models, where it has a negligible effect.
. Therefore, the Schmidt number being at least an order of magnitude larger makes the choice of the average particle size very impactful, in contrast to class II models, where it has a negligible effect.
Figure 14 shows the fraction of vapor reaching the snow line as calculated by Eq. (41), averaged over the simulation time and as a function of the average grain size for different values of χ. The time-dependent results are discussed in Appendix B. As the reduction of velocity fluctuation strength reduces radial diffusion, a smaller mass fraction reaches the snow line for higher χ. Therefore, even though a higher value of χ produces larger dust grains, the effectiveness of the cold-finger effect is reduced in turn. Furthermore, a larger average grain size implies a reduction in the mass fraction reaching the snow line, where less than 20% is retained for ![$\[\bar{a}\]$](/articles/aa/full_html/2025/04/aa52689-24/aa52689-24-eq68.png) ≥ 10−2 cm (χ = 100) or
≥ 10−2 cm (χ = 100) or ![$\[\bar{a}\]$](/articles/aa/full_html/2025/04/aa52689-24/aa52689-24-eq69.png) ≥ 10−1 cm (χ = 10). This greatly diminishes the effectiveness of the cold-finger effect to a point where it becomes negligible.
≥ 10−1 cm (χ = 10). This greatly diminishes the effectiveness of the cold-finger effect to a point where it becomes negligible.
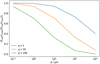 |
Fig. 14 Time average of the mass fraction of water vapor reaching the snow line via backward radial diffusion from revap = rsnow + vgasτevap (cf. Eq. (41)). It is shown as a function of the mean grain size, |
![$\[\bar{a}\]$](/articles/aa/full_html/2025/04/aa52689-24/aa52689-24-eq64.png)
4.3 Dependence on the magnitude of velocity fluctuations
In Fig. 12, we show that solids cannot grow to a size sufficient to trigger the streaming instability and form planetesimals. The limiting factor for dust growth in our simulations is fragmentation due to high relative velocities. They are likely not of turbulent nature, but are rather induced by accretion-related shocks. Therefore, the high magnitude of those fluctuations might not protrude all the way to the midplane of the disk, which is the site of planetesimal formation. However, the resolution of the core collapse simulations is not sufficient to resolve the scale height of the disk (see Fig. 3), so that the impact of accretion on velocity fluctuations closer to the midplane remain subject to future investigations. It is likely that we overestimate their magnitude. Additionally, the limiting velocity for two grains to fragment, the so-called fragmentation velocity, is subject to debate, where laboratory experiments and theoretical calculations about the fragility of icy dust aggregates compared to silicate grains produce incompatible results. Different from our assumptions (see Sect. 2), higher fragmentation thresholds have been suggested in the past (Ormel et al. 2009), whereas newer works indicate lower thresholds, challenging the assumed higher stickiness for icy dust aggregates (Musiolik & Wurm 2019; Gundlach et al. 2018; Steinpilz et al. 2019). However, a sweep-up process during the early disk stages might allow grains to grow beyond the fragmentation barrier (Xu & Armitage 2023). We also neglect how porosity could affect the maximum grain size and Stokes number (Okuzumi et al. 2012).
In order to encapsulate all aforementioned arguments into this parameter study, we studied the impact of reducing the turbulence dust grains are subject to, by adopting a factor χ (see Sect. 2). When considering the limiting Stokes number due to fragmentation, Stfrag (cf. Eq. (23)), assuming a lower vfrag yields an equivalent value to assuming an increased turbulent velocity reduction factor; that is, ![$\[\mathrm{St}_{\text {frag }} \propto \chi v_{\text {frag }}^{2}\]$](/articles/aa/full_html/2025/04/aa52689-24/aa52689-24-eq70.png) . On the other hand, the settling efficiency described by Hg/Hd (cf. Eq. (21)) scales differently from the limiting Stokes number with Hg/Hd ∝ χvfrag for St ≫ δz. Therefore, comparing two runs where χ was decreased by a factor of 100 is not fully equivalent to comparing two runs where the fragmentation velocity was reduced by a factor of 10, because the settling efficiency is higher in the former case. However, because the settling efficiency is the most impactful factor for the possibility of planetesimal formation, a comparison can be made in that context. This requires the assumption that St ≫ δz, which is fulfilled for large χ ≳ 10, and that the size threshold for planetesimal formation is still met. In such a case, we expect that, if planetesimals can form for a given χ and vfrag = 10 m s−1, they would also form for vfrag = 1 m s−1 if they can form at χ/10 and vfrag = 10 m s−1. In the interest of simplicity, we limited this work to varying χ only, and we considered χ = 10 in the following.
. On the other hand, the settling efficiency described by Hg/Hd (cf. Eq. (21)) scales differently from the limiting Stokes number with Hg/Hd ∝ χvfrag for St ≫ δz. Therefore, comparing two runs where χ was decreased by a factor of 100 is not fully equivalent to comparing two runs where the fragmentation velocity was reduced by a factor of 10, because the settling efficiency is higher in the former case. However, because the settling efficiency is the most impactful factor for the possibility of planetesimal formation, a comparison can be made in that context. This requires the assumption that St ≫ δz, which is fulfilled for large χ ≳ 10, and that the size threshold for planetesimal formation is still met. In such a case, we expect that, if planetesimals can form for a given χ and vfrag = 10 m s−1, they would also form for vfrag = 1 m s−1 if they can form at χ/10 and vfrag = 10 m s−1. In the interest of simplicity, we limited this work to varying χ only, and we considered χ = 10 in the following.
The resulting pebble Stokes number, St1, is shown in Fig. 15, using the same parameters as shown in Fig. 12 but with χ = 10. Here, pebbles are able to reach St1 ≥ 10−2 required to form planetesimals via the streaming instability. The maximal Stokes number is St1 = 3 × 10⁻², which is only reached during the last 10 kyr of the simulation. In this run, mixing of grown grains with the small infalling grains becomes impactful, particularly in the vicinity of r ~ 6 AU. If χ = 100 is used instead, we find that a maximal pebble Stokes number of St1 = 10−1 is already reached after 20 kyr, due to a further reduction of δt, which sets the grain size in the fragmentation limit, which is the smallest one at all times and radial distances in R2.
If dust grains are subject to smaller velocity fluctuations, they can grow to larger sizes. However, radial mixing is reduced, decreasing the effectiveness of the cold finger effect because backward diffusion is less significant and only a smaller fraction of mass is able to cross back to the cold side of the snow line and condense, as detailed in Sect. 4.2. In Fig. 16, the vertically integrated and midplane dust-to-gas ratios are shown for turbulence reduced by a factor of χ = 10. Now, the maximal vertically integrated dust-to-gas ratio is 1 due to the reduced effectiveness of the cold-finger effect, reached at late times during the simulation. Due to more efficient settling (reduced δz) of the now larger grains (reduced δt), the midplane dust-to-gas ratio can reach values up to 10, though. Since both criteria for efficient clumping by the streaming instability are fulfilled in this case, planetesimals can form. As an overestimation of the midplane turbulence based on the core collapse simulation is likely due to poor resolution, we can conclude that planetesimals can form in the class 0/I stage of protoplanetary disks, under the conditions found in the R2 model and given an adjustment of the temperature. They are formed in the area covered by the movement of the snow line, creating a narrow planetesimals surface density profile around ~10 AU in the case of ξ = 5.
The total mass that can be retained in the disk at the snow line due to the cold-finger effect depends on the efficiency of radial mixing and on the location of the snow line, which sets the flux through it. In addition, the average particle size, which is approximately given by the size of the smallest grains, plays a significant role (see Sect. 4.2). In Fig. 17 on the left-hand side, the total mass of planetesimals formed during the simulation is shown as a function of temperature and velocity reduction factor for a monomer size of a0 = 1 μm, which is the one we discussed so far. For ξ < 7, an increase in temperature allows for the formation of planetesimals for lower χ, because a higher temperature promotes dust settling in our model (see Sect. 2.2). At a given ξ, an increase in χ leads to a sharp increase in the planetesimal mass compared to the smallest value that allows formation, but stays constant for even higher χ. For 4 ≤ ξ ≤ 6, the planetesimal mass is slightly diminishing for increasing χ, as the cold-finger effect retains fewer solids for reduced mixing (see Fig. 14). When exceeding temperatures ξ ≳ 6.5, a further increase in ξ requires higher χ for planetesimals to form as the flux of solids through the snow line is reduced. Formation is not possible for ξ < 1.5 (rsnow ~ 2 AU) and ξ > 7.5 (rsnow ~ 17 AU). This trend does not change qualitatively for a smaller monomer size of a0, shown on the right-hand side of Fig. 17, but the total mass of formed planetesimals increases by a factor ~5. Additionally, formation is possible for smaller χ at the extrema of the temperature space.
The total mass of formed planetesimals (see Fig. 17) generally depends on two conditions. First, the effectiveness of the cold-finger effect sets the vertically integrated dust-to-gas ratio, but varies over time as disk conditions evolve. Second, changes in the strength of velocity fluctuations set by δt, δr, and δz over time influence the maximal grain size and settling efficiency, in turn influencing the midplane dust-to-gas ratio. In total, this results in the necessary midplane dust-to-gas ratio for planetesimal formation to only be reached episodically in time. In addition, the location where ε ≥ εmid,crit changes not only due to the movement of the snow line, but also because the radial profile of the δ parameters evolves in time. Figure 18 shows the midplane dust-to-gas ratio for two cases with a more realistic temperature, corresponding to ξ = 5 and ξ = 7, where turbulence is reduced by a factor of χ = 10. The depicted simulations employed a monomer size of a0 = 1 μm. The dependencies on time and radial distance are depicted in the form of a 2D heatmap, where planetesimal formation occurs everywhere a white or red color is seen. With the cold-finger effect being the dominant factor for creating favorable conditions, planetesimal formation occurs just outside the snow line, in a ring of varying width. Compared to ξ = 5, the run with ξ = 7 experiences a smaller solid flux at the snow line location, so that planetesimal formation only occurs during times when settling is very efficient. This results in a lower total mass of planetesimals, as shown in Fig. 17. Furthermore, it can be seen that formation of planetesimals is episodic. This is caused by the fluctuations of the δ parameters in time (see Fig. 8), which not only change the efficiency of settling and the dust grain size, but also the fraction of water vapor that can reach the snow line in the backward diffusion process, which significantly affects the efficiency of the cold-finger effect (see Appendix B). Due to this episodicity, we leave the prediction of further planetesimal formation beyond the run time of the core collapse simulation subject to future work. Therefore, the total mass of formed planetesimals we find in our simulations is only a lower limit, and further formation may be possible at later times during class I or class II.
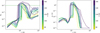 |
Fig. 15 Left: pebble stokes number St1 as a function of radial distance. Right: corresponding particle size at. In this simulation, the temperature was scaled by ξ = 5, and the velocity fluctuations reduced by χ = 10. The line coloring corresponds to the simulation time according to the color bar. A darker color depicts the radial profile at a later time. The dashed lines indicate the value ffStfrag for each time. The horizontal dashed green line shows the limiting Stokes number St1 = 10−2 for planetesimal formation. |
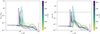 |
Fig. 16 Same as Fig. 12, but the velocity fluctuations experienced by the dust grains were reduced by a factor χ = 10. |
 |
Fig. 17 Total mass of planetesimals present at the end of various simulations. The simulations are based on R2 with several parameter adaptations. On the abscissa, the employed temperature scaling parameter ξ is shown, whereas the ordinate indicates the factor χ by which the velocity fluctuations experienced by the dust grains was reduced. The left panel shows the case of larger dust monomers with size a0 = 1 μm and the right panel the case of a smaller value a0 = 0.1 μm. |
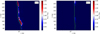 |
Fig. 18 Midplane dust-to-gas ratio as a function of time (ordinate) and space (abscissa). The color map was chosen such that any shade of blue corresponds to a sub-critical value, such that planetesimal formation does not occur, whereas any shade of red corresponds to a super-critical value, creating the opportunity for planetesimal formation. The critical value itself corresponds to a white color. Therefore, all regions of white or red color corresponds to areas and points in time during the simulation where planetesimal formation occurs. Furthermore, the solid green line indicates the position of the snow line. The depicted simulations have the velocity fluctuations reduced by a factor χ = 10 compared to the R2 value, and employ a monomer size of a0 = 1 μm. The left panel presents the case of a temperature scaling of ξ = 5 and the right panel of ξ = 7. |
4.4 Forming planetesimals without the cold-finger effect
For the parameters that were considered up to this point, the cold-finger effect is the dominant process allowing favorable conditions for planetesimal formation to be reached. However, its effectiveness drops sharply for an increased average grain size (see Fig. 14). The smallest grains dominate the size distribution in number, so that their size is dominant in ![$\[\bar{a}\]$](/articles/aa/full_html/2025/04/aa52689-24/aa52689-24-eq71.png) . However, disk processes might affect the abundance and size of small grains, and observational signatures of larger grains are found around young, embedded disks (Galametz et al. 2019; Valdivia et al. 2019; Cacciapuoti et al. 2023). For example, sweep-up processes can create a top-heavy dust distribution (Xu & Armitage 2023). Alternatively, if the bouncing barrier is included in grain size distribution considerations, large grains can efficiently sweep up small grains without replenishment by fragmentation. This results in a narrow grain size distribution with a greatly diminished small grain abundance (Dominik & Dullemond 2024). While a full consideration of the bouncing barrier would prevent planetesimal formation due to a severely reduced maximal grain size, we investigated the impact of a large average grain size on the formation of planetesimals in infall-dominated disks assuming that the maximal grain size is unaffected. We considered the most extreme scenario where small grains are removed efficiently by some disk process, such that the average grain size equals the pebble size,
. However, disk processes might affect the abundance and size of small grains, and observational signatures of larger grains are found around young, embedded disks (Galametz et al. 2019; Valdivia et al. 2019; Cacciapuoti et al. 2023). For example, sweep-up processes can create a top-heavy dust distribution (Xu & Armitage 2023). Alternatively, if the bouncing barrier is included in grain size distribution considerations, large grains can efficiently sweep up small grains without replenishment by fragmentation. This results in a narrow grain size distribution with a greatly diminished small grain abundance (Dominik & Dullemond 2024). While a full consideration of the bouncing barrier would prevent planetesimal formation due to a severely reduced maximal grain size, we investigated the impact of a large average grain size on the formation of planetesimals in infall-dominated disks assuming that the maximal grain size is unaffected. We considered the most extreme scenario where small grains are removed efficiently by some disk process, such that the average grain size equals the pebble size, ![$\[\bar{a}\]$](/articles/aa/full_html/2025/04/aa52689-24/aa52689-24-eq72.png) = a1.
= a1.
Under the same conditions that produce a high total mass of planetesimals for ![$\[\bar{a}\]$](/articles/aa/full_html/2025/04/aa52689-24/aa52689-24-eq73.png) ≈ a0 (ξ = 5, χ = 10), we find that no enrichment of solids beyond the initial value of ε0 occurs, and the cold-finger effect does not operate. The remaining impact of the snow line is to slow down the radial velocity of solids located at r < rsnow, which can aid planetesimal formation if it moves further inside and settling becomes efficient at a location that was previously inside the snow line. This phenomenon poses a less significant contribution to creating favorable conditions than the cold-finger effect, though. Thus, one can consider the scenario described in this section as a case where the cold-finger effect is suppressed during the infall stage of the disk. In fact, we find that, if the cold-finger effect is suppressed, no bulk dust-to-gas ratio enrichment takes place for any temperature scaling ξ. Even when adopting χ = 100 to achieve the highest degree of settling to increase the midplane dust-to-gas ratio, the threshold εmid,crit = 1 is not met for an initial dust-to-gas ratio of ε0 = 0.01. Therefore, we conclude that planetesimal formation cannot occur for ε0 = 0.01 if the cold-finger effect does not operate.
≈ a0 (ξ = 5, χ = 10), we find that no enrichment of solids beyond the initial value of ε0 occurs, and the cold-finger effect does not operate. The remaining impact of the snow line is to slow down the radial velocity of solids located at r < rsnow, which can aid planetesimal formation if it moves further inside and settling becomes efficient at a location that was previously inside the snow line. This phenomenon poses a less significant contribution to creating favorable conditions than the cold-finger effect, though. Thus, one can consider the scenario described in this section as a case where the cold-finger effect is suppressed during the infall stage of the disk. In fact, we find that, if the cold-finger effect is suppressed, no bulk dust-to-gas ratio enrichment takes place for any temperature scaling ξ. Even when adopting χ = 100 to achieve the highest degree of settling to increase the midplane dust-to-gas ratio, the threshold εmid,crit = 1 is not met for an initial dust-to-gas ratio of ε0 = 0.01. Therefore, we conclude that planetesimal formation cannot occur for ε0 = 0.01 if the cold-finger effect does not operate.
4.5 Dependence on the initial dust-to-gas ratio
Previous studies about the dynamics of dust during core collapse indicate the possibility of the formation of protoplanetary disks whose vertically integrated dust-to-gas ratio initially exceeds the interstellar medium (ISM) value of 1% and that are supplied with similarly enriched infalling material (Lebreuilly et al. 2020; Cridland et al. 2022). In these studies, this is caused by the decoupling of dust grains that are ~10 μm in size from the gas during the collapse of the molecular cloud. Therefore, we extend our study to include cases where the initial dust-to-gas ratio, as well as the dust-to-gas ratio of the infalling material, was increased to 0.01 < ε0 ≤ 0.05. Furthermore, we relax the criterion for the midplane dust-to-gas ratio to εmid,crit = 0.5 (Gole et al. 2020). Indeed, we find that simulations where such an increase in ε0 was applied can form planetesimals even in the absence of the cold-finger effect, given that χ = 100 and the disk is not too hot. The final planetesimal mass formed under these conditions is shown in Fig. 19 as a function of ξ and initial metallicity ε0. It can be seen that Mpltm,tot ~ 10−4 M⊙ is reached for ε0 = 0.03 for the most optimal temperature of ξ ~ 3.5. In the more optimistic case of even further increased ε0, the final mass is further increased accordingly. For ξ ≳ 5.5, the planetesimal mass drops sharply and continues to drop for even higher ξ. For ξ ≳ 8, planetesimal formation no longer occurs.
The reason why the mass of formed planetesimals drops sharply for ξ ≳ 5.5 can be understood by considering the times and locations where the critical midplane dust-to-gas ratio is reached, shown in Fig. 20 for ε0 = 0.05. The case of a cold (ξ = 1) and hot (ξ = 7) disk is presented. In the absence of the snow line in the simulation grid, a dust-to-gas ratio sufficient for the formation of planetesimals is reached at certain radial distances for some periods of time. Reaching the critical dust-to-gas ratio is not linked to the enrichment of solids at that location; rather, they are location where settling is sufficiently efficient. In fact, unlike the case where the cold-finger effect operates (see Fig. 13), we find that infalling solids are not retained in the disk, and the total mass of solids does not increase, keeping the total solid-to-gas ratio at approximately the same order of magnitude, only decreasing in time due to locking of solids in planetesimals.
Settling being sufficient to reach the conditions for planetesimal formation without any enrichment of the vertically integrated dust-to-gas ratio is only possible because the initial ε0 is already high, while the critical dust-to-gas ratio is low. The regions where planetesimal formation is possible are therefore only set by the time and radial profiles of the δ parameters. However, strong settling is only possible outside the snow line, as grains are too small due to the high fragility of silicate grains inside the snow line. Thus, if the disk temperature is increased to the point where formation locations set by the δ parameters are inside the snow line, conditions are less favorable for planetesimal formation, as is seen in Fig. 20. This causes the order-of-magnitude difference in final planetesimal mass for high temperatures in Fig. 19. Therefore, the scenario most favorable for the early onset of planetesimal formation is a combination of the two cases discussed in the previous sections, which is presented in Appendix C.
In reality, the high dust-to-gas ratio of the infall is not maintained for the entire 100 kyr after disk formation, as the reservoir of dust from the natal molecular cloud that is able to reach the disk is eventually exhausted. A drop in infall dust-to-gas ratio is expected to occur earlier for higher ε0. The reason for this is that the enrichment is caused by an increased dust flux, which naturally leads to a faster depletion of the available mass. Consequently, planetesimal formation occurring later in a simulation with high ε0 as indicated in Fig. 20 should be treated with caution, and a more realistic scenario is described by the combination of a high ε0 case at early times with a lower ε0 case toward the end of the simulation. We did not perform such combinations here in the interest of simplicity.
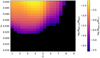 |
Fig. 19 Same as Fig. 17, but with changed model assumptions. Here, the case of |
![$\[\bar{a}\]$](/articles/aa/full_html/2025/04/aa52689-24/aa52689-24-eq74.png)
5 Dependence on core collapse initial conditions
In previous sections, all considerations were made for one specific core collapse simulation, albeit for a family of parameters χ, ξ, and ε0. In order to also consider the impact of different core collapse initial conditions, two additional models from H20 were considered: R1 and R7. Compared to the canonical run R2, R1 has a lower ratio of rotational to gravitational energy βrot = 0.01 compared to βrot = 0.04. On the other hand, R7 has the same value of βrot as R2, but the initial angle between the magnetic field and the rotation axis is θ = 90°, while that angle is 30° for R2. In addition, the total simulation runtime differs. Compared to trun = 82.7 kyr of R2, the runtime of R1 is trun = 107.3 kyr, and the runtime of R7 is shorter with only trun = 27.1 kyr. The changes of the initial conditions of the core collapse simulations are reflected in the change of the corresponding 1D model parameters. We briefly present the profiles of the parameters most impactful to planetesimal formation in this section. Profiles of quantities not discussed here can be found in Appendix D.
In Fig. 21, a comparison of ![$\[\dot{\Sigma}_{\text {gas}}\]$](/articles/aa/full_html/2025/04/aa52689-24/aa52689-24-eq75.png) and
and ![$\[\dot{M}_{\text {gas}}\]$](/articles/aa/full_html/2025/04/aa52689-24/aa52689-24-eq76.png) between R1 and R7 is shown. The total infall rate onto the disk is of the same order of magnitude for all three core collapse simulations, because it is dominated by the strong infall onto the inner disk region, which is in turn set by the sink particle accretion. The radial profile outside the sink particle accretion-dominated area is affected by the choice of the initial core collapse conditions, though. It is especially noticeable that the infall rate drops much more sharply with radius for R1 than for the other cases. This is related to a similarly sharp drop in αEA for R1, especially at late times, as presented in Fig. 22. On the other hand, the change in θ between R2 and R7 seems to have a less significant impact on the 1D model parameters. However, it remains to be investigated whether this also holds true at later times.
between R1 and R7 is shown. The total infall rate onto the disk is of the same order of magnitude for all three core collapse simulations, because it is dominated by the strong infall onto the inner disk region, which is in turn set by the sink particle accretion. The radial profile outside the sink particle accretion-dominated area is affected by the choice of the initial core collapse conditions, though. It is especially noticeable that the infall rate drops much more sharply with radius for R1 than for the other cases. This is related to a similarly sharp drop in αEA for R1, especially at late times, as presented in Fig. 22. On the other hand, the change in θ between R2 and R7 seems to have a less significant impact on the 1D model parameters. However, it remains to be investigated whether this also holds true at later times.
A change in core collapse initial conditions also has an impact on the three parameters, δr, δz, and δt, related to the mean velocity fluctuations in the gas. We find that, despite the sharp drop-off of the infall profile of R1 compared to R2, the vertical mixing strength does not decline to the same extent. While δz reaches values as low as δz ~ 10−3 in R2, it does generally not drop below δz ~ 10−1 in R1, except toward the end of the simulation. Similarly, δt does not drop below δt ~ 10−1 in R1, whereas values of a few 10−2 are reached in R2. In contrast, in R7, the radial diffusion parameter is much larger than in R2, generally increasing with radial distance and reaching values close to 1 within the disk region, but δz and δt exhibit values generally similar to R2. This mismatch is unexpected, as the main driver of the mixing is the infalling mass, so that the mass infall rate and mixing parameters should be related. While the difference in disk size, and therefore the difference in the ratio between infalling and disk mass may contribute to this mismatch, a detailed analysis of the origin of mixing in young class 0/I disks and its relation to mass inflow require a substantially higher resolution and remain subject to future work. Detailed profiles of these parameters are shown in Appendix D.
Naturally, the change of parameters describing the disk in our 1D model impacts the possibility of planetesimal formation and, if applicable, the total mass of planetesimals formed. We note that, due to a difference in total run time of the corresponding core collapse simulations, the total mass of formed planetesimals is not directly comparable between them. In Fig. 23, we present the two scenarios considered for R2 in the previous sections for R1 and R7 each. The panels on the left-hand side present the scenario of Sect. 4.3, where the cold-finger effect is effective in retaining solids in the disk, but the initial solid-to-gas ratio corresponds to the ISM value of 1%. For both R1 and R7, only runs with χ > 10 and ξ > 1 are able to produce planetesimals. In the case of R7, runs with disks as hot as ξ = 6.5 produce planetesimals, whereas ξ ≤ 4 is required for R1. The most optimal parameter configuration results in a total mass of formed planetesimals of ~10−3 M⊙ for R1. On the other hand, for R7, planetesimals with a total mass just below Mpltm,tot ~ 10−2 M⊙ may be formed. The right-hand side corresponds to the scenario where the cold-finger effect is not effective, as discussed in Sects. 4.4 and 4.5. In that case, conditions are generally not favorable for the streaming instability to facilitate planetesimal formation for R1, with only a small set of configurations with 5 ≤ ξ ≤ 6.5 and a high initial dust-to-gas ratio of ε0 > 0.045 forming planetesimals. In contrast, R7 is more comparable to R2 regarding what parameter sets allow for the formation of planetesimals. Here, ε0 ≥ 0.03 allows for planetesimal formation. The highest total mass is produced for 3 ≤ ξ ≤ 5, with Mpltm,tot ~ 10−5 M⊙ over the short run time of R7 for ε0 = 0.05. In summary, velocity fluctuations have to be reduced more for R1 and R7 compared to R2 to reach favorable conditions if small grains are present for evaporation and condensation. The disk produced in the R1 MHD simulation is not favorable for planetesimal formation if the cold-finger effect is not effective in increasing the local dust-to-gas ratio at the snow line. Like R2, no runs based on the disks found in R1 and R7 lead to planetesimal formation if the cold-finger effect does not operate and ε0 = 0.01.
Finally, Fig. 24 shows the midplane dust-to-gas ratio for the two aforementioned scenarios for core collapse simulations R1 and R7. The left-hand side shows the temperature that leads to the highest total mass of planetesimals for both R1 and R7, ξ = 3. The right-hand side of Fig. 24 employs ξ = 5, as this is the best-case temperature for the scenario of an absent cold-finger effect. The qualitative behavior is the same as already discussed in Sect. 4.5. However, it can be seen that conditions for planetesimal formation are only met very briefly in the ![$\[\bar{a}\]$](/articles/aa/full_html/2025/04/aa52689-24/aa52689-24-eq80.png) ≈ 1 μm case for R1. Furthermore, for the
≈ 1 μm case for R1. Furthermore, for the ![$\[\bar{a}\]$](/articles/aa/full_html/2025/04/aa52689-24/aa52689-24-eq81.png) = a1 case, the regions where planetesimal formation is possible due to efficient settling are different compared to R2, which is mainly caused by the change in the dependence of δz on time and radial distance for those two simulations. In particular, δz found in R1 is much higher on average than in the other cases (see Fig. D.4), so that planetesimal formation solely caused by settling is achieved only for brief times.
= a1 case, the regions where planetesimal formation is possible due to efficient settling are different compared to R2, which is mainly caused by the change in the dependence of δz on time and radial distance for those two simulations. In particular, δz found in R1 is much higher on average than in the other cases (see Fig. D.4), so that planetesimal formation solely caused by settling is achieved only for brief times.
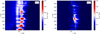 |
Fig. 20 Same as Fig. 18, but for different model assumptions. Here, we assume the absence of small grains for phase transition purposes, i.e., |
![$\[\bar{a}\]$](/articles/aa/full_html/2025/04/aa52689-24/aa52689-24-eq77.png)
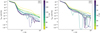 |
Fig. 21 Same as the left panel of Fig. 6, but for the core collapse simulations R1 (left panel) and R7 (right panel) of H20 instead. |
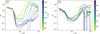 |
Fig. 22 Same as the right panel of Fig. 7, but for the core collapse simulations R1 (left panel) and R7 (right panel) of H20 instead. |
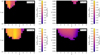 |
Fig. 23 Total mass of formed planetesimals at the end of the simulation for runs based on the core collapse simulations R1 (top row) and R7 (bottom row). Panels on the left-hand side correspond to Fig. 17 for R2, showing the mass for fixed ε0 = 0.01 and |
![$\[\bar{a}\]$](/articles/aa/full_html/2025/04/aa52689-24/aa52689-24-eq78.png)
![$\[\bar{a}\]$](/articles/aa/full_html/2025/04/aa52689-24/aa52689-24-eq79.png)
6 Dependence on the planetesimal formation criterion
Up to this point, we have considered the simple criterion by Drążkowska & Alibert (2017) to determine whether planetesimals can form under the conditions present at any given location in the simulated domain. Here, the effect of turbulence on the strength of clumping achievable through the streaming instability is only considered indirectly through a requirement on the midplane dust-to-gas ratio ε, which is reduced by the turbulenceinduced vertical mixing. However, recent works on the streaming instability in an environment with external turbulence highlight the importance of considering it for the study of the degree of clumping that is believed to facilitate planetesimal formation.
On the one hand, a turbulent environment has been shown to limit the growth rates of the streaming instability (Umurhan et al. 2020) and the clumping efficiency (Lim et al. 2024). Even if significant clumping occurs, turbulent diffusion might impact the gravitational collapse of the clumps into planetesimals (Gerbig et al. 2020; Gerbig & Li 2023). Given the high degree of mixing induced by strong velocity fluctuations that are found in the H20 simulations, reflected by the large magnitude of the parameters δr, δr and δt (see Fig. 8), these findings might imply that that mass of plantesimals that form is overestimated in our model, especially at low turbulent reduction factors χ. On the other hand, turbulence can also aid particle concentration and thereby aid the planetesimal formation process. So-called zonal flows have been found to be produced by the MRI (Johansen et al. 2007; Simon & Armitage 2014), which can lead to dust enhancements that are significant enough to trigger planetesimal formation (e.g., Xu & Bai 2022). Similar findings have been obtained for the Vertical Shear Instability (VSI) (Schäfer & Johansen 2022). Furthermore, turbulent clustering can lead to planetesimal formation (Hartlep & Cuzzi 2020).
To investigate the impact of external turbulence on our model, we considered a planetesimal formation criterion by Lim et al. (2024) in this section. They consider a 3D stratified shearing box with turbulent forcing and derive a criterion for strong clumping based on the midplane dust-to-gas ratio ε and the bulk dust-to-gas ratio Σd/Σg,
![$\[\log \epsilon_{\text {crit }} \simeq A\left(\log \tau_s\right)^2+B ~\log~ \tau_s+C,\]$](/articles/aa/full_html/2025/04/aa52689-24/aa52689-24-eq84.png) (42)
(42)
![$\[\begin{aligned}\log \left(\Sigma_d / \Sigma_g\right)_{\mathrm{crit}} \simeq & A^{\prime}\left(\log~ \delta_t\right)^2+B^{\prime} ~\log~ \tau_s ~\log~ \delta_t \\& +C^{\prime} ~\log~ \tau_s+D^{\prime} ~\log~ \delta_t,\end{aligned}\]$](/articles/aa/full_html/2025/04/aa52689-24/aa52689-24-eq85.png) (43)
(43)
![$\[\begin{aligned}A & =0.42, B=0.72, C=0.37 \\A^{\prime} & =0.15, B^{\prime}=-0.24, C^{\prime}=-1.48, D^{\prime}=1.18.\end{aligned}\]$](/articles/aa/full_html/2025/04/aa52689-24/aa52689-24-eq86.png)
We applied this criterion to the setup discussed in Sect. 4.3; that is, where the cold-finger effect leads to a significant accumulation of solids just outside the snow line due to the choice of small monomer sizes, a0 = 1 μm and a0 = 0.1 μm, with disk parameter profiles based on the R2 run of H20. Again, we investigated the total mass of formed planetesimals as a function of the temperature scaling factor ξ and the turbulence reduction factor χ. The results are shown in Fig. 25.
For the larger monomer size of a0 = 1 μm, the difference to the model shown in Fig. 17 is not highly significant. When employing the Lim et al. (2024) criterion, planetesimal formation is suppressed for comparatively lower temperature factors ξ, even at high χ. Runs with χ ≈ 10 exhibit a total mass of planetesimals that is slightly lower than for the other criterion, but it is of the same order of magnitude. However, at ξ ≈ 5, even runs with more turbulent conditions form planetesimals, down to χ = 2 compared to the previous case of χ = 5. For the smaller monomer size of a0 = 0.1 μm, the difference to the other criterion is more substantial. More parameter sets form planetesimals with a total mass of Mpltm > 10−2 M⊙, and planetesimals can form even in runs with no turbulence reduction, χ = 1, for 4 ≤ ξ ≤ 6.
A small reduction in the total mass of planetesimals for runs with χ ≈ 10 is expected due to restrictions on Σd/Σg that were not previously considered. However, these results also show that, even though the criterion by Lim et al. (2024) introduces more restrictive limits on planetesimal formation in a turbulent environment, employing it results in an overall increase in planetesimal formation capabilities, especially for a0 = 0.1 μm. This is due to the fact that the criterion by Drążkowska & Alibert (2017) is more restrictive on the size of the dust grains, strictly requiring St > 0.01, which excludes runs with small χ. On the other hand, small dust grains can still be clumped strongly as long as Σd/Σg is large enough according to Eq. (43). More turbulent runs and a smaller monomer size both imply a higher cold-finger effect efficiency, resulting in high values of Σd/Σg and planetesimal formation in previously excluded runs. Despite this, we note that there are two important caveats to consider when interpreting these results. First, even though runs with a highly efficient cold-finger effect have Σd/Σg ≫ 1, we neglected dust back-reaction and the fact that dust self-gravity will impact the scale height, so that Eq. (21) is no longer valid. Second, even though strong clumping by the streaming instability has been found to occur also for St < 0.01 (Carrera et al. 2015; Yang et al. 2017; Li & Youdin 2021) given a high enough value for Σd/Σg, the smallest Stokes number data point considered by Lim et al. (2024) is St = 0.01. Because their criterion is based on a fit, it remains to be confirmed whether it also holds true for St < 0.01.
We note that, if the cold-finger effect does not operate, as described in Sect. 4.4, there is no mechanism that could provide an enhancement in the bulk dust-to-gas ratio, so that (Σd/Σg)crit (cf. Eq. (43)) is never reached. Therefore, if turbulence is considered as being detrimental to the clumping of dust and subsequent planetesimal formation, planetesimals cannot form through settling alone in our model, and the efficient operation of the cold-finger effect is a necessity. Furthermore, even though we assumed that planetesimals form once the criterion for strong clumping is met, the dust clumps may be prevented from collapsing gravitationally due to the turbulence and thus planetesimals may not form.
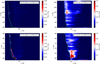 |
Fig. 24 Midplane dust-to-gas ratio as a function of time (ordinate) and space (abscissa). The color map was chosen like in Fig. 18, with the solid green line indicating the position of the snow line. The top row shows simulations based on the R1 core collapse simulation and the bottom row shows simulations based on R7. Panels on the left-hand side present simulations with |
![$\[\bar{a}\]$](/articles/aa/full_html/2025/04/aa52689-24/aa52689-24-eq82.png)
![$\[\bar{a}\]$](/articles/aa/full_html/2025/04/aa52689-24/aa52689-24-eq83.png)
 |
Fig. 25 Same as Fig. 16, but employing the planetesimal formation criterion by Lim et al. (2024) (see Eqs. (42), (43)) instead. |
7 Discussion
7.1 Implications for planet formation
Early planetesimal formation in infall-dominated disks has an impact on the initial conditions for planet formation. If a standard class-II centric view is employed, the initially present mass of solids is first used for the formation of planetesimals, which occurs at disk locations where drifting pebbles are trapped. In the core accretion scenario, these planetesimals then become the seeds for the rapid accretion of pebble-sized solids to eventually form giant planets. However, once planetesimals have formed from solids that have drifted and been trapped from outer disk regions, it is unclear how much solid mass can remain to serve as accretion material in the core accretion scenario. While rapid in-place accretion of left-over pebbles at the planetesimal formation site can offer an explanation (Jiang & Ormel 2023) in that case, there is no lack of solids in the outer disk if planetesimals already form during the infall stage. As is shown in Fig. 13, planetesimals are not formed from solids that were initially present in outer disk regions, but rather from accreted material that was retained in the disk by the cold-finger effect. Therefore, they are still readily available in the outer disk to serve as accretion material in the core accretion scenario likely taking place in later stages where infall has largely subsided.
In fact, ~10−3 M⊙ ≈ 3 × 10² M⊕ of planetesimals may form during the 100 kyr considered in this work (see Fig. 17), while still leaving ~3 × 10³ M⊕ of dust in the disk (see Fig. 13). This is up to 10% of the disk mass in planetesimal bodies formed via the streaming instability, which is believed to form objects 10–100 km in size (Simon et al. 2016; Schäfer et al. 2017; Klahr & Schreiber 2020). Objects of this size are not affected by gas drag and can therefore remain in the disk to serve as the initial condition for subsequent evolution. Assuming that planets grow by accreting pebbles (Ormel & Klahr 2010; Lambrechts & Johansen 2012) and a high accretion efficiency of ~10% (Ormel 2017), planetary cores with a total mass of up to ~600 M⊕ may be formed, greatly exceeding the total mass of the cores of the giant planets in the Solar System and the ~20–30 M⊕ planetesimal population that is believed to have evolved into the Kuiper Belt (Tsiganis et al. 2005). However, these values have a strong dependence on the choice of temperature scaling factor ξ and the reduction of velocity fluctuations by χ. For a less ideal choice of parameters, only ~3 M⊕ of planetesimals may form, and the cold-finger effect may not be effective at retaining infalling solids, leaving as little as ~70 M⊕ of solids available to be accreted as pebbles. In such a case, the existence of the Solar System and giant exoplanets cannot be explained by our model.
However, population studies focusing on the class II evolutionary stage exhibit an apparent population-wide increase in the dust mass found in the disks between 0.5–1 Myr and 2 Myr (Testi et al. 2022). This can be explained by the formation of a secondary generation of dust though fragmentation during planetesimal-planetesimal collisions, which requires the early formation of planets that dynamically excite the planetesimal population. Notably, the dust increase observed by Testi et al. (2022) is consistent with fast planetesimal formation followed by core formation at ages <500 kyr (Bernabò et al. 2022). This scenario matches well with our findings of fast and efficient planetesimal formation, given a favorable choice of parameters.
7.2 Comparison to observational findings
Observations of dust emission in protoplanetary disks suggest an early occurrence of substructure related to planet formation. In particular, the extensively studied disk of HL Tau (ALMA Partnership 2015) shows an abundance of rings while still being embedded in a remnant envelope. The same holds true for Oph IRS 63, where multiple rings have been observed (Segura-Cox et al. 2020). In addition, the recent ALMA Large Program “eDisk” (Ohashi et al. 2023) is focused specifically on the detection of substructure of young, embedded disks, observing 12 class 0 and 7 class I sources. They find that substructures like rings and spirals are absent from the class 0 sources, but not from all class I sources. If there are truly no substructures in class 0 disks, in other words if they are not obscured by the high optical depth of the emission, they need to start forming during the transition between the class 0 and I stage. This relates with our findings that planetesimals start forming only at later times, when infall induced velocity fluctuations diminish and conditions become favorable for settling. As the ages of class I sources with observed substructures are a few 100 kyr, the planetesimals formed during the 100 kyr in the simulations presented here can serve as the building blocks for the first planetary cores that can carve structures such as a gap, which strengthens the idea of an early onset of planet formation further.
Observations find indications of high temperatures at disk scales for young solar-type protostars. In several of these young disks, the dust brightness temperatures reach values of a few hundreds of Kelvin in the inner 20 AU (van’t Hoff et al. 2018; Zamponi et al. 2021; van’t Hoff et al. 2024), while the observation of hot corinos suggest the water snow-lines could be located at radii as large as ~100 AU, beyond the disk boundary (Belloche et al. 2020). Resolved observations of complex organic molecules (COMs) have shown a dependency between the spatial extent of the COMs and their excitation temperatures (Maury et al. 2014), in agreement with expectations from thermal desorption in a warm medium (Busch et al. 2022). The dust temperatures measured in these young disks are not consistent with the sole passive heating, however, and suggests the presence of accretion or viscous heating (Maureira et al. 2022; Takakuwa et al. 2024). Neither of these heating sources are accounted for in the H20 simulations, which may explain the fact that the disks that arise in these simulations are colder than what observations suggest (see Fig. 5). However, the impact of accretion heating is uncertain, so that theoretical modeling of the disk temperature in young disks remains challenging (Hennebelle et al. 2020a; Lebreuilly et al. 2024). We take the uncertainty of the disk temperature into account by introducing a temperature scaling factor ξ. Obtaining better constraints for the accretion luminosity in the future would, in turn, place constraints on this factor from the theoretical side.
These observational findings regarding the temperature are matched by our ξ = 9 model in order of magnitude, where the snow line is located at ~100 AU (see Fig. 11), which is beyond the disk boundary located at ~20 AU. For a disk of this temperature, our model implies that planetesimal formation does not occur. The reason for this is that the cold-finger effect cannot lead to a dust-to-gas ratio enhancement if the snow line is not located in the disk, as shown in Fig. 17, and silicate grains are too fragile to grow to sizes where settling alone can trigger the streaming instability even for high metallicity, as shown in Fig. 19. Conversely, high-resolution observations of HL Tau reveal a significant reservoir of water vapor, where the lower mass limit is estimated to be ~7.8 × 10⁻⁴ M⊕ (Facchini et al. 2024). These observations suggest an upper limit to the snow line location of ~17 AU, which approximately matches the location found in our ξ = 7 model. While detailed models of the snow line in HL Tau do not exist at the moment, it being at a radial distance that is favorable for planetesimal formation is plausible given these constraints. Consequently, even if young disks are too hot initially to form planetesimals, they could cool down to favorable conditions within the time frame considered in our model.
The typical mass accretion rates for solar-type class I protostars, when measured at disk scales using infrared spectroscopy, are highly uncertain, but are typically found to be on the order of a few ~10−7 solar masses per year at most (Fiorellino et al. 2021). However, the mass infall rates measured for the gas infalling from the envelope to the disk scales are usually an order of magnitude larger, which is in line with the values found in our model (see Fig. 6). Our model indicates that the infalling mass is advected toward the central star rapidly, which is in agreement with higher resolution models, where infalling gas is accreted onto the star through an accretion channel at several pressure scale heights (Lee et al. 2021). However, this is caused by the lack of angular momentum of the infalling gas, which is caused by magnetic braking in the envelope. If the braking was weaker, the gas may be retained in the disk, and the high infall rate could suggest that these young disks grow in mass. This could lead to the development of favorable conditions for planetesimal formation in the form of a very optically thick midplane where temperatures could be much lower than the ones measured from the millimeter dust continuum emission, so that the snow line would be located inside the disk. On the other hand, such mass loading could also suggest that most disks quickly become too massive and thus gravitationally unstable.
7.3 Potential role of other chemical species
Our work only considers the water snow line as a potential site of solid enrichment due to the cold-finger effect. In principle, including additional chemical species and their evaporation and condensation could create secondary solid enhancements at the location of their evaporation fronts. The impact on the midplane dust-to-gas ratio enhancement is then limited by two aspects.
First, the cold-finger effect retains part of the fraction of the dust mass that is made of the respective chemical species. Therefore, solid enhancement is only significant for species with an abundance comparable to water. From an observation perspective, the abundances of volatile molecules in young disks are not well constrained and are influenced by a complex interplay of physical and astrochemical processes in class II disks (for reviews, see Öberg & Bergin 2021; Öberg et al. 2023). Only recently has the James Webb Space Telescope (JWST) opened a new window into the ice inventory of these disks. In addition to H2O, the main volatile carbon carriers, CO and CO2, have been systematically observed in the ice phase of edge-on disks for the first time (e.g., Sturm et al. 2023). However, uncertainties remain regarding the implications of these measurements. For instance, Bergner et al. (2024) suggest that CO could survive in the ice phase even within its snowline, due to its trapping in H2O and CO2 ices. We can gain some insights by assuming that the molecular composition of class II disks is inherited from the earliest phases of star formation, in the so-called inheritance scenario. The composition of the protostellar envelope and the stellar abundance after disk dissipation are not identical, as the stellar composition is altered by the accretion of disk material during the disk’s lifetime. However, this effect is only minor (Hühn & Bitsch 2023). Various astrochemical models (e.g., Eistrup et al. 2016; Öberg & Wordsworth 2019) and observations of ices in the envelopes of low-mass YSOs (e.g., Boogert et al. 2015) predict similar CO and CO2 abundances in disks under the assumption of chemical inheritance. On average, these abundances are only about a factor of 4 lower than that of H2O, so that an enhancement of the dust-to-gas ratio due to the cold-finger effect operating at the respective snow lines may be non-negligible. We note that the chemical composition of gas and ices in disks can vary throughout the system’s evolutionary history, for instance, due to episodic accretion events, which can result in a total or partial reset of the chemistry (e.g., Eistrup et al. 2016), with significant implications for planet formation (Pacetti et al. 2022). Additionally, the relative abundances of chemical species vary across stars of different metallicities (Bitsch & Battistini 2020). Addressing the impact of these effects, and exploring alternative scenarios to chemical inheritance, requires a dedicated investigation.
Second, the resulting solid enhancement depends on the location of the corresponding evaporation front, and the solid flux through that location. Depending on the assumed density and binding energy in mixed ices, the condensation temperature for CO is between 17 and 30 K (Miotello et al. 2023). Therefore, for disk temperatures that allow for the formation of planetesimals at the water snow line, the CO snowline would fall outside the disk. However, CO could play a role in colder disks, where the water snow line lies at a radial distance smaller than the inner edge of our simulation grid. The same applies to other highly volatile species, such as N2 and O2, which have similar condensation temperatures. For CO2 on the other hand, the snow line may be located in warmer regions, situated between those of H2O and CO. For example, Eistrup et al. (2016) indicate condensation temperatures of 88 K for CO2, while Zhang et al. (2015) calculate temperatures ranging from 60 K to 72 K for CO2. This means that it could lie inside the disk and our computational domain in the cold case of ξ = 1 and the case of a temperature better suited for the formation of planetesimals at the water snow line, like ξ = 5 (see Fig. 17). In the case of a warm disk like the one described by ξ = 5, the solid flux through the corresponding snow line may be too low for considerable solid enhancement, though.
Volatile species may not be the only candidate for a cold-finger-like effect. For the Solar System, it is found that comets and the ISM are more enriched in carbonaceous material than the rocky bodies in the inner Solar System. Consequently, it has been suggested that this carbonaceous material must have returned to the gas phase within the so-called soot line (van’t Hoff et al. 2020, 2024, see also review by Pontoppidan et al. 2014). While the exact composition, and thereby the condensation temperature, of this material is still under investigation, recent studies indicate that the soot line is located within the water snowline, between 300 and 400 K (e.g., Gail & Trieloff 2017). If young, embedded disks are very hot, evaporation and subsequent condensation at the soot line could provide a solid enhancement and lead to planetesimal formation similar to the cold-finger effect at the snow line. Unlike the planetesimals formed at the water snow line, which are potentially very water-rich if formed through the cold-finger effect, these planetesimals would then be enriched in carbonaceous material.
7.4 Core collapse simulation caveats
The core collapse simulations performed by H20 integrating nonideal magnetohydrodynamics are computationally expensive and were designed to investigate global properties of protoplanetary disks. While the adaptive mesh refinement they employed produces a highly resolved disk region when compared to the unrefined cell size of 256 AU, a resolution of 1 AU introduces challenges when one is concerned with more detailed models of quantities that are not of global nature, but vary across the disk. The resolution cannot be considered sufficient for a detailed study of planet formation.
The resolution is too low to resolve the injection scale of the MRI, which is one of the typical sources of turbulence considered in the literature and leads to outward angular momentum transport in class II disks, corresponding to a positive value for αSS (for a review, see Lesur et al. 2023). Due to the absence of this instability, the velocity fluctuations that contribute to the Reynolds part of αSS arising in the disks are a combination of the accretion shock and high numerical viscosity introduced by the large Cartesian grid cells. At higher resolution, there is a possibility that the MRI would cause turbulence ultimately leading to a positive value of αSS, differently from what we find at the current resolution. Higher resolution simulations of core collapse have been performed by Mauxion et al. (2024), reaching a radial resolution as low as 10−2 AU and a vertical resolution of 10 cells per scale height at the inner boundary. Employing a lower mass-to-flux ratio than H20, but a lower rotational over gravitational energy ratio, they initially find the same very vigorous infall of ~10−5 M⊙ yr−1 onto a small disk with a radial extent of ~10 AU. This infalling material is also deficient in angular momentum and is advected to the star in the upper disk layers. However, they find the dynamics in the bulk of the disk to be dominated by gravitational instability removing angular momentum at small radii. Additionally, they observe a second phase in the disk evolution, where the disk expands in size by an order of magnitude due to the accretion of material with high specific angular momentum, and gravitational instability seizes. Therefore, studies should be conducted in the future, aimed at providing a better and more comprehensive understanding of the early dynamics of protoplanetary disks, depending on the initial conditions of the natal cloud.
Moreover, because the central star itself cannot be resolved at such a resolution, a sink particle has to be used. As a consequence, disk quantities do not capture accurate physics within the sink particle accretion radius of 4 AU, so that we cannot extend our investigation to the inner disk regions. The effects of the sink particle are not limited to the inner disk, though. The specifics of the employed accretion model affect global properties of the disk like total mass and cutoff radius (Hennebelle et al. 2020b). Furthermore, with the gas pressure scale height being barely resolved, no distinction can be made between the dynamics in the disk midplane, where planetesimal formation takes place, and the upper layers mostly affected by the accreted material. However, this distinction might be crucial for the consideration of vertical mixing and maximal dust grain sizes, which is only approximated here by introducing a reduction factor χ to the velocity fluctuations felt by the dust. Additionally, the snow line is not located at a constant radius if a vertical temperature gradient is considered. Magnetically braked material entering the disk and being rapidly advected would do so at the upper disk layers. Therefore, it evaporates its ice mantle and is subject to the cold-finger effect at a different radial distance than material being accreted through the disk midplane, where radial speeds could be much lower, reducing the efficiency of the cold-finger effect. This affects the relationship between the temperature scaling parameter ξ and the location where solid enrichment can occur.
The runtime of our 1D simulations is limited to the runtime of the core collapse simulations, which is short compared to the lifespan of a protoplanetary disk. This limits the evolutionary stages we can apply our model to. In particular, we cannot investigate the possibility and efficiency of planetesimal formation in older class I disks, which would be characterized by a decrease in the infall rate. A decrease in the infall rate would, in turn, create more favorable conditions due to smaller velocity fluctuations allowing dust grains to grow larger and settle more efficiently. A treatment of disks during this evolutionary stage requires extrapolating the mass infall rate and the angular momentum of the infalling mass for an accurate description of ![$\[\dot{\Sigma}_{\text {ext}}\]$](/articles/aa/full_html/2025/04/aa52689-24/aa52689-24-eq87.png) and αEA. Furthermore, the time evolution of αSS would need to be considered as it plays a more significant role for older disks. This is subject to future work.
and αEA. Furthermore, the time evolution of αSS would need to be considered as it plays a more significant role for older disks. This is subject to future work.
Lastly, the core collapse simulation themselves employed model assumptions that rely on poorly constrained parameters. The main uncertainties are related to the magnitude of the accretion luminosity; that is, the fraction of gravitational energy that is radiated away and contributes to that luminosity (e.g., Kenyon & Hartmann 1995; Evans et al. 2009). It has large effects on the disk temperature, structure and gravitational stability (Krumholz et al. 2007; Offner et al. 2009; Lebreuilly et al. 2024). The dust grain size distribution during the collapse is also crucial as it greatly influences Ohmic resistivities, but dust was not included in the simulation itself. Growth processes can alter the grain size distribution during the collapse (Lebreuilly et al. 2023; Vallucci-Goy et al. 2024), which a full treatment of nonideal MHD would need to consider. However, the impact of growth on the dust size distribution in the envelope is still highly debated (Guillet et al. 2020; Bate 2022; Silsbee et al. 2022).
7.5 1D model caveats
In the interest of simplicity and computational feasibility, we use a simplified treatment to consider the dust evolution and potentially resulting planetesimal formation. Our model did not contain direct treatment of the magnetic field, and we only included its effects on dust evolution through the calculation of the model parameters αEA,SS. While the impact is likely minor, this neglects a component in the force balance relating to the azimuthal gas velocity, which sets the drift speed of the dust and can create dust traps. On the timescales investigated here, dust drift does not play a significant role, but it could be enhanced in the magnetically supported region directly exterior to the Keplerian disk due to the slower rotation speed of gas in this region. This could result in an accumulation of dust. We do not consider this effect here.
Our dust model considered only the radial dimension, so that vortices and spirals that can serve as dust traps could not be modeled. Spirals are a phenomenon found in marginally stable, self-gravitating disks that might present an alternative pathway to planetesimal formation in class 0/I protoplanetary disks and their growth (Rice et al. 2004). However, their consideration would require a 2D treatment and more detailed modeling of dust growth and evolution. In fact, Bhandare et al. (2024) find, using a 2D treatment, that meridional flows can retain and efficiently mix dust grains in the inner disk regions and the outer disk edge. Additionally, outflows can transport dust up to 100 μm in size from the inner to the outer disk. Furthermore, the limit created by the necessity for gravitationally stable disks prevents us from extending our study to a wider range of core collapse initial conditions. In particular, we could not extend our study to simulations with a higher initial mass-to-flux ratio, because the disks produced in such simulations are generally not stable against self-gravity. However, a higher mass-to-flux ratio impacts the angular momentum of infalling material as magnetic braking is less severe, which may have an impact on the possibility and efficiency of planetesimal formation.
Ultimately, how representative gravitationally stable class 0/I disks are of a general sample is an open question that has also not been answered definitively by observations. Indications of gravitational instability have been found in the late class I disk around HL Tau (Booth & Ilee 2020), and surveys suggest that young disks are massive and compact (Tychoniec et al. 2018; Maury et al. 2019). Despite that, while some structures have been observed in some class I disks (Segura-Cox et al. 2020; Ohashi et al. 2023) that suggest the existence of potential instabilities to create such dust features, the examples are very scarce and most young disks are featureless at the spatial resolution we can observe. This may suggest that gravitational instability is not a ubiquitous phenomenon. Moreover, most protostellar disk masses inferred from observations are very poorly constrained, as the dust properties are oversimplified or unknown (e.g., the size distribution, see Lebreuilly et al. 2020), and radiative transfer effects are neglected when estimating the dust masses, despite young embedded disks being largely optically thick at millimeter wavelengths. Therefore, disk masses extrapolated from dust continuum observations must be interpreted with care (see Tung et al. 2024) if measurements of the kinematic mass are not possible.
In our parameter study, we investigated the impact of the core collapse simulation uncertainties (see Sect. 7.4) using scaling factors for temperature (ξ) and velocity fluctuations (χ). This allowed us to obtain first-order results and investigate the impact of temperature and turbulence on planetesimal formation at low computational cost, but only serves as a rough approximation. As we find that the resulting mass of planetesimals are sensitive to the disk temperature, more detailed radiative physics including heating terms from the central star and accretion should in principle be applied to the core collapse simulations themselves. Additionally, a more self-consistent treatment of the gas scale height and vertical settling is necessary. Overall, this would lead to more accurate radial profiles of the temperature, as the change of the radial profile is not taken into account by the parameter ξ. In simulations where the cold-finger effect can operate, planetesimal formation takes place in a narrow region outside the snow line, so that for a given snow line location, a change in the radial profile is likely not significant for the fragmentation barrier of the planetesimal forming grains. While the radial profile has an impact on the global picture of the fragmentation barrier and resulting dust grain sizes, drift is not significant on the timescales we consider in this work, so that the planetesimal formation region would be unaffected. However, the radial profile may affect simulation where planetesimals form through settling alone (see Sect. 4.4), as the formation region is wider in that case, and further work is required to investigate this.
Including more detailed radiative physics will not only affect the radial temperature profile and resulting scale height, but is likely to have an impact on the overall structure of the formed disk. For example, a higher temperature generally stabilizes disks against gravitational instability (see Eq. (37)), so that a range of MHD parameters that were excluded from this work due to forming gravitationally unstable disks could lead to stable disks instead. On the other hand, the inclusion of more physics comes at significant computation cost. For example, Lebreuilly et al. (2024) model both radiative transfer and stellar radiative feedback in the RAMSES code while investigating the collapse of a molecular cloud, but the simulated time of the individual sinks does not exceed 30 Myr for the majority of sinks, which is insufficient for an analysis like presented in this work.
From an observational point of view, high-resolution observations like those performed by Facchini et al. (2024) for the HL Tau disk, obtaining information about the spatial distribution of water vapor, could provide information about the location of the snow line and the disk temperature. If such studies are extended to young class 0/I disks, they could provide insight on the effectiveness of the cold-finger effect in these disks. However, this may prove difficult given that most young disks are optically thick at millimeter wavelengths in the inner regions. Furthermore, higher resolution simulations need to be performed to investigate whether velocity fluctuation in the midplane of the disk are indeed a factor 10 or 100 lower in magnitude than in the disk upper layers.
We employed several simplifications in our treatment of dust evolution and planetesimal formation. We assumed spherical grains of homogeneous density and composition-independent size, neglecting how porous grains could grow larger and settle more efficiently (Krijt et al. 2016), which could alleviate the need for significantly reducing the velocity fluctuations felt by the dust. Instead of considering the size change of grains due to evaporation and condensation, we changed the fragmentation velocity based on grain composition, which also reduces the size of the silicate grains compared to grains with an ice mantle. Furthermore, the two-population model we employed utilizes several constants (ff, fd, fm; see Birnstiel et al. 2012) that were calibrated to match this simplified model to more detailed dust coagulation simulations. However, these simulations considered a disk with Mdisk = 0.1 M⊙ around a solar-mass star with no external infall and parameterize the turbulence with a single viscous α parameter. While our model took into account the mass variability of the central star for the calculation of the growth limit of the dust grains, it was assumed that the numerical values found for these constants still serve as a good approximation for the class 0/I disks we considered. Given that in our case, the host star has only grown to M⋆ ~ 0.4 M⊙ at the end of the R2 simulation and that the disk is subject to a significant influx of mass, detailed simulations of dust growth and dynamics in such an environment are required to confirm these assumptions in the future.
Even though we find ε = Σdust/Σgas ≫ 1 in some runs where the cold-finger effect is highly efficient at retaining infalling dust, we do not consider the dust back-reaction on the gas. While a high bulk dust-to-gas ratio can be indicative of considerable back-reaction slowing down gas accretion rates, dust grains need to be large enough to result in a significant impact on gas dynamics (Gárate et al. 2020). In fact, it is required that Stε/(ε + 1) ~ α (Kanagawa et al. 2017; Dipierro et al. 2018). Employing α ≈ αEA ~ 10−1 and ε ~ 10 to match the scenario in Fig. 12 at r = 10 AU, dust grains would be required to have a Stokes number of St ~ 10−1 to change gas dynamics, which is two orders of magnitude higher than the Stokes number of the largest grains in this scenario. While this may indicate that the dust back-reaction on the gas does not change our results significantly, more involved hydrodynamical calculations would be required to understand how it would affect the accumulation of solids at the snow line due to the cold-finger effect in detail.
We form planetesimals in our 1D framework by using a parameterized criterion for the streaming instability in class II disks, rather than modeling it self-consistently. It is based on simulations without infall or strong turbulence, and it remains to be investigated how the conditions in early stage disks impact the clumping of solids by the streaming instability and how the minimal initial solid concentration and size for efficient planetesimal formation is affected by it. Furthermore, in order to form planetesimals, we find that, among other necessary disk conditions, the magnitude of midplane velocity fluctuations needs to be reduced by a factor of 10 or 100 compared to the values found directly in the core collapse simulations. If such low velocity fluctuations do not reflect the reality during the first 100 kyr after disk formation, they are likely to still be reached at some point before class II is reached, so that early substructures can be formed by potential early planetary cores. This is because the infalling material is the main source of velocity fluctuations here, and it must diminish over time to the point when it eventually ceases. Therefore, the conditions that correspond to an arbitrary reduction here might be reached naturally at later times, which remains subject to future work.
8 Conclusions
We performed 1D protoplanetary disk simulations investigating the dust distribution found in the disks arising in the core collapse simulations performed by H20. The model we used was designed to investigate the possibility of planetesimal formation during the class 0/I evolutionary stage of protoplanetary disks; that is, young disks subject to significant accretion of material from their envelope. We have drawn the following conclusions:
Velocity fluctuations found at the resolution employed in the core collapse simulations from H20 do not lead to outward angular momentum transport; that is, αSS < 0. The evolution of the disks is governed by strong inward advection, which is caused by the infalling mass being strongly deficient in angular momentum;
Employing disk quantity profiles obtained directly from core collapse simulations performed by H20, the resulting disk conditions do not lead to the formation of planetesimals. However, adapting the temperature to match core collapse simulations where more realistic temperature models were used, ξ ~ 5, as well as reducing the velocity fluctuations felt by the dust by a factor χ = 10 to mitigate effects likely caused by the poor resolution, we find that planetesimals with a total mass of up to Mpltm,tot ~ 10−3 M⊙ may be formed in class 0/I disks if strong clumping of dust leads to gravitational collapse. This holds true even if the disks are not initially enriched in solids, and an ISM-motivated initial dust-to-gas ratio of ε0 = 0.01 is used, and for both strong clumping criteria we investigated. This has strong implications for the onset of planet formation and the creation of giant planet cores;
The assumption of the average particle size,
![$\[\bar{a}\]$](/articles/aa/full_html/2025/04/aa52689-24/aa52689-24-eq88.png) , for evaporation and condensation plays a significant role due to the rapid advection of disk material caused by the strong infall. While planetesimals form for a range of parameters for a0 ≲ 1 μm, the same does not hold true if disk processes lead to a sweep up and effective removal of small dust grains. In such a case, planetesimal formation is suppressed fully for an ISM-motivated initial dust-to-gas ratio of 1%. Planetesimal formation can then only occur to a significant extent if the velocity fluctuations are reduced significantly (χ = 100), the disk is not too hot (ξ ≤ 5), the disk is initially enriched in solids (ε0 > 0.03), and if strong clumping due to the streaming instability can already take place at a mid-plane dust-to-gas ratio of 0.5. Even then, planetesimals only form under the assumption that the strong turbulence found in young disks does not prevent clumping by the SI;
, for evaporation and condensation plays a significant role due to the rapid advection of disk material caused by the strong infall. While planetesimals form for a range of parameters for a0 ≲ 1 μm, the same does not hold true if disk processes lead to a sweep up and effective removal of small dust grains. In such a case, planetesimal formation is suppressed fully for an ISM-motivated initial dust-to-gas ratio of 1%. Planetesimal formation can then only occur to a significant extent if the velocity fluctuations are reduced significantly (χ = 100), the disk is not too hot (ξ ≤ 5), the disk is initially enriched in solids (ε0 > 0.03), and if strong clumping due to the streaming instability can already take place at a mid-plane dust-to-gas ratio of 0.5. Even then, planetesimals only form under the assumption that the strong turbulence found in young disks does not prevent clumping by the SI;The highest total planetesimal mass that can be formed during the ~100 kyr run time of the core collapse simulation under the most optimistic conditions is Mpltm,tot = 10−2 M⊙, which is approximately one disk mass at the end of the core collapse simulation;
Solids used for the buildup of plantesimals do not decrease the dust content within the disk, as infalling material from the natal molecular cloud continuously replenishes them. The formation of planetesimals is episodic and occurs generally via two mechanisms, corresponding to different formation locations. First, the cold-finger effect can lead to efficient planetesimal formation near the snow line given sufficient
![$\[\bar{a}\]$](/articles/aa/full_html/2025/04/aa52689-24/aa52689-24-eq89.png) , even for moderately strong settling. If settling is highly efficient and the disk initially enriched in solids, planetesimals can be formed solely due to settling, which leads to a broader area of planetesimal formation, whose location is then set only by the velocity fluctuations arising during core collapse;
, even for moderately strong settling. If settling is highly efficient and the disk initially enriched in solids, planetesimals can be formed solely due to settling, which leads to a broader area of planetesimal formation, whose location is then set only by the velocity fluctuations arising during core collapse;A smaller rotation to gravitational energy fraction, corresponding to a more compact disk, creates much less favorable conditions for planetesimal formation, mainly due to a greatly reduced settling efficiency. On the other hand, a change in the initial angle between the magnetic field and the disk rotation axis does not impact the results significantly.
Acknowledgements
The authors acknowledge financial support from the European Research Council via the ERC Synergy Grant ECOGAL (grant 855130). Part of this work is funded by the DFG via the Heidelberg Cluster of Excellence STRUCTURES in the framework of Germany’s Excellence Strategy (grant EXC-2181/1 – 390900948). R.S.K. also acknowledges funding from the German Ministry for Economic Affairs and Climate Action in project “MAINN” (funding ID 50OO2206). The authors acknowledge support by the High Performance and Cloud Computing Group at the Zentrum für Datenverarbeitung of the University of Tübingen, the state of Baden-Württemberg through bwHPC and the German Research Foundation (DFG) through grants INST 35/1134-1 FUGG, 35/1597-1 FUGG and 37/935-1 FUGG. Additionally, R.S.K. is grateful for data storage at SDS@hd funded through grants INST 35/1314-1 FUGG and INST 35/1503-1 FUGG. And R.S.K. thanks the Harvard-Smithsonian Center for Astrophysics and the Radcliffe Institute for Advanced Studies for their hospitality during his sabbatical, and the 2024/25 Class of Radcliffe Fellows for highly interesting and stimulating discussions. A.M. acknowledges support the funding from the European Research Council (ERC) under the European Union’s Horizon 2020 research and innovation programme (Grant agreement No. 101098309 – PEBBLES). G.R. acknowledges funding from the Fondazione Cariplo, grant no. 2022–1217, and the European Research Council (ERC) under the European Union’s Horizon Europe Research & Innovation Programme under grant agreement no. 101039651 (DiscEvol). Views and opinions expressed are however those of the author(s) only, and do not necessarily reflect those of the European Union or the European Research Council Executive Agency. Neither the European Union nor the granting authority can be held responsible for them.
Appendix A 1D model boundary conditions
When choosing the inner boundary condition for the background gas, we considered multiple factors. First, the inner edge of the simulation grid does not correspond to the physical inner edge of the protoplanetary disk. Therefore, the condition has to be chosen in a way that is consistent with the existence of the inner disk inside the inner edge of the computational domain. Furthermore, most of the infalling material leaves the computational domain through the inner edge. Thus, we chose the boundary condition such that the mass flux is not impeded and mass is not artificially accumulated at the inner edge. In the following, to simplify notation, Σ = ΣH+He, unless specified otherwise.
For the background gas, the viscous contribution to the radial velocity at the inner boundary can be inferred from Eq. (8) to be
![$\[v_0=-\frac{3}{\Sigma_0 \sqrt{r_0}}\left(\frac{v_0}{\sqrt{r_0}} \frac{\Sigma_1 r_1-\Sigma_0 r_0}{r_1-r_0}+\Sigma_0 r_0 \frac{\frac{v_1}{\sqrt{r_1}}-\frac{v_0}{\sqrt{r_0}}}{r_1-r_0}\right),\]$](/articles/aa/full_html/2025/04/aa52689-24/aa52689-24-eq90.png) (A.1)
(A.1)
where the lower indices 0,1 refer to the values at the inner boundary cell and the one adjacent to it, respectively, and ν denotes the kinematic viscosity. Imposing the common zero gradient boundary condition ∂(Σr)/∂r reduces the radial velocity at the inner boundary, because the first term in Eq. (A.1) is zero. To alleviate that, we instead imposed
![$\[\left.\frac{\partial}{\partial r}\left(\Sigma^{i+1} \nu^i \sqrt{r}\right)\right|_0=\frac{\nu_0^i}{\sqrt{r_0}} \frac{\Sigma_1^i r_1-\Sigma_0^i r_0}{r_1-r_0}+\Sigma_0^{i+1} \frac{\frac{\nu_1^i}{\sqrt{r_1}}-\frac{\nu_0^i}{\sqrt{r_0}}}{r_1-r_0},\]$](/articles/aa/full_html/2025/04/aa52689-24/aa52689-24-eq91.png) (A.2)
(A.2)
where the upper indices indicate the time step; that is, an upper index of i + 1 indicates the time step to be calculated, whereas i indicates the previously calculated time step. Equation (A.2) is equivalent to
![$\[\left.\frac{\partial}{\partial r}\left(\Sigma^{i+1} r\right)\right|_0=\left.\frac{\partial}{\partial r}\left(\Sigma^i r\right)\right|_0.\]$](/articles/aa/full_html/2025/04/aa52689-24/aa52689-24-eq92.png) (A.3)
(A.3)
The outer boundary lies in the diffuse envelope surrounding the young protoplanetary disk. We imposed
![$\[\Sigma_{N-1}=\Sigma_{\text {env }},\]$](/articles/aa/full_html/2025/04/aa52689-24/aa52689-24-eq93.png) (A.4)
(A.4)
with Σenv describing the envelope surface density. It was obtained directly from the MHD simulations by H20.
For the water vapor, we assumed that there is no concentration gradient at the inner boundary,
![$\[\left.\frac{\partial}{\partial r}\left(\frac{\Sigma_{\text {vap }}}{\Sigma_{\mathrm{H}+\mathrm{He}}}\right)\right|_0=0,\]$](/articles/aa/full_html/2025/04/aa52689-24/aa52689-24-eq94.png) (A.5)
(A.5)
whereas the cold outer boundary cell contains no water vapor,
![$\[\Sigma_{\text {vap}}(r_{N-1})=0.\]$](/articles/aa/full_html/2025/04/aa52689-24/aa52689-24-eq95.png) (A.6)
(A.6)
Analogously, we assumed that the concentration gradient vanishes for icy and silicate solids at the inner boundary,
![$\[\left.\frac{\partial}{\partial r}\left(\frac{\Sigma_{\text {ice,sil }}}{\sum_{\Sigma_{\mathrm{H}+\mathrm{He}}}}\right)\right|_0=0,\]$](/articles/aa/full_html/2025/04/aa52689-24/aa52689-24-eq96.png) (A.7)
(A.7)
whereas the right boundary is given by the envelope density,
![$\[\Sigma_{\mathrm{ice}, \mathrm{sil}}(r_{N-1})=\frac{1}{2} \epsilon_0 \Sigma_{\mathrm{env}}.\]$](/articles/aa/full_html/2025/04/aa52689-24/aa52689-24-eq97.png) (A.8)
(A.8)
In the interest of numerical stability, we changed the inner boundary condition for the background gas in the R7-based simulation to
![$\[\left.\frac{\partial}{\partial r}\left(\Sigma^{i+1} \sqrt{r} \nu^i\right)\right|_0=0.\]$](/articles/aa/full_html/2025/04/aa52689-24/aa52689-24-eq98.png) (A.9)
(A.9)
This choice of boundary condition limits the mass outflow to the radial velocity contribution caused by advection, as detailed above. However, since the advective term provides the dominant contribution to the radial velocity, this does not have a significant impact on the resulting surface density evolution.
Appendix B Time-dependent effectiveness of the cold-finger effect
The fraction of water vapor that can reach the snow line after evaporating from the grain surface, resulting in condensation, is an indicator for the effectiveness of the cold finger effect. It is shown in Fig. 14 averaged over the entire runtime of the simulation. In more detail, disk conditions vary greatly over time, leading to fluctuations of the effective Schmidt number ![$\[\widetilde{\mathrm{Sc}}=\alpha_{\mathrm{EA}} / \delta_{r}\]$](/articles/aa/full_html/2025/04/aa52689-24/aa52689-24-eq99.png) . Figure B.1 shows this time dependence for the considered values of
. Figure B.1 shows this time dependence for the considered values of ![$\[\bar{a}\]$](/articles/aa/full_html/2025/04/aa52689-24/aa52689-24-eq100.png) . Even if a large fraction of vapor can reach the snow line on average, indicating a high effectiveness of the cold-finger effect, it can still fail in providing a sufficient increase in the vertically averaged dust-to-gas ratio for planetesimal formation. This is because planetesimal formation episodically occurs during times of and in regions where δz and δt are small. If the formation episodes do not coincide with the times when substantial backward diffusion is taking place, planetesimal formation might be hindered as a result.
. Even if a large fraction of vapor can reach the snow line on average, indicating a high effectiveness of the cold-finger effect, it can still fail in providing a sufficient increase in the vertically averaged dust-to-gas ratio for planetesimal formation. This is because planetesimal formation episodically occurs during times of and in regions where δz and δt are small. If the formation episodes do not coincide with the times when substantial backward diffusion is taking place, planetesimal formation might be hindered as a result.
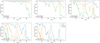 |
Fig. B.1 Mass fraction of water vapor reaching the snow line via backward radial diffusion from revap = rsnow + vgasτevap as a function of time. The panels show the cases of different |
![$\[\bar{a}\]$](/articles/aa/full_html/2025/04/aa52689-24/aa52689-24-eq101.png)
![$\[\bar{a}\]$](/articles/aa/full_html/2025/04/aa52689-24/aa52689-24-eq102.png)
![$\[\bar{a}\]$](/articles/aa/full_html/2025/04/aa52689-24/aa52689-24-eq103.png)
Appendix C Cold-finger effect in a dust-enriched disk
![$\[\bar{a}\]$](/articles/aa/full_html/2025/04/aa52689-24/aa52689-24-eq104.png)
A protoplanetary disk that is initially enriched in solids and exhibits comparatively low velocity fluctuations while also retaining the smallest grains for efficient operation of the cold-finger effect would enable a high midplane dust-to-gas ratio in a considerable area of the disk and over most of the simulation time. This combined case is presented in Fig. C.1, showing the midplane dust-to-gas ratio for the previously discussed ideal case χ = 100, ε0 = 0.05 and εmid,crit for various temperatures where small grains are now available for evaporation and condensation such that ![$\[\bar{a}\]$](/articles/aa/full_html/2025/04/aa52689-24/aa52689-24-eq105.png) = 1 μm. It can be seen that the cold-finger effect, as expected, strongly raises the midplane dust-to-gas ratio close to the snow line, while the higher value of ε0 additionally allows planetesimals to form in places unrelated to the snow line solely caused by strong settling. The resulting total mass of formed planetesimals is depicted in Fig. C.2. In this combined scenario, most planetesimals are formed for ξ ~ 4.5 within the simulation time, and the total mass increases with ε0 as expected. However, these results are limited by the simulation run time. Planetesimal formation is still commencing at the end of the simulation in many runs where planetesimal formation is efficient. Furthermore, due to the episodic nature of planetesimal formation we find in this work, this cannot be excluded for the other cases. We note that the total mass of formed planetesimals is comparable to the final gas disk mass in the most efficient cases, greatly exceeding the total mass of all available solids in a typical class II disk model. As was discussed above, the reason for this lies in the fact that material accreted from the envelope is converted into planetesimals, rather than material initially present in the disk.
= 1 μm. It can be seen that the cold-finger effect, as expected, strongly raises the midplane dust-to-gas ratio close to the snow line, while the higher value of ε0 additionally allows planetesimals to form in places unrelated to the snow line solely caused by strong settling. The resulting total mass of formed planetesimals is depicted in Fig. C.2. In this combined scenario, most planetesimals are formed for ξ ~ 4.5 within the simulation time, and the total mass increases with ε0 as expected. However, these results are limited by the simulation run time. Planetesimal formation is still commencing at the end of the simulation in many runs where planetesimal formation is efficient. Furthermore, due to the episodic nature of planetesimal formation we find in this work, this cannot be excluded for the other cases. We note that the total mass of formed planetesimals is comparable to the final gas disk mass in the most efficient cases, greatly exceeding the total mass of all available solids in a typical class II disk model. As was discussed above, the reason for this lies in the fact that material accreted from the envelope is converted into planetesimals, rather than material initially present in the disk.
![$\[\bar{a}\]$](/articles/aa/full_html/2025/04/aa52689-24/aa52689-24-eq106.png)
Appendix D R1 and R7 disk quantity profiles
To verify the continued validity of our 1D model reproducing the disk evolution of the core collapse simulations, the time evolution of the radial profile of the gas disk surface density is shown in Fig. D.1 and compared to the time evolution obtained in the 1D framework, analogously to R2 (see Fig. 4). Similar to the case of R2, the time evolution of Σ matches the original evolution order-of-magnitude. Most notably, the disk found in R1 is more compact than in R2 initially, but the disk expands to a cutoff radius comparable to that of R2 for later times. Like for R2, the Σ radial profiles of R1 show a kink close to the sink particle accretion radius, likely related to unphysical parameters caused by the sink particle accretion. We note that it is less pronounced for R7, but this is related to the shorter run time of that simulation, as the kink becomes more pronounced over time. Additionally, the surface density in the envelope area of the radial grid is reproduced worse for R7 than for the other core collapse simulations. However, since this region is largely devoid of mass, there is no significant impact on the creation of conditions necessary for planetesimal formation.
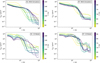 |
Fig. D.1 Gas surface density Σgas as a function of radial distance. The line color denotes the elapsed simulation time as indicated by the color bar, where a darker color indicates later times. Top: Calculated directly from the R1 (left) or R7 (right) core collapse simulation. Bottom: Obtained in our 1D model when starting from the first core collapse snapshot and employing the previously extracted model parameters. |
In the interest of brevity, the radial profiles of some disk quantities from the R1 and R7 core collapse simulations were not shown in Sect. 5. They are shown in this appendix instead. The temperature is presented in Fig. D.2 and the Shakura-Sunyaev parameter, αSS, in Fig. D.3, whereas the velocity fluctuation parameters, δr, δz, and δt, are shown in Fig. D.4.
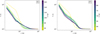 |
Fig. D.2 Average temperature as a function of radial distance found in R1 (left) and R7 (right). Different line colors indicate different simulation times according to the color bar, as in Fig. 4. |
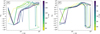 |
Fig. D.3 Same as Fig. D.2, but instead of the temperature the radial profile of the internal torque parameter, αSS (cf. Eq. 10), is shown, and is scaled linearly if the absolute value is less than 10−4, but logarithmically otherwise. |
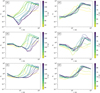 |
Fig. D.4 Radial profiles of model parameters describing dust properties and evolution, calculated from the disk in R1 (left-hand side) and R7 (right-hand side) and with line coloring like in Fig. 4. Top: Radial diffusion parameter, δr (cf. Eq. 16). Middle: Vertical mixing parameter, δz (cf. Eq. 17). Bottom: Turbulence parameter, δt (cf. Eq. 18). |
References
- ALMA Partnership (Brogan, C. L., et al.) 2015, ApJ, 808, L3 [Google Scholar]
- Andre, P., Ward-Thompson, D., & Barsony, M. 2000, in Protostars and Planets IV, eds. V. Mannings, A. P. Boss, & S. S. Russell, 59 [Google Scholar]
- Andrews, S. M., Huang, J., Pérez, L. M., et al. 2018, ApJ, 869, L41 [NASA ADS] [CrossRef] [Google Scholar]
- Aumatell, G., & Wurm, G. 2014, MNRAS, 437, 690 [CrossRef] [Google Scholar]
- Bae, J., Isella, A., Zhu, Z., et al. 2023, in Astronomical Society of the Pacific Conference Series, 534, Protostars and Planets VII, eds. S. Inutsuka, Y. Aikawa, T. Muto, K. Tomida, & M. Tamura, 423 [Google Scholar]
- Bai, X.-N., & Stone, J. M. 2010, ApJ, 722, 1437 [NASA ADS] [CrossRef] [Google Scholar]
- Balbus, S. A., & Hawley, J. F. 1998, Rev. Mod. Phys., 70, 1 [Google Scholar]
- Bate, M. R. 2022, MNRAS, 514, 2145 [CrossRef] [Google Scholar]
- Bate, M. R., & Lorén-Aguilar, P. 2017, MNRAS, 465, 1089 [Google Scholar]
- Belloche, A., Maury, A. J., Maret, S., et al. 2020, A&A, 635, A198 [NASA ADS] [CrossRef] [EDP Sciences] [Google Scholar]
- Bergner, J. B., Sturm, J. A., Piacentino, E. L., et al. 2024, arXiv e-prints [arXiv:2409.08117] [Google Scholar]
- Bernabò, L. M., Turrini, D., Testi, L., Marzari, F., & Polychroni, D. 2022, ApJ, 927, L22 [CrossRef] [Google Scholar]
- Bhandare, A., Commerçon, B., Laibe, G., et al. 2024, A&A, 687, A158 [NASA ADS] [CrossRef] [EDP Sciences] [Google Scholar]
- Birnstiel, T., Klahr, H., & Ercolano, B. 2012, A&A, 539, A148 [NASA ADS] [CrossRef] [EDP Sciences] [Google Scholar]
- Bitsch, B., & Battistini, C. 2020, A&A, 633, A10 [NASA ADS] [CrossRef] [EDP Sciences] [Google Scholar]
- Bjerkeli, P., Ramsey, J. P., Harsono, D., et al. 2023, A&A, 677, A62 [NASA ADS] [CrossRef] [EDP Sciences] [Google Scholar]
- Blandford, R. D., & Payne, D. G. 1982, MNRAS, 199, 883 [CrossRef] [Google Scholar]
- Boogert, A. C. A., Gerakines, P. A., & Whittet, D. C. B. 2015, ARA&A, 53, 541 [Google Scholar]
- Booth, A. S., & Ilee, J. D. 2020, MNRAS, 493, L108 [NASA ADS] [CrossRef] [Google Scholar]
- Busch, L. A., Belloche, A., Garrod, R. T., Müller, H. S. P., & Menten, K. M. 2022, A&A, 665, A96 [NASA ADS] [CrossRef] [EDP Sciences] [Google Scholar]
- Cacciapuoti, L., Macias, E., Maury, A. J., et al. 2023, A&A, 676, A4 [NASA ADS] [CrossRef] [EDP Sciences] [Google Scholar]
- Cacciapuoti, L., Macias, E., Gupta, A., et al. 2024, A&A, 682, A61 [NASA ADS] [CrossRef] [EDP Sciences] [Google Scholar]
- Carballido, A., Stone, J. M., & Pringle, J. E. 2005, MNRAS, 358, 1055 [NASA ADS] [CrossRef] [Google Scholar]
- Carrera, D., Johansen, A., & Davies, M. B. 2015, A&A, 579, A43 [NASA ADS] [CrossRef] [EDP Sciences] [Google Scholar]
- Cridland, A. J., Rosotti, G. P., Tabone, B., et al. 2022, A&A, 662, A90 [NASA ADS] [CrossRef] [EDP Sciences] [Google Scholar]
- Cumming, A., Butler, R. P., Marcy, G. W., et al. 2008, PASP, 120, 531 [CrossRef] [Google Scholar]
- Cuzzi, J. N., & Zahnle, K. J. 2004, ApJ, 614, 490 [NASA ADS] [CrossRef] [Google Scholar]
- Dipierro, G., Laibe, G., Alexander, R., & Hutchison, M. 2018, MNRAS, 479, 4187 [NASA ADS] [CrossRef] [Google Scholar]
- Dominik, C., & Dullemond, C. P. 2024, A&A, 682, A144 [NASA ADS] [CrossRef] [EDP Sciences] [Google Scholar]
- Drążkowska, J., & Alibert, Y. 2017, A&A, 608, A92 [Google Scholar]
- Drążkowska, J., & Dullemond, C. P. 2018, A&A, 614, A62 [NASA ADS] [CrossRef] [EDP Sciences] [Google Scholar]
- Drążkowska, J., Alibert, Y., & Moore, B. 2016, A&A, 594, A105 [Google Scholar]
- Drążkowska, J., Bitsch, B., Lambrechts, M., et al. 2023, in Astronomical Society of the Pacific Conference Series, 534, Protostars and Planets VII, eds. S. Inutsuka, Y. Aikawa, T. Muto, K. Tomida, & M. Tamura, 717 [Google Scholar]
- Dubrulle, B., Morfill, G., & Sterzik, M. 1995, Icarus, 114, 237 [Google Scholar]
- Eistrup, C., Walsh, C., & van Dishoeck, E. F. 2016, A&A, 595, A83 [NASA ADS] [CrossRef] [EDP Sciences] [Google Scholar]
- Evans, Neal J., I., Dunham, M. M., Jørgensen, J. K., et al. 2009, ApJS, 181, 321 [NASA ADS] [CrossRef] [Google Scholar]
- Evans, Neal J., I., Di Francesco, J., Lee, J.-E., et al. 2015, ApJ, 814, 22 [CrossRef] [Google Scholar]
- Facchini, S., Testi, L., Humphreys, E., et al. 2024, Nat. Astron., 8, 587 [Google Scholar]
- Fiorellino, E., Manara, C. F., Nisini, B., et al. 2021, A&A, 650, A43 [NASA ADS] [CrossRef] [EDP Sciences] [Google Scholar]
- Flores, C., Ohashi, N., Tobin, J. J., et al. 2023, ApJ, 958, 98 [NASA ADS] [CrossRef] [Google Scholar]
- Gail, H.-P., & Trieloff, M. 2017, A&A, 606, A16 [NASA ADS] [CrossRef] [EDP Sciences] [Google Scholar]
- Galametz, M., Maury, A. J., Valdivia, V., et al. 2019, A&A, 632, A5 [NASA ADS] [CrossRef] [EDP Sciences] [Google Scholar]
- Gárate, M., Birnstiel, T., Drążkowska, J., & Stammler, S. M. 2020, A&A, 635, A149 [NASA ADS] [CrossRef] [EDP Sciences] [Google Scholar]
- Gerbig, K., & Li, R. 2023, ApJ, 949, 81 [NASA ADS] [CrossRef] [Google Scholar]
- Gerbig, K., Murray-Clay, R. A., Klahr, H., & Baehr, H. 2020, ApJ, 895, 91 [CrossRef] [Google Scholar]
- Gole, D. A., Simon, J. B., Li, R., Youdin, A. N., & Armitage, P. J. 2020, ApJ, 904, 132 [NASA ADS] [CrossRef] [Google Scholar]
- Guillet, V., Hennebelle, P., Pineau des Forêts, G., et al. 2020, A&A, 643, A17 [EDP Sciences] [Google Scholar]
- Gundlach, B., & Blum, J. 2015, ApJ, 798, 34 [Google Scholar]
- Gundlach, B., Schmidt, K. P., Kreuzig, C., et al. 2018, MNRAS, 479, 1273 [NASA ADS] [CrossRef] [Google Scholar]
- Hartlep, T., & Cuzzi, J. N. 2020, ApJ, 892, 120 [NASA ADS] [CrossRef] [Google Scholar]
- Hennebelle, P., Commerçon, B., Lee, Y.-N., & Chabrier, G. 2020a, ApJ, 904, 194 [Google Scholar]
- Hennebelle, P., Commerçon, B., Lee, Y.-N., & Charnoz, S. 2020b, A&A, 635, A67 [NASA ADS] [CrossRef] [EDP Sciences] [Google Scholar]
- Hueso, R., & Guillot, T. 2005, A&A, 442, 703 [NASA ADS] [CrossRef] [EDP Sciences] [Google Scholar]
- Hühn, L. A., & Bitsch, B. 2023, A&A, 676, A87 [NASA ADS] [CrossRef] [EDP Sciences] [Google Scholar]
- Jiang, H., & Ormel, C. W. 2023, MNRAS, 518, 3877 [Google Scholar]
- Johansen, A., Oishi, J. S., Mac Low, M.-M., et al. 2007, Nature, 448, 1022 [Google Scholar]
- Johansen, A., Blum, J., Tanaka, H., et al. 2014, in Protostars and Planets VI, eds. H. Beuther, R. S. Klessen, C. P. Dullemond, & T. Henning, 547 [Google Scholar]
- Kanagawa, K. D., Ueda, T., Muto, T., & Okuzumi, S. 2017, ApJ, 844, 142 [NASA ADS] [CrossRef] [Google Scholar]
- Kenyon, S. J., & Hartmann, L. 1995, ApJS, 101, 117 [Google Scholar]
- Klahr, H., & Schreiber, A. 2020, ApJ, 901, 54 [NASA ADS] [CrossRef] [Google Scholar]
- Kornet, K., Stepinski, T. F., & Różyczka, M. 2001, A&A, 378, 180 [NASA ADS] [CrossRef] [EDP Sciences] [Google Scholar]
- Krapp, L., Benítez-Llambay, P., Gressel, O., & Pessah, M. E. 2019, ApJ, 878, L30 [Google Scholar]
- Krijt, S., Ormel, C. W., Dominik, C., & Tielens, A. G. G. M. 2016, A&A, 586, A20 [NASA ADS] [CrossRef] [EDP Sciences] [Google Scholar]
- Kristensen, L. E., & Dunham, M. M. 2018, A&A, 618, A158 [NASA ADS] [CrossRef] [EDP Sciences] [Google Scholar]
- Krumholz, M. R., Klein, R. I., & McKee, C. F. 2007, ApJ, 656, 959 [NASA ADS] [CrossRef] [Google Scholar]
- Lada, C. J. 1987, in IAU Symposium, 115, Star Forming Regions, eds. M. Peimbert, & J. Jugaku, 1 [Google Scholar]
- Lambrechts, M., & Johansen, A. 2012, A&A, 544, A32 [NASA ADS] [CrossRef] [EDP Sciences] [Google Scholar]
- Lebreuilly, U., Commerçon, B., & Laibe, G. 2020, A&A, 641, A112 [EDP Sciences] [Google Scholar]
- Lebreuilly, U., Vallucci-Goy, V., Guillet, V., Lombart, M., & Marchand, P. 2023, MNRAS, 518, 3326 [Google Scholar]
- Lebreuilly, U., Hennebelle, P., Colman, T., et al. 2024, A&A, 682, A30 [NASA ADS] [CrossRef] [EDP Sciences] [Google Scholar]
- Lee, Y.-N., Charnoz, S., & Hennebelle, P. 2021, A&A, 648, A101 [NASA ADS] [CrossRef] [EDP Sciences] [Google Scholar]
- Lesur, G., Flock, M., Ercolano, B., et al. 2023, in Astronomical Society of the Pacific Conference Series, 534, Protostars and Planets VII, eds. S. Inutsuka, Y. Aikawa, T. Muto, K. Tomida, & M. Tamura, 465 [Google Scholar]
- Li, R., & Youdin, A. N. 2021, ApJ, 919, 107 [NASA ADS] [CrossRef] [Google Scholar]
- Lichtenegger, H. I. M., & Komle, N. I. 1991, Icarus, 90, 319 [NASA ADS] [CrossRef] [Google Scholar]
- Lim, J., Simon, J. B., Li, R., et al. 2024, ApJ, 969, 130 [NASA ADS] [CrossRef] [Google Scholar]
- Manara, C. F., Morbidelli, A., & Guillot, T. 2018, A&A, 618, L3 [NASA ADS] [CrossRef] [EDP Sciences] [Google Scholar]
- Marschall, R., & Morbidelli, A. 2023, A&A, 677, A136 [NASA ADS] [CrossRef] [EDP Sciences] [Google Scholar]
- Maureira, M. J., Gong, M., Pineda, J. E., et al. 2022, ApJ, 941, L23 [NASA ADS] [CrossRef] [Google Scholar]
- Maury, A. J., André, P., Men’shchikov, A., Könyves, V., & Bontemps, S. 2011, A&A, 535, A77 [NASA ADS] [CrossRef] [EDP Sciences] [Google Scholar]
- Maury, A. J., Belloche, A., André, P., et al. 2014, A&A, 563, L2 [NASA ADS] [CrossRef] [EDP Sciences] [Google Scholar]
- Maury, A. J., André, P., Testi, L., et al. 2019, A&A, 621, A76 [NASA ADS] [CrossRef] [EDP Sciences] [Google Scholar]
- Mauxion, J., Lesur, G., & Maret, S. 2024, A&A, 686, A253 [NASA ADS] [CrossRef] [EDP Sciences] [Google Scholar]
- Mayor, M., Marmier, M., Lovis, C., et al. 2011, arXiv e-prints [arXiv:1109.2497] [Google Scholar]
- Miotello, A., Kamp, I., Birnstiel, T., Cleeves, L. C., & Kataoka, A. 2023, in Astronomical Society of the Pacific Conference Series, 534, Protostars and Planets VII, eds. S. Inutsuka, Y. Aikawa, T. Muto, K. Tomida, & M. Tamura, 501 [Google Scholar]
- Morbidelli, A., Baillié, K., Batygin, K., et al. 2022, Nat. Astron., 6, 72 [Google Scholar]
- Musiolik, G., & Wurm, G. 2019, ApJ, 873, 58 [NASA ADS] [CrossRef] [Google Scholar]
- Öberg, K. I., & Bergin, E. A. 2021, Phys. Rep., 893, 1 [Google Scholar]
- Öberg, K. I., & Wordsworth, R. 2019, AJ, 158, 194 [Google Scholar]
- Öberg, K. I., Facchini, S., & Anderson, D. E. 2023, ARA&A, 61, 287 [CrossRef] [Google Scholar]
- Offner, S. S. R., Klein, R. I., McKee, C. F., & Krumholz, M. R. 2009, ApJ, 703, 131 [CrossRef] [Google Scholar]
- Ohashi, N., Tobin, J. J., Jørgensen, J. K., et al. 2023, ApJ, 951, 8 [NASA ADS] [CrossRef] [Google Scholar]
- Okuzumi, S., Tanaka, H., Kobayashi, H., & Wada, K. 2012, ApJ, 752, 106 [NASA ADS] [CrossRef] [Google Scholar]
- Ormel, C. W. 2017, in Astrophysics and Space Science Library, 445, Formation, Evolution, and Dynamics of Young Solar Systems, eds. M. Pessah, & O. Gressel, 197 [Google Scholar]
- Ormel, C. W., & Cuzzi, J. N. 2007, A&A, 466, 413 [NASA ADS] [CrossRef] [EDP Sciences] [Google Scholar]
- Ormel, C. W., & Klahr, H. H. 2010, A&A, 520, A43 [NASA ADS] [CrossRef] [EDP Sciences] [Google Scholar]
- Ormel, C. W., Paszun, D., Dominik, C., & Tielens, A. G. G. M. 2009, A&A, 502, 845 [NASA ADS] [CrossRef] [EDP Sciences] [Google Scholar]
- Paardekooper, S.-J., McNally, C. P., & Lovascio, F. 2020, MNRAS, 499, 4223 [CrossRef] [Google Scholar]
- Pacetti, E., Turrini, D., Schisano, E., et al. 2022, ApJ, 937, 36 [NASA ADS] [CrossRef] [Google Scholar]
- Pavlyuchenkov, Y., & Dullemond, C. P. 2007, A&A, 471, 833 [NASA ADS] [CrossRef] [EDP Sciences] [Google Scholar]
- Pineda, J. E., Arzoumanian, D., Andre, P., et al. 2023, in Astronomical Society of the Pacific Conference Series, 534, Protostars and Planets VII, eds. S. Inutsuka, Y. Aikawa, T. Muto, K. Tomida, & M. Tamura, 233 [Google Scholar]
- Pontoppidan, K. M., Salyk, C., Bergin, E. A., et al. 2014, in Protostars and Planets VI, eds. H. Beuther, R. S. Klessen, C. P. Dullemond, & T. Henning, 363 [Google Scholar]
- Rice, W. K. M., Lodato, G., Pringle, J. E., Armitage, P. J., & Bonnell, I. A. 2004, MNRAS, 355, 543 [NASA ADS] [CrossRef] [Google Scholar]
- Sai, J., Ohashi, N., Maury, A. J., et al. 2022, ApJ, 925, 12 [NASA ADS] [CrossRef] [Google Scholar]
- Sanchis, E., Testi, L., Natta, A., et al. 2020, A&A, 633, A114 [NASA ADS] [CrossRef] [EDP Sciences] [Google Scholar]
- Schäfer, U., & Johansen, A. 2022, A&A, 666, A98 [NASA ADS] [CrossRef] [EDP Sciences] [Google Scholar]
- Schäfer, U., Yang, C.-C., & Johansen, A. 2017, A&A, 597, A69 [Google Scholar]
- Schaffer, N., Johansen, A., & Lambrechts, M. 2021, A&A, 653, A14 [NASA ADS] [CrossRef] [EDP Sciences] [Google Scholar]
- Schoonenberg, D., & Ormel, C. W. 2017, A&A, 602, A21 [NASA ADS] [CrossRef] [EDP Sciences] [Google Scholar]
- Segura-Cox, D. M., Schmiedeke, A., Pineda, J. E., et al. 2020, Nature, 586, 228 [NASA ADS] [CrossRef] [Google Scholar]
- Shakura, N. I., & Sunyaev, R. A. 1973, A&A, 24, 337 [NASA ADS] [Google Scholar]
- Sheehan, P. D., Tobin, J. J., Looney, L. W., & Megeath, S. T. 2022, ApJ, 929, 76 [NASA ADS] [CrossRef] [Google Scholar]
- Shu, F. H. 1977, ApJ, 214, 488 [Google Scholar]
- Silsbee, K., Akimkin, V., Ivlev, A. V., et al. 2022, ApJ, 940, 188 [NASA ADS] [CrossRef] [Google Scholar]
- Simon, J. B., & Armitage, P. J. 2014, ApJ, 784, 15 [Google Scholar]
- Simon, J. B., Armitage, P. J., Li, R., & Youdin, A. N. 2016, ApJ, 822, 55 [Google Scholar]
- Steinpilz, T., Teiser, J., & Wurm, G. 2019, ApJ, 874, 60 [NASA ADS] [CrossRef] [Google Scholar]
- Sturm, J. A., McClure, M. K., Beck, T. L., et al. 2023, A&A, 679, A138 [NASA ADS] [CrossRef] [EDP Sciences] [Google Scholar]
- Tabone, B., Rosotti, G. P., Cridland, A. J., Armitage, P. J., & Lodato, G. 2022, MNRAS, 512, 2290 [NASA ADS] [CrossRef] [Google Scholar]
- Takakuwa, S., Saigo, K., Kido, M., et al. 2024, ApJ, 964, 24 [NASA ADS] [CrossRef] [Google Scholar]
- Teague, R., Bae, J., Bergin, E. A., Birnstiel, T., & Foreman-Mackey, D. 2018, ApJ, 860, L12 [NASA ADS] [CrossRef] [Google Scholar]
- Testi, L., Birnstiel, T., Ricci, L., et al. 2014, in Protostars and Planets VI, eds. H. Beuther, R. S. Klessen, C. P. Dullemond, & T. Henning, 339 [Google Scholar]
- Testi, L., Natta, A., Scholz, A., et al. 2016, A&A, 593, A111 [NASA ADS] [CrossRef] [EDP Sciences] [Google Scholar]
- Testi, L., Natta, A., Manara, C. F., et al. 2022, A&A, 663, A98 [NASA ADS] [CrossRef] [EDP Sciences] [Google Scholar]
- Teyssier, R. 2002, A&A, 385, 337 [CrossRef] [EDP Sciences] [Google Scholar]
- Tsiganis, K., Gomes, R., Morbidelli, A., & Levison, H. F. 2005, Nature, 435, 459 [Google Scholar]
- Tsukamoto, Y., Maury, A., Commercon, B., et al. 2023, in Astronomical Society of the Pacific Conference Series, 534, Protostars and Planets VII, eds. S. Inutsuka, Y. Aikawa, T. Muto, K. Tomida, & M. Tamura, 317 [Google Scholar]
- Tung, N.-D., Testi, L., Lebreuilly, U., et al. 2024, A&A, 684, A36 [NASA ADS] [CrossRef] [EDP Sciences] [Google Scholar]
- Turrini, D., Marzari, F., Polychroni, D., & Testi, L. 2019, ApJ, 877, 50 [NASA ADS] [CrossRef] [Google Scholar]
- Tychoniec, Ł., Tobin, J. J., Karska, A., et al. 2018, ApJS, 238, 19 [Google Scholar]
- Tychoniec, Ł., Manara, C. F., Rosotti, G. P., et al. 2020, A&A, 640, A19 [NASA ADS] [CrossRef] [EDP Sciences] [Google Scholar]
- Ulrich, R. K. 1976, ApJ, 210, 377 [Google Scholar]
- Umurhan, O. M., Estrada, P. R., & Cuzzi, J. N. 2020, ApJ, 895, 4 [Google Scholar]
- Valdivia, V., Maury, A., Brauer, R., et al. 2019, MNRAS, 488, 4897 [NASA ADS] [CrossRef] [Google Scholar]
- Vallucci-Goy, V., Lebreuilly, U., & Hennebelle, P. 2024, A&A, 690, A23 [NASA ADS] [CrossRef] [EDP Sciences] [Google Scholar]
- van der Marel, N., & Mulders, G. D. 2021, AJ, 162, 28 [NASA ADS] [CrossRef] [Google Scholar]
- van’t Hoff, M. L. R., Tobin, J. J., Harsono, D., & van Dishoeck, E. F. 2018, A&A, 615, A83 [CrossRef] [EDP Sciences] [Google Scholar]
- van’t Hoff, M. L. R., Bergin, E. A., Jørgensen, J. K., & Blake, G. A. 2020, ApJ, 897, L38 [CrossRef] [Google Scholar]
- van’t Hoff, M. L. R., Bergin, E. A., Riley, P., et al. 2024, ApJ, 970, 138 [Google Scholar]
- Vorobyov, E. I., Kulikov, I., Elbakyan, V. G., McKevitt, J., & Güdel, M. 2024, A&A, 683, A202 [NASA ADS] [CrossRef] [EDP Sciences] [Google Scholar]
- Xu, W., & Armitage, P. J. 2023, ApJ, 946, 94 [NASA ADS] [CrossRef] [Google Scholar]
- Xu, Z., & Bai, X.-N. 2022, ApJ, 924, 3 [NASA ADS] [CrossRef] [Google Scholar]
- Yang, C.-C., & Zhu, Z. 2021, MNRAS, 508, 5538 [NASA ADS] [CrossRef] [Google Scholar]
- Yang, C.-C., Johansen, A., & Carrera, D. 2017, A&A, 606, A80 [NASA ADS] [CrossRef] [EDP Sciences] [Google Scholar]
- Youdin, A. N., & Goodman, J. 2005, ApJ, 620, 459 [Google Scholar]
- Zamponi, J., Maureira, M. J., Zhao, B., et al. 2021, MNRAS, 508, 2583 [NASA ADS] [CrossRef] [Google Scholar]
- Zhang, K., Blake, G. A., & Bergin, E. A. 2015, ApJ, 806, L7 [Google Scholar]
All Tables
All Figures
|
Fig. 1 Snapshot of the protoplanetary disk from the R2 run of H20 at t = 109.46 kyr. Left: slice in the x-y plane with z = 0.02 AU. Right: slice in the x-z plane with y = −0.44 AU. The color denotes the density on a logarithmic scale. |
| In the text | |
|
Fig. 2 Mass evolution over time of the sink particle at the center of the R2 simulation from H20. The blue line shows the fraction M⋆/Mdisk with values indicated on the left axis, whereas the orange line shows the sink particle mass in units of solar masses, with values indicated on the right axis. |
| In the text | |
|
Fig. 3 Zoom-in on the disk from R2 of H20 in the x-z plane at t = 109.46 kyr, showing the density on a logarithmic scale. To accommodate for the disk’s shape, x and z axes are scaled differently. The gas pressure scale height, Hg, is marked by black lines. |
| In the text | |
|
Fig. 4 Gas surface density, Σgas, as a function of radial distance. The line color denotes the elapsed simulation time as indicated by the color bar, where a darker color indicates later times. Left: Calculated directly from the R2 core collapse simulation. Right: Obtained in our 1D model when starting from the first core collapse snapshot and employing the previously extracted model parameters. The dashed black line indicates the median relative error of Σgas obtained from the 1D model compared to the R2 simulation, with values indicated on the right ordinate. |
| In the text | |
|
Fig. 5 Average temperature as a function of radial distance found in R2. Different line colors indicate different simulation times according to the color bar, as in Fig. 4. |
| In the text | |
|
Fig. 6 Source term of gas entering the disk bounds in R2. Left: time derivative of the surface density caused by mass entering the disk bounds, azimuthally averaged as a function of radial distance. The ordinate is scaled linearly if the absolute value is below 10−12, but logarithmically otherwise. Line coloring like in Fig. 4. Right: total instantaneously infalling mass as a function of time. |
| In the text | |
|
Fig. 7 Torque parameters describing the dynamical evolution of the gas disk in R2, with line coloring like in Fig. 4. Left: radial profile of the internal torque parameter αSS (cf. Eq. (10)), which is scaled linearly if the absolute value is less than 10−4, but logarithmically otherwise. Right: radial profile of the external torque parameter αEA (cf. Eq. (9)) on a logarithmic scale. |
| In the text | |
|
Fig. 8 Radial profiles of model parameters describing dust properties and evolution, calculated from the disk in R2 and with line coloring like in Fig. 4. Left: radial diffusion parameter, δr (cf. Eq. (16)). Middle: vertical mixing parameter δz (cf. Eq. (17)). Right: turbulence parameter, δt (cf. Eq. (18)). |
| In the text | |
|
Fig. 9 Disk mass as a function of time, calculated directly from the R2 core collapse simulation (dashed black line) and from the surface density profiles obtained in our 1D model (blue line). |
| In the text | |
|
Fig. 10 Parameters describing the disk surface density profile according to Eq. (38) as a function of time. Fits to the profiles calculated directly from the R2 simulation are shown in dashed black lines, whereas fits to the profiles obtained in our 1D model are depicted with solid blue lines. Left: surface density at reference radial distance r = 12 AU. Middle: disk cutoff radius, describing the radial distance where the surface density starts dropping exponentially. Right: slope of the surface density profile. |
| In the text | |
|
Fig. 11 Radial location of the snow line as a function of time. The line color corresponds to the temperature scaling factor, ξ. |
| In the text | |
|
Fig. 12 TwoPopPy simulation based on R2 quantities, but with the temperature scaled by ξ = 5. The line color denotes the time in the simulation according to the color bar, with a darker color indicating a later time. Left: radial profile of the vertically integrated dust-to-gas ratio Σdust/Σgas. Right: radial profile of the pebble Stokes number St1, i.e., the Stokes number of the large grains in the two-population approximation. The dashed lines indicate the value expected from the two population model for this setup, ffStfrag. The separate dashed green line at St1 = 10−2 indicates the minimal Stokes number required for strong clumping via the streaming instability. |
| In the text | |
|
Fig. 13 Total gas (orange line) and dust (blue line) masses as a function of time for a run with temperature scaling ξ = 5. In addition, the total dust-to-gas ratio Mdust/Mgas is shown on a separate axis using a black line. |
| In the text | |
|
Fig. 14 Time average of the mass fraction of water vapor reaching the snow line via backward radial diffusion from revap = rsnow + vgasτevap (cf. Eq. (41)). It is shown as a function of the mean grain size, |
| In the text | |
|
Fig. 15 Left: pebble stokes number St1 as a function of radial distance. Right: corresponding particle size at. In this simulation, the temperature was scaled by ξ = 5, and the velocity fluctuations reduced by χ = 10. The line coloring corresponds to the simulation time according to the color bar. A darker color depicts the radial profile at a later time. The dashed lines indicate the value ffStfrag for each time. The horizontal dashed green line shows the limiting Stokes number St1 = 10−2 for planetesimal formation. |
| In the text | |
|
Fig. 16 Same as Fig. 12, but the velocity fluctuations experienced by the dust grains were reduced by a factor χ = 10. |
| In the text | |
|
Fig. 17 Total mass of planetesimals present at the end of various simulations. The simulations are based on R2 with several parameter adaptations. On the abscissa, the employed temperature scaling parameter ξ is shown, whereas the ordinate indicates the factor χ by which the velocity fluctuations experienced by the dust grains was reduced. The left panel shows the case of larger dust monomers with size a0 = 1 μm and the right panel the case of a smaller value a0 = 0.1 μm. |
| In the text | |
|
Fig. 18 Midplane dust-to-gas ratio as a function of time (ordinate) and space (abscissa). The color map was chosen such that any shade of blue corresponds to a sub-critical value, such that planetesimal formation does not occur, whereas any shade of red corresponds to a super-critical value, creating the opportunity for planetesimal formation. The critical value itself corresponds to a white color. Therefore, all regions of white or red color corresponds to areas and points in time during the simulation where planetesimal formation occurs. Furthermore, the solid green line indicates the position of the snow line. The depicted simulations have the velocity fluctuations reduced by a factor χ = 10 compared to the R2 value, and employ a monomer size of a0 = 1 μm. The left panel presents the case of a temperature scaling of ξ = 5 and the right panel of ξ = 7. |
| In the text | |
|
Fig. 19 Same as Fig. 17, but with changed model assumptions. Here, the case of |
| In the text | |
|
Fig. 20 Same as Fig. 18, but for different model assumptions. Here, we assume the absence of small grains for phase transition purposes, i.e., |
| In the text | |
|
Fig. 21 Same as the left panel of Fig. 6, but for the core collapse simulations R1 (left panel) and R7 (right panel) of H20 instead. |
| In the text | |
|
Fig. 22 Same as the right panel of Fig. 7, but for the core collapse simulations R1 (left panel) and R7 (right panel) of H20 instead. |
| In the text | |
|
Fig. 23 Total mass of formed planetesimals at the end of the simulation for runs based on the core collapse simulations R1 (top row) and R7 (bottom row). Panels on the left-hand side correspond to Fig. 17 for R2, showing the mass for fixed ε0 = 0.01 and |
| In the text | |
|
Fig. 24 Midplane dust-to-gas ratio as a function of time (ordinate) and space (abscissa). The color map was chosen like in Fig. 18, with the solid green line indicating the position of the snow line. The top row shows simulations based on the R1 core collapse simulation and the bottom row shows simulations based on R7. Panels on the left-hand side present simulations with |
| In the text | |
|
Fig. 25 Same as Fig. 16, but employing the planetesimal formation criterion by Lim et al. (2024) (see Eqs. (42), (43)) instead. |
| In the text | |
|
Fig. B.1 Mass fraction of water vapor reaching the snow line via backward radial diffusion from revap = rsnow + vgasτevap as a function of time. The panels show the cases of different |
| In the text | |
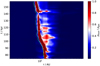 |
Fig. C.1 Same as Fig. 20, but with |
| In the text | |
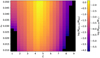 |
Fig. C.2 Same as Fig. 19, but with |
| In the text | |
|
Fig. D.1 Gas surface density Σgas as a function of radial distance. The line color denotes the elapsed simulation time as indicated by the color bar, where a darker color indicates later times. Top: Calculated directly from the R1 (left) or R7 (right) core collapse simulation. Bottom: Obtained in our 1D model when starting from the first core collapse snapshot and employing the previously extracted model parameters. |
| In the text | |
|
Fig. D.2 Average temperature as a function of radial distance found in R1 (left) and R7 (right). Different line colors indicate different simulation times according to the color bar, as in Fig. 4. |
| In the text | |
|
Fig. D.3 Same as Fig. D.2, but instead of the temperature the radial profile of the internal torque parameter, αSS (cf. Eq. 10), is shown, and is scaled linearly if the absolute value is less than 10−4, but logarithmically otherwise. |
| In the text | |
|
Fig. D.4 Radial profiles of model parameters describing dust properties and evolution, calculated from the disk in R1 (left-hand side) and R7 (right-hand side) and with line coloring like in Fig. 4. Top: Radial diffusion parameter, δr (cf. Eq. 16). Middle: Vertical mixing parameter, δz (cf. Eq. 17). Bottom: Turbulence parameter, δt (cf. Eq. 18). |
| In the text | |
Current usage metrics show cumulative count of Article Views (full-text article views including HTML views, PDF and ePub downloads, according to the available data) and Abstracts Views on Vision4Press platform.
Data correspond to usage on the plateform after 2015. The current usage metrics is available 48-96 hours after online publication and is updated daily on week days.
Initial download of the metrics may take a while.