Open Access
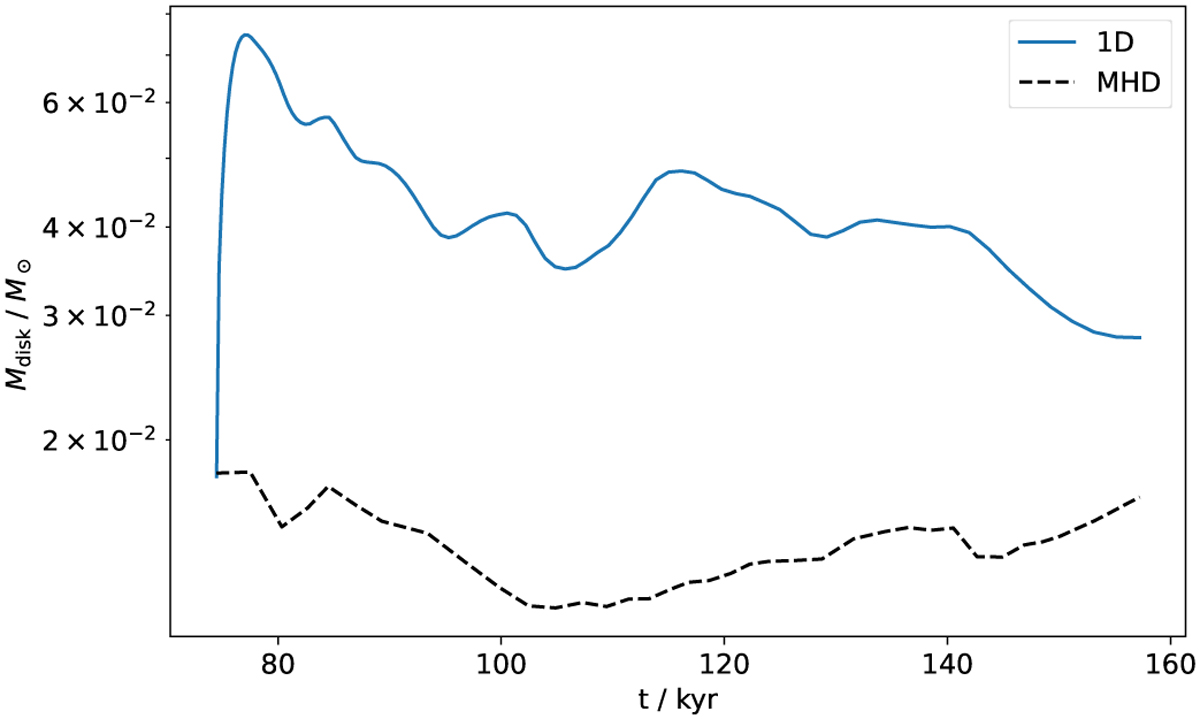
Fig. 9
Download original image
Disk mass as a function of time, calculated directly from the R2 core collapse simulation (dashed black line) and from the surface density profiles obtained in our 1D model (blue line).
Current usage metrics show cumulative count of Article Views (full-text article views including HTML views, PDF and ePub downloads, according to the available data) and Abstracts Views on Vision4Press platform.
Data correspond to usage on the plateform after 2015. The current usage metrics is available 48-96 hours after online publication and is updated daily on week days.
Initial download of the metrics may take a while.