Fig. 10
Download original image
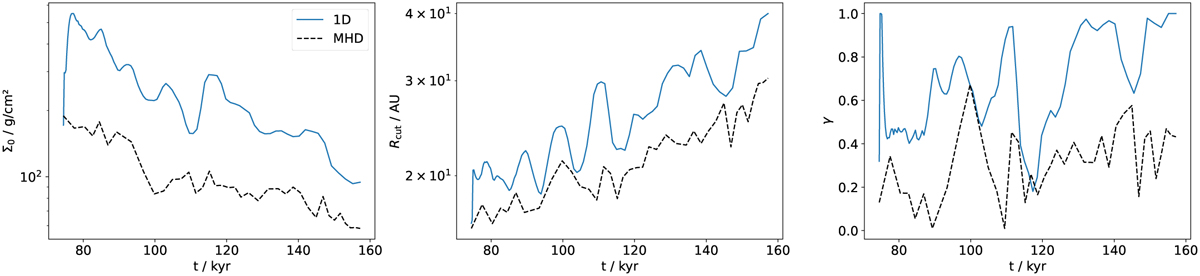
Parameters describing the disk surface density profile according to Eq. (38) as a function of time. Fits to the profiles calculated directly from the R2 simulation are shown in dashed black lines, whereas fits to the profiles obtained in our 1D model are depicted with solid blue lines. Left: surface density at reference radial distance r = 12 AU. Middle: disk cutoff radius, describing the radial distance where the surface density starts dropping exponentially. Right: slope of the surface density profile.
Current usage metrics show cumulative count of Article Views (full-text article views including HTML views, PDF and ePub downloads, according to the available data) and Abstracts Views on Vision4Press platform.
Data correspond to usage on the plateform after 2015. The current usage metrics is available 48-96 hours after online publication and is updated daily on week days.
Initial download of the metrics may take a while.