Fig. 23
Download original image
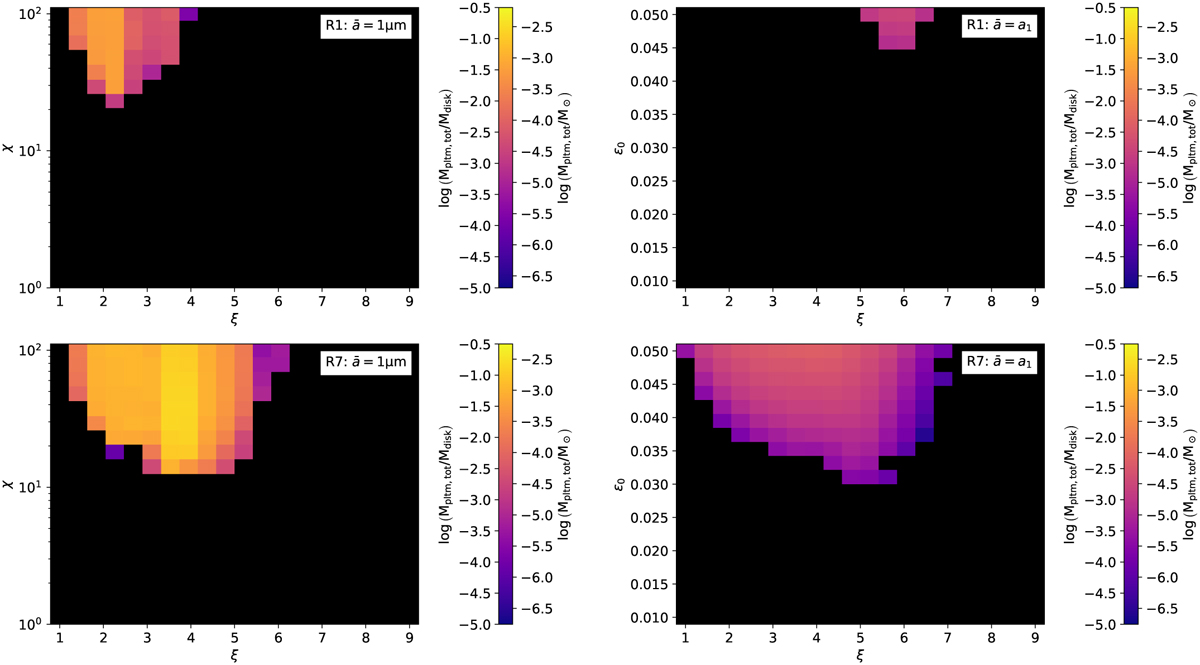
Total mass of formed planetesimals at the end of the simulation for runs based on the core collapse simulations R1 (top row) and R7 (bottom row). Panels on the left-hand side correspond to Fig. 17 for R2, showing the mass for fixed ε0 = 0.01 and ![]() = 1 μm while varying χ. The panels on the right-hand side correspond to Fig. 19 for the R2 case, showing the mass for fixed χ = 100 and no small grains (
= 1 μm while varying χ. The panels on the right-hand side correspond to Fig. 19 for the R2 case, showing the mass for fixed χ = 100 and no small grains (![]() = 1 μm) while varying ε0.
= 1 μm) while varying ε0.
Current usage metrics show cumulative count of Article Views (full-text article views including HTML views, PDF and ePub downloads, according to the available data) and Abstracts Views on Vision4Press platform.
Data correspond to usage on the plateform after 2015. The current usage metrics is available 48-96 hours after online publication and is updated daily on week days.
Initial download of the metrics may take a while.