Fig. 24
Download original image
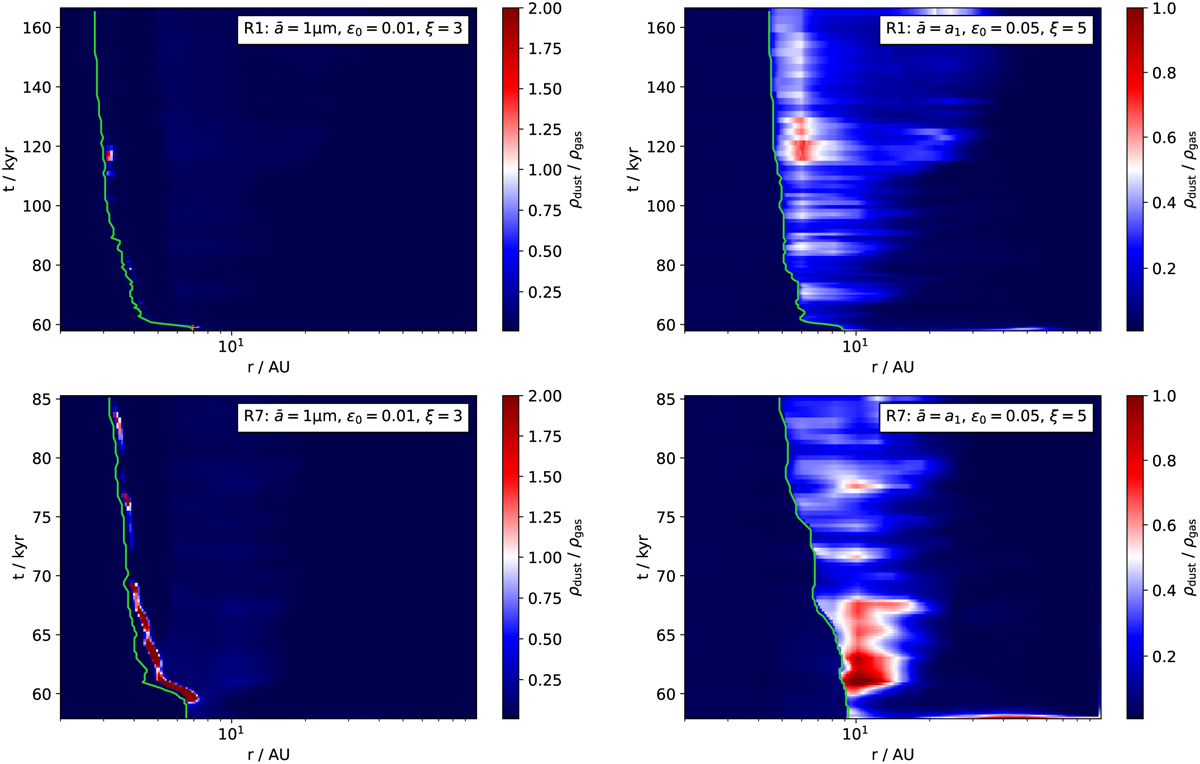
Midplane dust-to-gas ratio as a function of time (ordinate) and space (abscissa). The color map was chosen like in Fig. 18, with the solid green line indicating the position of the snow line. The top row shows simulations based on the R1 core collapse simulation and the bottom row shows simulations based on R7. Panels on the left-hand side present simulations with ![]() = 1 μm, εmid,crit = 1, ε0 = 0.01, χ = 100 and ξ = 3. This corresponds to the case discussed in Sect. 4.3 for R2. The panels on the right-hand side show simulations with
= 1 μm, εmid,crit = 1, ε0 = 0.01, χ = 100 and ξ = 3. This corresponds to the case discussed in Sect. 4.3 for R2. The panels on the right-hand side show simulations with ![]() = a1, εmid,crit = 0.5, ε0 = 0.05, χ = 100 and ξ = 5, which corresponds to the case discussed in Sect. 4.5 for R2.
= a1, εmid,crit = 0.5, ε0 = 0.05, χ = 100 and ξ = 5, which corresponds to the case discussed in Sect. 4.5 for R2.
Current usage metrics show cumulative count of Article Views (full-text article views including HTML views, PDF and ePub downloads, according to the available data) and Abstracts Views on Vision4Press platform.
Data correspond to usage on the plateform after 2015. The current usage metrics is available 48-96 hours after online publication and is updated daily on week days.
Initial download of the metrics may take a while.