Fig. 18
Download original image
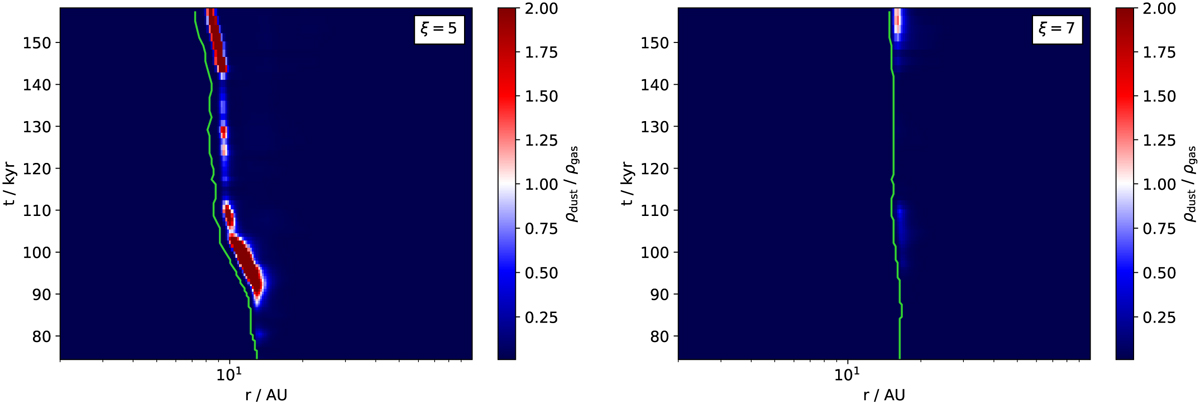
Midplane dust-to-gas ratio as a function of time (ordinate) and space (abscissa). The color map was chosen such that any shade of blue corresponds to a sub-critical value, such that planetesimal formation does not occur, whereas any shade of red corresponds to a super-critical value, creating the opportunity for planetesimal formation. The critical value itself corresponds to a white color. Therefore, all regions of white or red color corresponds to areas and points in time during the simulation where planetesimal formation occurs. Furthermore, the solid green line indicates the position of the snow line. The depicted simulations have the velocity fluctuations reduced by a factor χ = 10 compared to the R2 value, and employ a monomer size of a0 = 1 μm. The left panel presents the case of a temperature scaling of ξ = 5 and the right panel of ξ = 7.
Current usage metrics show cumulative count of Article Views (full-text article views including HTML views, PDF and ePub downloads, according to the available data) and Abstracts Views on Vision4Press platform.
Data correspond to usage on the plateform after 2015. The current usage metrics is available 48-96 hours after online publication and is updated daily on week days.
Initial download of the metrics may take a while.