Open Access
Fig. 2
Download original image
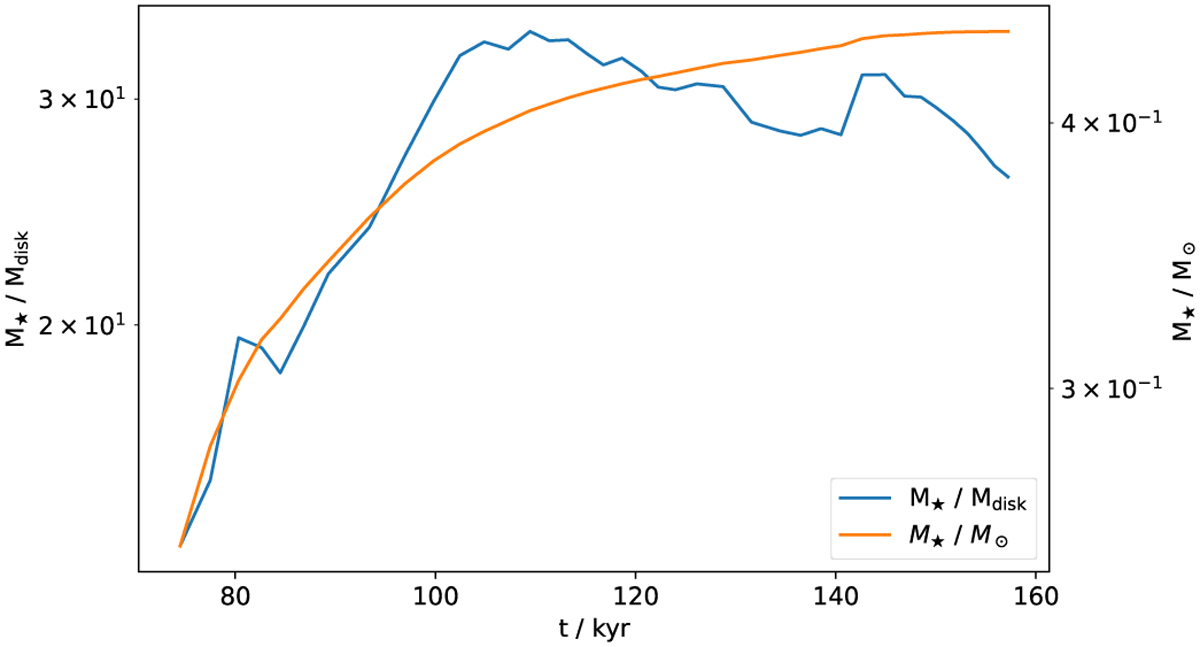
Mass evolution over time of the sink particle at the center of the R2 simulation from H20. The blue line shows the fraction M⋆/Mdisk with values indicated on the left axis, whereas the orange line shows the sink particle mass in units of solar masses, with values indicated on the right axis.
Current usage metrics show cumulative count of Article Views (full-text article views including HTML views, PDF and ePub downloads, according to the available data) and Abstracts Views on Vision4Press platform.
Data correspond to usage on the plateform after 2015. The current usage metrics is available 48-96 hours after online publication and is updated daily on week days.
Initial download of the metrics may take a while.