| Issue |
A&A
Volume 693, January 2025
|
|
|---|---|---|
| Article Number | A137 | |
| Number of page(s) | 16 | |
| Section | Stellar structure and evolution | |
| DOI | https://doi.org/10.1051/0004-6361/202452169 | |
| Published online | 10 January 2025 | |
Development of convective envelopes in massive stars
Implications for gravitational wave sources
1
Nicolaus Copernicus Astronomical Centre, the Polish Academy of Sciences, ul. Bartycka 18, 00-716 Warsaw, Poland
2
European Southern Observatory, Karl-Schwarzschild-Strasse 2, 85748 Garching bei München, Germany
3
Max Planck Institute for Astrophysics, Karl-Schwarzschild-Strasse 1, 85748 Garching bei München, Germany
⋆ Corresponding author; This email address is being protected from spambots. You need JavaScript enabled to view it.
Received:
8
September
2024
Accepted:
22
October
2024
Abstract
Context. The structure of stellar envelopes strongly influences the course and outcome of binary mass transfer, in particular of common-envelope (CE) evolution. Convective envelopes can most easily be ejected during CE events, leading to short-period binaries and, potentially, gravitational-wave (GW) sources. Conversely, radiative envelopes are thought to lead to CE mergers and Thorne-Żytkow objects (TŻOs) or quasi-stars (QSs).
Aims. Rapid binary models based on Hurley et al. (2000, MNRAS, 315, 543) often assume that any CE event with a Hertzsprung gap donor results in a CE merger, in tension with the literature. We improve on this assumption with a more self-consistent criterion based on the presence of a convective envelope.
Methods. Using 1D stellar models (MESA), we systematically investigated the development of convective envelopes in massive stars. We provided fitting formulae for rapid binary codes and implemented them into the StarTrack population synthesis code to refine the CE treatment and examined the impact on GW sources, TŻOs, and QSs.
Results. We show that convective envelopes in massive stars are highly sensitive to the treatment of superadiabacity and the mixing length. Our revised CE model significantly reduces (by a factor ∼20) the predicted merger rate of binary black hole (BH-BH) mergers with total masses between ∼20 and 50 M⊙. This leads to a bimodal mass distribution with a strong metallicity dependence. We also predict that the current TŻO–QS formation rate in the Galaxy (up to ∼10−4 yr−1), combined with their predicted lifetimes, makes their detection unlikely.
Conclusions. Our study strongly suggests that the role of CE evolution in the formation of BH-BH mergers has been considerably overestimated for BH-BH mergers with Mtot ≥ 20 M⊙. We highlight that any prediction from the CE channel for massive BH-BH mergers (> 50 M⊙) heavily hinges on our limited understanding of stellar structure and mass loss close to the Eddington limit.
Key words: gravitational waves / binaries: general / stars: black holes / stars: evolution / stars: massive
Deceased on 13 January 2024.
© The Authors 2025
 Open Access article, published by EDP Sciences, under the terms of the Creative Commons Attribution License (https://creativecommons.org/licenses/by/4.0), which permits unrestricted use, distribution, and reproduction in any medium, provided the original work is properly cited.
This article is published in open access under the Subscribe to Open model. This email address is being protected from spambots. You need JavaScript enabled to view it. to support open access publication.
1. Introduction
There is growing evidence that most massive stars are born in binaries or higher order multiples (Sana et al. 2012; Moe & Di Stefano 2017). When a star expands as a binary component, it may overflow its Roche lobe and start transferring mass onto its companion. During a mass transfer (MT) event the orbit is altered due to the combination of the mass exchange between the two binary components and the partial or complete ejection of the donor star’s envelope from the system, which removes angular momentum from the binary. Such MT events are thought to play a key role in the formation of vast classes of astrophysical objects: Algol systems (Hilditch 2001; Matson 2016), X-ray binaries (Tauris & van den Heuvel 2006; van den Heuvel 2019), stripped stars and stripped supernovae (Paczyński 1967; Vanbeveren et al. 1998; Götberg et al. 2018, 2023; Shenar et al. 2020; Drout et al. 2023), stellar mergers (Schneider et al. 2019; Hirai et al. 2021), and gravitational wave (GW) sources (de Mink & Mandel 2016; Marchant et al. 2016; Tauris et al. 2017; Belczynski & Fields 2020; Mandel & Farmer 2022). The detectable GW sources that can form via MT are close-orbit double compact objects (DCOs) that merge within the age of the Universe: binary black hole systems (BH-BH), binary neutron star systems (NS-NS) and black hole-neutron star systems (BH-NS). Within the first three observing runs the LIGO/Virgo/KAGRA (LVK) collaboration detected 76 BH-BH, 2 NS-NS, and 4 BH-NS systems (Abbott et al. 2019, 2021, 2023). DCOs at short orbital separations are potential candidates for becoming GW sources since their separation needs to be sufficiently small for them to merge within a Hubble time (∼13.6 Gyr) and potentially be a detectable LVK source. The evolution of isolated binaries through the MT channel is a promising avenue to explain, at least partially, the formation of GW sources due to the role of MT in reducing the orbital distance of massive binaries. In addition to the MT isolated binary evolution, several other channels have been proposed, such as chemically homogeneous evolution (de Mink & Mandel 2016; Marchant et al. 2016; Mandel & de Mink 2016) in isolated binaries on tight orbits, dynamical evolution in globular clusters (Spitzer 1969; Kulkarni et al. 1993; Sigurdsson & Hernquist 1993; Portegies Zwart & McMillan 2000; Rodriguez et al. 2015; Di Carlo et al. 2019), nuclear clusters (Miller & Lauburg 2009; Antonini & Rasio 2016), dynamical evolution through the Kozai-Lidov mechanism (Kozai 1962; Lidov 1962; Thompson 2011; Antonini et al. 2017) within hierarchical triples and multiples (Liu & Lai 2018; Vigna-Gómez et al. 2021), pairing and growth of stellar mass BHs in the disks of active galactic nuclei (McKernan et al. 2014; Stone et al. 2017; Samsing et al. 2022), and primordial BH binaries (Sigurdsson & Hernquist 1993; Bird et al. 2016; Ali-Haïmoud et al. 2017; Chen & Huang 2018). In this paper we focus exclusively on the MT scenario in isolated binaries.
The structure of a star that will experience Roche-lobe overflow (RLOF) is crucial to the fate of a MT episode. Generally, stars with radiative(convective) envelopes are more likely to experience stable(unstable) MT episodes. Dynamically unstable MT episodes result in a common envelope (CE) phase (Paczynski 1976; Webbink 1984; van den Heuvel 2019; Ivanova et al. 2020). The CE phase sees the envelope of the donor star engulf the entire binary system. Because of the resulting drag, the donor core and the accretor spiral inward on a dynamical timescale, leading to a drastic decrease in orbital separation. If the orbital energy of the binary is enough to gravitationally unbind the envelope, the inspiral stops and the binary becomes a short-period system: an ideal GW source candidate. Otherwise, the inspiral leads to a merger between the two objects. We define this evolutionary pathway, where stars interact through at least one CE event, as the CE channel, while we call the evolutionary pathway where binaries evolve only through dynamically stable MT events as the stable mass transfer (SMT) channel. While a CE event remains a highly complex phenomenon that we cannot fully model (Ivanova et al. 2020), several studies argue that it may only lead to close DCOs if the CE phase takes place in wide binary orbits where their donor giants have an outer convective envelope (Kruckow et al. 2016; Klencki et al. 2020, 2021; Marchant et al. 2021). This is due to the fact that extended convective envelopes (i) are loosely gravitationally bound (i.e., low binding energy Ebind) and can be ejected during a CE event, (ii) have a steep density gradient at the core-envelope boundary that sets an end point for the CE inspiral, and (iii) are thought to expand on the adiabatic timescale in response to mass loss, which makes the MT more likely to become unstable (Ivanova et al. 2013; Ge et al. 2015, 2020; Pavlovskii & Ivanova 2015). This implies that interacting binaries with donors with an extended convective envelope are more likely to initiate a CE event and then to survive it (Podsiadlowski 2001). On the other hand, radiative envelopes are centrally condensed, with minimal mass in the outer 10% of the stellar radius (Podsiadlowski 2001). If a CE event occurs in a binary with a radiative-envelope donor, the high envelope binding energy demands a substantial amount of orbital energy for a successful CE ejection, while the lack of a steep density gradient at the core-envelope boundary makes it difficult for the inspiral to halt. As a result, a CE phase initiated by a radiative-envelope giant is thought to lead to a stellar merger. A possible outcome of a CE episode is a merger between a star and a compact-object companion. One possibility is a Thorne-Żytkow object (TŻO). A TŻO is a hypothetical binary merger product with an accreting NS in the core of a nondegenerate star (Thorne & Zytkow 1975, 1977) that is predicted to manifest as a cool supergiant (Cannon et al. 1992; Farmer et al. 2023). Depending on the TŻO mass, its hydrostatic equilibrium can be sustained either through nuclear burning on or near the NS surface, or via accretion onto the NS (Eich et al. 1989; Biehle 1991). Another hypothetical object with similar formation channels is what is sometimes referred to in the literature as a quasi-star (QS), which is a rapidly accreting BH inside a nondegenerate star, where the accretion rate can exceed the Eddington limit (Begelman et al. 2008; Bellinger et al. 2023). In addition to the TŻO formation scenarios, a QS can also form through the entrapment of a primordial BH inside a protoplanetary disk, forming what is known as a Hawking star (Hawking 1971; Bellinger et al. 2023).
For this study we employed the 1D stellar evolution code MODULES FOR EXPERIMENTS IN STELLAR ASTROPHYSICS (MESA; Paxton et al. 2011, 2013, 2015, 2018, 2019) to determine the transition point at which massive stars develop outer convective envelopes. Using our detailed stellar models, we developed analytical fits, which were then implemented within the StarTrack rapid binary evolution code (Belczynski et al. 2002, 2008). Our objective is to quantify the implication of the development of convective envelopes on the outcome of CE phases within isolated binary populations, which is a key channel for forming GW sources and TŻOs/QSs. We explore two primary uncertainties: the radial expansion of massive stars and the treatment of superadiabaticity in radiation-dominated regions of stellar envelopes. We then discuss the statistical and physical properties of the population of GW sources and TŻOs/QSs, as well as the key uncertainties.
2. Methods
Here we describe the adopted 1D stellar evolution models used to study the development of outer convective envelopes (Sect. 2.1). Subsequently, we introduce the setup of our rapid population synthesis calculations that we used to compute DCO mergers and TŻOs/QSs arising from isolated binary evolution. We then explain the implementation within our population synthesis models of the analytical fits for outer convective envelope development, which we used for a preliminary determination of the outcome of CE episodes. Finally, we discuss how our models affect the formation rate and detectability of TŻOs and QSs.
2.1. 1D stellar evolution: MESA
We used MESA to develop analytical fits for the presence of an outer convective envelope, with application for rapid binary evolution codes. These fits establish a threshold effective temperature Teff, below which stars develop an outer convective envelope as a function of metallicity and luminosity. All our models consider nonrotating stars.
Development of outer convective envelopes: Following Klencki et al. (2020, 2021), we define outer convective envelopes (hereafter convective envelopes) as stellar envelopes that have convective near-surface regions that make up at least 10% of their total envelope mass. As an example, we show in Appendix A the evolution of a 50 M⊙ star at both 0.1 Z⊙ and Z⊙ until its convective envelope reaches 70% of the total envelope mass, following the models described below. We highlight that the 10% criterion is a low threshold to choose, where a small percentage of the envelope mass can be in subsurface convective zones around the opacity peaks. Additionally, the 10% convective region near the surface gets stripped quickly during MT. By making this choice we are being optimistic with regard to how many stars we can treat as convective-envelope donors in terms of CE ejection.
M_αML1.5: The first model is derived from the fits provided by Klencki et al. (2020), which come from MESA simulations made with semiconvection factor αsc = 100, step-overshooting of 0.345 for the convective core, mixing length αML of 1.5, and the Ledoux criterion to determine the convective boundaries (Ledoux 1947). We refer to this model as M_αML1.5.
M_αML1.82_MLTpp: We developed a grid of models where we employ the Ledoux criterion with step-overshooting of 0.5 (Scott et al. 2021) for the hydrogen-burning convective core, exponential overshooting of 0.01 for the other convective regions, and the Dutch wind prescription from Glebbeek et al. (2009) based on Vink et al. (2001), de Jager et al. (1988) and Nugis & Lamers (2000). Considering that αML = 1.5 does not reproduce the estimated radii of RSGs (Chun et al. 2018), we set αML = 1.82 (Choi et al. 2016) for this model. We applied these initial conditions to our simulations for two different metallicity values: Z = 0.0142 (∼Z⊙; Asplund et al. 2009) and Z = 0.00142 (∼0.1 Z⊙). For the sake of numerical stability for Z⊙ stars, we used the MLT++ (Paxton et al. 2013) method to reduce superadibaticity in regions near the Eddington limit (see Sect. 3.6 for more details). Hot wind-driven mass loss rates were calculated with the Vink et al. (2001) model for homogeneous optically thin winds. With the discovery of clumped wind behavior in OBA-type stars, the current estimates for mass loss rates were shown to be two to three times lower (Bouret et al. 2005; Šurlan et al. 2012, 2013; Sander et al. 2017; Gormaz-Matamala et al. 2021) than what is currently considered as the default in many stellar evolution models. In order to mitigate a potential overestimation of mass loss rates at high metallicities, we therefore calibrated the Z⊙ simulations by scaling down the wind mass loss by half. This was accomplished by setting the Dutch_scaling_factor to 0.51 With these models we evolved stars until the end of their core-helium burning phase.
2.2. Rapid population synthesis: StarTrack
For our study we used the StarTrack2 rapid population synthesis code (Belczynski et al. 2002, 2008) to simulate the formation and mergers of DCOs and TŻOs–QSs. The code adopts the evolutionary fitting formulae from Hurley et al. (2000), based on the stellar models by Pols et al. (1998), in order to emulate the evolution of single and binary stars for a wide array of initial conditions and physical assumptions. We also used the currently implemented stellar physics, star formation history, metallicity (we set solar metallicity at Z⊙ = 0.0142), and detectability criteria for GW sources in Belczynski & Fields (2020), with two modifications described in Sect. 2 of Olejak et al. (2020b).
Initial conditions: The primary star mass (M1) is drawn from the broken power-law initial mass function from Kroupa et al. (1993) and Kroupa (2002) between 5 and 150 M⊙, while the secondary mass star is derived from the mass of the primary times the mass ratio factor (q) from a uniform distribution q ∈ [0.08/M1; 1]. To produce the semimajor axis of the binary system, we used the initial orbital period (P) power-law distribution f(log(P/d)) ∼ log(P/d)αP (with log(P/d) ∈ [0.5; 5.5] and αP = −0.55) and a power-law initial eccentricity distribution (with an exponent αe = −0.42 within the range [0; 0.9]). These distributions are based on Sana et al. (2012) and were extended from log P = 3.5 up to log P = 5.5, following de Mink & Belczynski (2015).
Wind-driven mass loss and accretion: The stellar winds prescription adopted in StarTrack is described in Belczynski et al. (2008) with the luminous blue variable (LBV) mass loss from Belczynski et al. (2010).
Compact object remnants: We adopted the weak pulsation pair-instability supernovae and pair-instability supernovae formulation from Belczynski et al. (2016) and Woosley (2017), which limits the mass spectrum of single BHs to 50 M⊙. We also used a delayed supernova engine (Fryer et al. 2012; Belczynski et al. 2012), which affects the birth mass of NSs and BHs so that it allows for the formation of compact objects (COs) within the first mass gap (∼2–5 M⊙), with the assumption that anything beyond 2.5 M⊙ is a BH, and therefore every nonwhite dwarf degenerate object under that mass is a NS (Horvath et al. 2022). Additionally, we used a Maxwellian distribution of natal kicks of σ = 265 km s−1 during core-collapse, damped by the amount of non-ejected mass, represented by a fallback factor (Fryer et al. 2012).
Mass transfer: The adopted prescription for the accretion onto a CO both during a SMT event or from stellar winds is based on the approximations from King et al. (2001). A 50% conservative SMT is used for nondegenerate accretors (fa = 0.5) and the remaining mass (1 – fa) is dispersed in the binary surroundings with a consequent loss of orbital momentum modeled following Belczynski et al. (2008). For the stability criterion during MT (and therefore the initiation of a CE phase) we refer to Belczynski et al. (2008).
Adopted models with respective assumptions for the determination of the CE outcome prior to the αλ calculation, mixing length and density inversion treatment (with or without MLT++).
2.2.1. Common envelope
Preliminary determination of CE outcome: Prior to any estimate of the envelope binding energy and binary orbital energy, StarTrack uses the donor’s evolutionary type (based on the Hurley et al. 2000 nomenclature) to determine whether the binary will merge inside the CE or evolve through the αλ formalism. If the donor is a star in its MS, HG, or Wolf-Rayet (WR) phase, the system is always assumed to merge during a CE phase (Belczynski et al. 2008). The assumption that HG donors lead to a CE merger was motivated by the fact that a strong density gradient is needed at the core-envelope boundary to stop the inspiral. It was suggested that the CHeB phase may be a good proxy for such a gradient, with HG donors instead having a more continuous density distribution in which the dynamical inspiral would never stop (Belczynski et al. 2010). However, the definitions of the core-envelope boundary and the HG phase are both unclear (e.g., Deloye & Taam 2010; Marchant et al. 2021), and it has been argued that the HG versus CHeB distinction in the Hurley et al. (2000) types is not a good proxy for the presence of a density drop (Kruckow et al. 2016; Klencki et al. 2020, 2021; Marchant et al. 2021). The steep core-envelope density gradient, as well as envelope binding energies sufficiently low for unbinding, are instead a characteristic feature of stars with deep convective envelopes (e.g., Dewi & Tauris 2000; Tauris & Dewi 2001; Vigna-Gómez et al. 2022). Stars with radiative envelopes are generally less evolved and more centrally condensed, unlike stars with convective envelopes. This makes the ejection of convective envelopes possible according to the αλ formalism (Kruckow et al. 2016; Klencki et al. 2020, 2021; Marchant et al. 2021). We therefore used the presence of a convective envelope criterion as a preliminary check to quickly determine the fate of CE events prior to any calculations for CE evolution.
CE evolution: We used the αλ energy formalism (Webbink 1984; Livio & Soker 1988; de Kool 1990) to calculate the outcome of CE events initiated by convective donors. We adopted 100% efficiency of the orbital energy transferred (αCE = 1) into the envelope. The binding energy model is from Dominik et al. (2012), where the λCE parameter was fit to include internal energy in the energy budget and is meant to be an average between the λb and λg prescriptions presented in Xu & Li (2010b,a). In successful CE events, the entire envelope of the donor star is assumed to be ejected from the binary. The accretion during CE events is zero with stellar accretors and 5% the Bondi rate with CO accretors (MacLeod et al. 2017).
2.2.2. Convective envelope threshold in StarTrack
In our models for the determination of the outcome of CE events, we did not check for the evolutionary stage of the giant donor, as it is for our reference model, which we refer to as M0. We only checked whether, according to the fits derived from the MESA tracks described in Sect. 2.1, the donor’s effective temperature (Teff) is below the threshold for the development of a convective envelope. If the donor star has a convective envelope, the binary evolves through the αλ Webbink (1984) and Livio & Soker (1988) formalism. If not, the outcome of the CE episode is that the binary system merges. In M_αML1.82_MLTpp, only two metallicities were considered from the MESA simulations. For Z < 0.5 Z⊙ (Z ≥ 0.5 Z⊙), we used the fits from the MESA tracks at Z = 0.1 Z⊙ (Z⊙ with reduced wind mass loss rates and MLT++).
2.2.3. Summary of the StarTrack models
We list below all the models that we adopted in StarTrack to calculate the physical properties of binary populations (Table 1), where we investigated different assumptions for the development of convective envelopes and the preliminary determination of the outcome of CE events.
M0: Our reference model. This model is the only one where we determine the outcome of a CE event via the evolutionary type of the donor star rather than the envelope type. This means that prior to the CE evolution calculations through the αλ formalism, any massive binary at the onset of a CE phase with a donor star in its MS, WR, or HG phase does not expel the CE and face a merger event3.
M_αML1.5: We adopted the fits from Klencki et al. (2020) for the development of convective envelopes. If at the onset of a CE envelope the donor star has a radiative envelope, it will lead the binary to a merger. Otherwise, the evolution of the binary will follow the αλ formalism.
M_αML1.82_MLTpp: We used the fits from the MESA models described in Sect. 2.1 to determine the presence of a donor star with a convective envelope.
RMAX submodels: The stellar tracks from Hurley et al. (2000) may be overestimating the radial expansion of massive stars (Gräfener et al. 2012; Agrawal et al. 2022a,b; Romagnolo et al. 2023). To circumvent this, we explored model variations in which the expansion of stars in StarTrack is limited, guided by detailed stellar models (see Romagnolo et al. 2023 and Appendix B for details). We therefore introduced submodels M0RMAX, M_αML1.5RMAX, and M_αML1.82_MLTppRMAX.
2.3. Population estimates of Thorne-Żytkow objects and quasi-stars in the Galactic disk
It is still unclear whether a NS or a stellar-mass BH can sink down to the center of a massive star without tidally disrupting the core first (e.g., Metzger 2022; Hutchinson-Smith et al. 2023; Everson et al. 2024). In this study we assume that every merger outcome of a CE episode with a CO accretor results in the assembly of a TŻO/QS.
TŻOs lifetimes: The lifetime of a TŻO was shown by Farmer et al. (2023) to be proportional to its mass. However, the parameter space only covered masses between 5 and 20 M⊙. We addressed this by linearly interpolating lifetimes within this range based on reported values for τmin (MTZO ∼ 5 M⊙) and τmax (MTZO ∼ 20 M⊙). For higher and lower masses, we extrapolated these values. To account for uncertainties in red supergiant (RSG) pulsations, we explored two scenarios: (i) the weak RSG pulsation scenario, where weak pulsation-driven mass loss allows the TŻOs to live longer (τmin = 5 × 10⁴ yr; τmax = 2 × 10⁵ yr; τTZO = 104MTZO yr), and (ii) the strong RSG pulsation scenario (following Yoon & Cantiello 2010 mass loss rates and implications from Farmer et al. 2023), where extreme mass loss rates due to strong RSG pulsations lead to lower lifetimes (τmin = 102 yr; τmax = 103 yr; τTZO = 6×101MTZO − 2 × 10² yr). For instance, Nathaniel et al. (2025) use a different prescription for τTZO (see Appendix C for a comparison between their τTZO model and ours). They fit the weak RSG pulsation lifetimes from the Farmer et al. (2023) results and assume flat τTZO values outside the 5–20 M⊙ range. In contrast, we linearly interpolated between τmin and τmax, followed by extrapolation for higher and lower TŻO masses.
QSs lifetimes: Bellinger et al. (2023) show that the lifetime of QSs τQS might be correlated, at least for MS stars with an accreting BH in the center, to the mass ratio M/MBH between the nondegenerate component and the BH. Their study focuses on a wide array of QSs, also referred to as Hawking stars, arising from primordial BHs of even substellar masses, where the M/MBH ratio can be considerably high. In contrast, our study focuses on QSs formed from stellar-mass BHs. Here we therefore adopted a simplified approach, assuming that the lifetime of these QSs depends primarily on their total mass. We utilized the same mass dependence described for TŻOs under the weak and strong red supergiant (RSG) pulsation scenarios to estimate their lifetimes.
Galactic disk model: The disk has an estimated total mass of (5.17 ± 1.11) × 1010 M⊙ (Licquia & Newman 2015). We made the same assumptions for initial conditions that were discussed in Olejak et al. (2020a): the thin disk evolution, which accounts for 90% of the disk mass, is approximated by ten star formation episodes, which started 10 Gyr ago and lasted until the present time. Each episode lasts 1 Gyr, with a constant star formation rate (SFR) of ≈5 M⊙ yr−1. Using the metallicity-age relation from Haywood et al. (2013), the formation episodes start at an initial metallicity of Z = 0.1 Z⊙ 10 Gyr ago, which increases by 0.1 Z⊙ at each consecutive formation episode until it reaches Z⊙ during the last 1 Gyr. Since in both the strong and weak RSG pulsation scenarios TŻOs and QSs have lifetimes that are orders of magnitude less than 1 Gyr, we can assume that none of them can come from the thick disk since the contribution of stars younger than 9 Gyr in this region can be considered negligible (Cariulo et al. 2004; Cignoni et al. 2006). The only star formation episode that is of interest to us is the most recent one at Z⊙ in the thin disk. All the initial conditions are the same of the GW population simulations described in Sect. 2.2. We rescaled a synthetic population of 400 000 binaries to the stellar mass of the last 1 Gyr formation history in the thin disk and randomized the formation age along the look-back time (uniform distribution) of each binary to check if each of our synthetic TŻOs–QSs (i) had enough time to form and (ii) is young enough to still be present in the Galaxy.
3. Results and discussion
3.1. M_αML1.82_MLTpp: Convective envelope boundary
Figure 1 shows a Hertzsprung-Russell (HR) diagram with the position of stars from our MESA simulations (Sect. 2.1) at which they first develop convective envelopes. We then fit their HR position to establish a threshold effective temperature Teff (in units of K) as a function of stellar luminosity (in units of L⊙) at which massive stars develop convective envelopes. For 0.1 Z⊙, we fit the threshold
 (1)
(1)
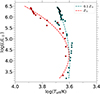 |
Fig. 1. HR diagram with the positions of stars from our MESA models where they develop convective envelopes for metallicities Z = 0.1 Z⊙ (teal) and Z = Z⊙ (red). Their respective fits (Eqs. (1) and (2)) are represented by the dashed lines. |
and for our Z⊙ models
 (2)
(2)
In Fig. 1 we compare these fits (Eqs. (1) and (2)) with the MESA models from which they were developed. For the fit from the Z⊙ tracks we obtain a χ2 value of 0.0031, while for those at 0.1 Z⊙ we obtain χ2 = 0.0034.
Picker et al. (2024) recently proposed a method to identify stars that have developed convective envelopes, assuming a constant Teff boundary for all masses and luminosities at a given metallicity. This method was adopted for a grid of MESA models with MZAMS up to 30 M⊙ with the assumption of no wind-driven mass loss. In contrast, our study examines how Teff depends on stellar luminosity via two models adopting different assumptions for internal mixing, wind mass loss, and superadiabaticity, and MZAMS up to 100 M⊙. Our models reveal a significant dependence of the Teff boundary for convective envelope formation on stellar luminosity (see also Fig. 6 from Klencki et al. 2020, which brought similar results), in particular for tracks where density inversion suppression was enforced via MLT++ (details in Sect. 3.2). Our assumptions allow us to develop criteria for convective envelope formation that account for the influence of stellar luminosity without the need to extrapolate for MZAMS up to 100 M⊙.
3.2. Yields of the CE channel
Evolutionary stage versus envelope type: Figure 2 shows two HR diagrams with the log Teff boundaries from M_αML1.82_MLTpp and M_αML1.5. In each plot we show the HR position of the CE donors with a BH accretor from two synthetic populations of 400 000 binaries each, respectively at Z = 0.1 Z⊙ and Z = Z⊙. We plot HG and CHeB donors within binaries that evolve past the CE phase and become BH-BH determined solely based on the αλ prescription. The HG and CHeB donors are shown in the plots with blue and green dots. We clarify that our presentation of the evolutionary stages of massive stars follows from the nomenclature of stellar types introduced by Hurley et al. (2000). We make this distinction because in our default M0 model it is assumed that HG donors do not lead to CE ejection, and only the stars depicted in green in Fig. 2 can lead their binary to evolve into BH-BH systems through the CE channel. In Models M_αML1.5 and M_αML1.82_MLTpp, instead of distinguishing between HG and CHeB stellar types, we use the envelope type to determine the outcome of CE events. Only donors on the right-hand (the cooler) side of the dashed lines are allowed to survive the CE phase and potentially become GW sources.
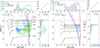 |
Fig. 2. HR diagram position of the donor stars at the onset of a CE event with a BH accretor at Z = 0.1 Z⊙ (left) and Z⊙ (right), with six evolutionary tracks for single stars at MZAMS = 20, 40, 60, 80, 100, and 150 M⊙ for M0 (black dashed line) and M0RMAX (black solid line). The gray dots represent the CE events with a BH companion that lead to a stellar merger and the potential formation of a QS, while the blue and green dots represent respectively HG and CHeB stars (i.e., evolutionary types in StarTrack, following Hurley et al. 2000) in binaries that successfully expel the CE and become BH-BH. The red and blue lines represent the threshold for respectively M_αML1.5 and M_αML1.82_MLTpp, where a star becomes cold enough to develop a convective envelope. The horizontal purple dotted line represents the luminosity threshold beyond which we extrapolate the convective boundary tracks. We plot the distributions of log Teff and log L values of donors that have led to the CE mergers (in gray) or to CE ejections and the formation of BH-BH systems (in green or blue, depending on the donor evolutionary type in StarTrack). In the right panel there is a near-complete overlap between the BH-BH progenitor binaries and the ones that become GW sources. The dashed-line histograms correspond only to BH-BH systems that merge within a Hubble time. |
CE donors at Z = 0.1 Z⊙: According to the convective envelope boundary defined in Eq. (1), roughly 82% and 87% (respectively, from M_αML1.82_MLTpp and M_αML1.5) of the BH-BH mergers from model M0 originate from systems that initiate a CE phase with a radiative-envelope donor (left panel of Fig. 2). In models M_αML1.5 and M_αML1.82_MLTpp those systems are predicted instead to merge during the CE phase and produce a TŻO–QS. On the other hand, we note that above ∼80 M⊙ the Hurley et al. (2000) HG donors can develop convective envelopes. This effect reshapes the predicted BH-BH total mass distribution (Sect. 3.3 for more details) and contributes toward a higher yield of GW sources from the CE channel with respect to the M0 model. The difference between the M_αML1.5 and M_αML1.82_MLTpp Teff thresholds is due to the different assumptions for αML, with αML = 1.82 finding better support in the derived Teff of RSGs (Chun et al. 2018). The higher the αML parameter, the wider the convective regions, which means a more massive convective envelope. This in turn means that stellar envelopes reach the threshold for 10% of their mass to be convective at higher Teff values (i.e., earlier in their evolution).
CE donors at Z = Z⊙: Compared to the Z = 0.1 Z⊙ population, fewer CE events are initiated with a BH accretor at this metallicity, regardless of whether the donor is a HG or CHeB star. This is particularly evident in the right-hand histograms of Fig. 2. For log L < 6.0, within our synthetic population, 132 and 1091 CE events leading to BH-BH mergers occur respectively at Z⊙ and 0.1 Z⊙. Beyond log L = 6.0, instead, 252 at Z⊙ and 346 at 0.1 Z⊙ of CE events are initiated with a significant contribution of highly luminous and cool HG donors. In M0 these donors merge with their BH accretor within the CE due to the criterion based on evolutionary type. At 0.1 Z⊙ many such donors have radiative envelopes, and therefore end up as CE mergers also in the updated models. In contrast, at Z⊙ and with MLT++, these donors develop convective envelopes. MLT++ mitigates superadiabaticity in stellar envelopes nearing the Eddington L/M limit, which is particularly important for (very) massive stars as the L/M ratio increases with mass (see details in Sect. 3.6). This method reduces the temperature gradient (Klencki et al. 2020; Agrawal et al. 2022a), resulting in hotter smaller supergiants. The inclusion of such luminous HG donors at Z⊙ plays an important role when comparing the merger yield and BH-BH merger properties between different models (see Sects. 3.3 and 3.4).
Effect of limiting radial expansion: Romagnolo et al. (2023) showed that interpolating Hurley et al. (2000) evolutionary tracks at ∼0.1 Z⊙ can overestimate radial expansion up to one order of magnitude if compared with 1D stellar evolution models. In M_αML1.5RMAX and M_αML1.82_MLTppRMAX we circumvent this by restricting the maximum radial expansion of massive stars in StarTrack. This in turn prevents some of the wide binaries in our population from interacting in CE events. This limitation affects mainly those stars that develop a convective envelope, since they can only develop it, in terms of Teff, relatively near their maximum expansion. This is noticeable in Fig. 2, where for log L < 5.7 the bifurcation point between M0 (dotted lines) and M0RMAX (solid lines) is close to the Teff thresholds for convective envelope development (red and blue lines). At log L ≳ 5.7 and Z = Z⊙, instead, M_αML1.5 shows that the bifurcation point is at considerably higher Teff values than is needed for a star to develop a convective envelope. This means that the initiation of CE events that are ejected by their binaries is predicted to occur in the parameter space where the degree of stellar expansion is rather uncertain.
3.3. Masses, spins, and merger rates of GW sources
In the local Universe (redshift z ∼ 0.2) the LVK collaboration reports within a 90% credibility interval a merger rate density of 17.9–44 Gpc−3 yr−1 for BH-BH, 7.8–140 Gpc−3 yr−1 for BH-NS and 10–1700 Gpc−3 yr−1 for NS-NS (Abbott et al. 2019, 2021, 2023). For BH-BH mergers the mass distribution was shown to have substructures that cannot fit a single power law, due to two local peaks at ∼10 and 35 M⊙ (Abbott et al. 2021). Abbott et al. (2021) inferred the BH-BH effective spin distribution to have a mean centered at ∼0.06.
The contribution of the CE channel to the observed population of GW sources is still uncertain (Mandel & Broekgaarden 2021; Belczynski et al. 2022). With the revised treatment of CE evolution many binaries that evolve into GW sources in M0 do not expel the CE and instead merge inside of it. In the following paragraphs we explore how this assumption changes the estimated merger rate densities within redshift z < 0.2 (Table 2).
Double compact object local merger rate densities [Gpc−3 yr−1].
M_αML1.5 local merger rates: We find a significant reduction in the merger rates of BH-BH and NS-NS systems, by a factor of ∼5 (22 in the RMAX variation) and 22, respectively. This stems from the fact that in the prior models, most of the CE events leading to GW sources would be initiated by radiative-envelope donors, particularly at low metallicity (Fig. 2). With the revised treatment of CE evolution, these events are instead predicted to result in CE mergers and TŻO–QS formation, leading to a considerable reduction in the number of GW sources. The further decline of the BH-BH merger rate in the RMAX variation by an additional factor of ∼4 is due to the fact that in massive stars an outer convective envelope only develops when the star is already expanded close to its maximum radius. How much further a star expands from that point is uncertain, particularly in the regime of stars above 40 M⊙. In the RMAX variation, the radial expansion along the convective branch in partly quenched (mostly by cool supergiant winds), decreasing the parameter space for CE evolution and GW-source formation. This effect is mass dependent, showing significant impact on the rate of BH-BH mergers, but little effect on NS-NS and BH-NS source formation.
M_αML1.82_MLTpp local merger rates: In the variation with the assumed mixing length of αML = 1.82, stars develop a convective envelope earlier and at smaller radii (and higher Teff). This enlarges the parameter space for CE evolution from convective donors and leads to a smaller decrease in the merger rate of NS-NS and BH-BH sources compared to the M_αML1.5 model: by a factor of ∼7 and ∼1.5 (in the RMAX variation), respectively. Surprisingly, we discover a slight increase in the rate of BH-BH mergers in the non-RMAX variation, up to ∼100 Gpc−3 yr−1. This effect is due to fact that in the revised CE treatment we model CE evolution from any convective donor, no matter their evolutionary stage. In the past models the CE events initiated by HG giants (according to evolutionary types in the stellar track fits by Hurley et al. 2000) were assumed to always lead to CE mergers. Here, we find that many such stars in the ≳40 M⊙ are in fact convective-envelope giants, and therefore ideal candidates for the CE channel (see Fig. 2). As a result, in all the updated models we find an increase in the predicted merger rate of the most massive BH-BH mergers (see Sect. 3.2 for details). In the M_αML1.82_MLTpp specifically, this increase is so significant that it leads to the net increase in the local BH-BH merger rate when all the masses are considered. This occurs because in this model the Teff threshold for the formation of a convective envelope in stars above ∼30 M⊙ shifts to higher Teff values (and smaller stellar radii, enlarging the parameter space for CE evolution) due to the inclusion of MLT++ in the MESA tracks computed at Z⊙ metallicity. As a result, the CE channel yield increases significantly for high-metallicity progenitors. As we discuss below, this has an impact for the predictions of how the merger rate evolves with redshift.
BH-BH merger rate evolution with redshift: Figure 3 shows the merger rate evolution with redshift, revealing a significant variation between models. Between z = 2 and z = 10 M0 shows a slope of log(merger rate density) ≈ −0.10, while the slopes for M_αML1.5 and M_αML1.82_MLTpp within the same redshift range are roughly −0.25 and −0.36, respectively. The differences are due to changes in the yield of the CE channel for different metallicities. As discussed above, in the M_αML1.82_MLTpp model the parameter space for CE ejection is particularly large at high metallicities, guided by the MESA tracks computed at Z⊙. As a result, most of the BH-BH mergers in M_αML1.82_MLTpp originate from stars formed with Z > 0.5 Z⊙, which are more common at low redshifts. This leads to an increase in the merger rate density at z < 2 compared to the M0 model and a steeper decrease in the rate at z > 2. In M_αML1.5, on the other hand, the net effect of the revised CE criterion is similar for all the metallicities, with a slightly smaller rate decrease relative to M0 at high Z (due to the inclusion of convective HG donors).
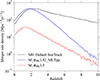 |
Fig. 3. BH-BH merger rate distribution as a function of redshift. The influence of more optimistic assumptions for convective envelope formation at high metallicities for M_αML1.82_MLTpp noticeably increases the merger rates for the local Universe. |
Mass distribution: Figure 4 shows the distribution within redshift 2 of BH-BH mergers, and the primary and secondary BH mass. Both M_αML1.82_MLTpp and M_αML1.5 show a bimodal distribution of total masses that is similar to what is seen in the LVK observations and that M0 does not present (Abbott et al. 2019, 2021, 2023). M_αML1.5 brings the reduction in BH-BH mergers to a total mass of ∼50 M⊙. Beyond that mass, convective-envelope donors are predominantly of the HG type, leading to an increase in the number of CE events. On the other hand, M_αML1.82_MLTpp predicts a distribution of masses for BH-BH mergers that peaks around 30 and 55 M⊙. The former total mass is remarkably close to the reported mass of Gaia BH3 (Gaia Collaboration 2024). This coincidental result raises a question of whether BH systems such as Gaia BH3 can be a product of two merging BHs or two close BHs in an inner binary.
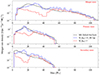 |
Fig. 4. Mass distribution of the BH-BH mergers within redshift 2. In the different panels we show the total mass (top) as well as the masses of the most (middle) and least (bottom) massive BH in the binary. |
Spin distribution: Figure 5 shows the spin distribution for the BH-BH merger according to our models. While both M0 and M_αML1.82_MLTpp models exhibit a distribution extending to positive values due to tidal interactions between WR stars and BHs (Belczynski & Fields 2020; Olejak et al. 2020a; Bavera et al. 2022), M_αML1.5 lacks a significant population of high-spin mergers. This is due to the reduced formation rate of WR-BH binaries with sufficiently close orbits capable of producing substantial tidal spin-up. In contrast, most BH-BH mergers with effective spins below 0.15 originate from binaries retaining primordial angular momentum rather than acquiring spin from WR-BH interactions (Olejak et al. 2020a, 2024). The uncertainties surrounding CE parameters (αCE and λCE) hinder precise predictions of post-CE orbital separations, making it challenging to definitively distinguish between WR-BH binaries that undergo significant spin-up and those that do not. Alternative channels such as the SMT scenario can contribute to the observed effective spin distribution (Pavlovskii et al. 2017; Gallegos-Garcia et al. 2021; Olejak et al. 2021, 2024; Broekgaarden et al. 2022; Dorozsmai & Toonen 2024).
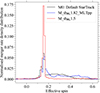 |
Fig. 5. Normalized spin distribution of the BH-BH mergers within redshift 2. The reference M0 model for StarTrack and M_αML1.82_MLTpp show a spread to positive values, while M_αML1.5 concentrates uniquely on the peak at 0.15. |
3.4. Relation between BH-BH mass and progenitor metallicity
In Fig. 6 we show within redshift 2 (z < 2) the relation between BH-BH merger rate density, total mass, and initial metallicity of the progenitor binaries.
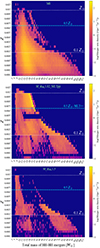 |
Fig. 6. BH-BH total mass distribution within redshift 2 as a function of metallicity for M0 (top), M_αML1.82_MLTpp (middle), and M_αML1.5 (bottom). The dashed cyan line represents the metallicity threshold beyond which the formation of a convective envelope is estimated from the MESA tracks using MLT++ for M_αML1.82_MLTpp (see details in Sect. 3.6). |
M0 Most of the contribution comes from the low-mass end of the BH-BH mergers and from metallicities Z ≲ 0.5 Z⊙. The BH-BH total mass peaks at ∼21 M⊙ with no significant metallicity-dependent shift.
M_αML1.82_MLTpp: In contrast to M0, the peak of the mass distribution shifts toward more massive mergers (see also Fig. 4). This trend exhibits a metallicity dependence. The key here is the inclusion of binaries containing HG donors with convective envelopes in our model. Figure 2 shows that only the most massive or luminous donors (i.e., with a more massive core) can develop a convective envelope during their HG phase, which explains the contribution to more massive BH-BH mergers. The MLT++ method broadens the parameter space for CE ejection, significantly boosting the contribution to the BH-BH merger rate for Z ≥ 0.5 Z⊙.
M_αML1.5: Compared to M_αML1.82_MLTpp we show a decrease in BH-BH mergers at Z < 0.5 Z⊙. This difference stems primarily from the varying αML values between the models. However, a more significant disparity emerges in the BH-BH merger rates at Z ≥ 0.5 Z⊙. Here, M_αML1.5 shows a drastic decline in BH-BH mergers of mass between ∼21 M⊙ and 50 M⊙. While the αML difference still contributes, the primary driver for this sharp drop is the choice not to suppress density inversion effects with MLT++ in super-Eddington regions of stellar envelopes at these metallicities. This distinction is reflected in the considerably different Teff thresholds seen in the right panel of Fig. 2.
Almost no BH-BH mergers at Z ≳ Z⊙: In all models we find a nearly total absence of BH-BH mergers at Z ≳ Z⊙, which was also reported in other population studies (e.g., Belczynski et al. 2010; Cason et al. 2024). We consider that a contributing factor for this phenomenon might be metallicity-dependent wind-driven mass loss, which narrows the MZAMS range at which a collapse into a BH happens to only the most massive (and therefore rarest) stars.
3.5. Formation of TŻOs and QSs
For each of our models (Sect. 2.3) we extrapolate our synthetic population of TŻOs–QSs to encompass the whole latest star formation event in the Galactic disk. We estimate the numbers of TŻOs and QSs and their formation rates (Table 3). We show the almost complete absence of TŻO–QS in the Galactic disk for the strong RSG pulsation scenario. For the weak RSG pulsation scenario the TŻO and QS population increases for all the models, but never goes beyond 23 and 8 objects, respectively. At Z⊙ we predict a formation rate of 2–3 × 10⁻⁴ yr−1 for TŻOs, which is comparable to the results from the literature (Cannon 1993; Podsiadlowski et al. 1995; Hutilukejiang et al. 2018; Nathaniel et al. 2025). This suggests that even under optimistic assumptions their low formation rate, in addition to their short lifetimes, makes their detectability unlikely. In addition, Farmer et al. (2023) predicts that TŻOs can be observationally distinguishable from RSGs only at low metallicities (Z < 10−3), which are rare in the considered star-forming population of the Galactic disk.
Estimated population of Thorne-Żytkow objects (TŻOs) and quasi-stars (QSs) in the Galactic thin disk at the present time, and the respective formation rate at Z⊙.
Possible overestimation of the lifetimes of QSs We note that assuming that the timescale relation for TŻOs is also valid for QSs is a speculative approach. The accretion-induced radiation pressure may completely block nuclear burning inside a QS due to the cooling of stellar interiors (Bellinger et al. 2023). Once the photospheric temperature drops to a specific threshold, which is a function of metallicity, the opacity drastically decreases, and in turn the temperature reaches a condition at which no hydrostatic solution can be found for the QS convective envelope. After this temperature is reached, QSs may quickly disperse by radiation pressure (Begelman et al. 2008), which would further narrow the temporal window during which such objects are detectable. On the other hand, (Bellinger et al. 2023) showed that at high Mstar/MBH ratios the lifetime of a QS is almost unchanged if compared with a non-QS MS star of the same mass. We nevertheless argue that this case would only be likely for Hawking stars (Hawking 1971; Bellinger et al. 2023), which are QSs with a primordial BH in their center that can be of subsolar mass. In the case of QSs formed from massive binaries during a CE event, the lifetimes cannot be as high because the central BHs are at least 2.5 M⊙ and because most CE events with a BH accretor in the population are initiated with a post-MS donor star. Considering the number of QSs that we estimate reside in the Galaxy (one at most; see Table 3), it is unlikely that such objects can be detected. However, QSs outside our Galaxy may be potentially detected through X-ray observations in the case of a thin-envelope QS where a BH efficiently accretes mass through a disk (Hutchinson-Smith et al. 2023). This disk provides accretion support to the optically thin envelope, and such an object can be observed as an ultraluminous X-ray source (Everson et al. 2024). Even if thin-envelope QSs existed, at the moment there is no understanding as to how we could distinguish them from other ultraluminous X-ray sources.
3.6. Uncertainties in 1D modeling of stellar envelopes
Stellar expansion: One-dimensional stellar models have inherent uncertainties. For instance, Gräfener et al. (2012), Agrawal et al. (2022a,b) and Romagnolo et al. (2023) showed how different assumptions about stellar physics and the use of different evolutionary codes can lead to significantly diverging results for stellar envelope expansion. In particular, the evolution of stars at MZAMS ≳ 50 M⊙ remains poorly constrained, with radial expansion that can change by orders of magnitude (Romagnolo et al. 2023). This effect is considerable in the fitting formulae used in our population synthesis models (Hurley et al. 2000) since we extrapolate them for any star above 50 M⊙ and interpolate them for any metallicity different from the ones used in the Pols et al. (1998) tracks (Z = 0.0001, 0.0003, 0.001, 0.004, 0.01, 0.02, and 0.03). For even more massive stars, it has been shown that stars at MZAMS ≳ 100 M⊙ and Z ≳ Z⊙ only display a moderate or negligible expansion due to the combined effect of strong winds and efficient internal mixing (e.g., Maeder & Meynet 1989; Ekström et al. 2012; Yusof et al. 2022; Bavera et al. 2023; Romagnolo et al. 2024; Vink et al. 2024). Choosing these models as the baseline for our estimates would likely have considerably narrowed the window for massive binaries to start or evolve past CE events and become GW sources. A major source of uncertainty for stellar radius evolution is the Humphreys–Davidson (HD) limit (Humphreys & Davidson 1994). This limit marks a zone in the HR diagram where stars are rarely, if ever, observed (Humphreys & Davidson 1979, 1994; Ulmer & Fitzpatrick 1998; Davies et al. 2018). This boundary seems to be a HR region where many RSGs with convective envelopes are predicted to be (see Figs. 2 and B.2 and, e.g., Gilkis et al. 2021). This may indicate that stars do not expand enough to enter that HR region, which can be an important calibration point for stellar models.
Convective envelope development: In terms of the formation of convective envelopes model uncertainties are large as well. The major difference between M_αML1.5 and M_αML1.82_MLTpp, at least at high metallicities, depends on the treatment of convection in superadiabatic envelopes nearing the Eddington limit. This phenomenon is associated with the presence of subsurface opacity peaks arising from the ionization of iron or helium (depending on the surface temperature, Cantiello et al. 2009; Jermyn et al. 2022), combined with low density. When the peak is located deep within the star, convection operates efficiently. This efficient convection can redistribute material within the star, leading to a nearly constant entropy profile and eliminating the density inversion. However, if the iron opacity peak is situated in an outer low-density envelope region, the convective flux becomes less effective. The 1D stellar structure adjusts accordingly, leading to (possibly artificial) density inversions. These subsurface effects affect the global properties of the star (e.g., radius and temperature) and in turn the Teff threshold for convective envelope development explored in this paper. Three-dimensional simulations by Jiang et al. (2015) suggest that stellar engineering solutions (MLT++ or use_superad_reduction; Jermyn et al. 2023) to suppress density inversion might only be motivated for subsonic turbulence in convective layers. This is because shocks can form in these regions, leading to density fluctuations that methods such as mixing length theory (Böhm-Vitense 1958) cannot handle (Joyce & Tayar 2023). This means that in 1D models it is still unclear how and when density inversion should be artificially suppressed. Regardless of whether (and when) density inversion is a realistic phenomenon within near-Eddington regions of stellar envelopes or just an artifact of 1D stellar models, one of the major implications arising from its suppression is a steeper temperature gradient, which leads to the formation of a convective envelope at smaller radii. This can be seen in Fig. 2 for the Z⊙ plot. The blue line from M_αML1.82_MLTpp, which represents the MESA model with a density suppression prescription, shows the development of a convective envelope at considerably higher Teff than prescribed by M_αML1.5, which allows instead the density inversion within stellar envelopes (red line).
Binding energy: In this study we employ the presence of a convective envelope in massive CE donors as a proxy for a steep density profile at the core-envelope boundary and low envelope Ebind prior to any CE outcome estimate through the αλ formalism (the λ values are still calculated with the Dominik et al. 2012 model), assuming that all internal and recombination energy contributes to the unbinding of the envelope. However, for stars that develop convective envelopes during the HG phase (i.e., when CHeB has not yet started) we note that Ebind might remain sufficiently high to prevent CE ejection (Klencki et al. 2021). Moreover, our convective envelope models stem from single-star MESA simulations, introducing substantial uncertainties given the likely past impact of companions on CE donors. For example, Nathaniel et al. (2025) found that nearly 92% of their synthetic CE donors were rejuvenated from a past mass accretion phase. While the influence of accretion on the envelope unbinding remains unclear, it is likely to affect Ebind (Renzo et al. 2023; Landri et al. 2024). Similarly, the potential SN when the accretor collapses into a CO can modify Ebind. Beyond mass stripping, SNe in short-period binaries may inject energy deep into the companion envelope, inducing inflation and therefore changes in stellar structure (Ogata et al. 2021; Hirai 2023).
Luminous blue variables: Another factor that we did not consider in our MESA models is that the hydrodynamical turbulence and shocks within superadiabatic layers might be responsible for extreme mass loss events in luminous supergiants and the LBV phenomenon (Owocki et al. 2004; Vink et al. 2011; van Marle et al. 2008; Mennekens & Vanbeveren 2014; Bestenlehner et al. 2014; Quataert et al. 2016; Gräfener 2021; Cheng et al. 2024; Mukhija & Kashi 2024). The existence of the HD limit might be at least partially due to stars nearing their Eddington limit (Humphreys & Davidson 1979; Ulmer & Fitzpatrick 1998; Romagnolo et al. 2024).
4. Conclusions
Various population synthesis models of gravitational wave sources from common-envelope evolution are based on assumptions that are in tension with recent results underlying the crucial role of convective envelopes for successful common envelope evolution (Kruckow et al. 2016; Klencki et al. 2020, 2021; Marchant et al. 2021). In our study we employed 1D stellar evolution models (MESA) to investigate the conditions under which massive giants develop convective envelopes, considering varying assumptions regarding mixing length and the treatment of density inversions in super-Eddington regions. We derived analytical formulae, based on our MESA simulations, that define an effective temperature threshold for convective envelope formation as a function of metallicity and luminosity. These formulae were then integrated into the StarTrack rapid population synthesis code and used to update the common envelope treatment to require the presence of an outer convective envelope for a successful common envelope ejection. This revised treatment improves upon the previous approach (e.g., Belczynski & Fields 2020 with StarTrack, van Son et al. 2022 with COMPAS) in which such a pre-requisite for common envelope ejection was based on the evolutionary type of the giant donor (namely, Hertzprung gap donors were often excluded, following the Hurley et al. 2000 nomenclature). Finally, we performed a population synthesis study of gravitational wave sources from the common envelope channel. Under the assumption that any failed common envelope ejection with a neutron star or black hole accretor leads to the formation of, respectively, a TŻO or a QS, we expanded our study to estimate their Galactic populations and formation rates.
Most common envelope events are with radiative envelopes: Massive stars tend to develop convective envelopes only during the advanced stages of their evolution and radial expansion (Fig. 2). Through our population model, we find that the majority of common envelope events are initiated earlier by giant donors with radiative envelopes. In prior models these events would often lead to a common envelope ejection and the formation of a gravitational-wave source. Here, with our revised model, we include a pre-requisite of an outer convective envelope for common envelope ejection. This leads to a notable decrease (up to a factor of 20; see Table 2) in the yield of the common envelope channel for the BH-BH merger rates with a total mass between ∼20 M⊙ and 50 M⊙. Unexpectedly, we find that the merger rate density increases for BH-BH mergers with total mass Mtot ≳ 50 M⊙ (depending on the model). This occurs because many of these sources form through common envelope events with donors that are classified as stars of the Hertzsprung gap type (following Hurley et al. 2000) and were deemed to lead to common envelope mergers. Here, we show that many such donors may in fact be convective-envelope giants and good candidates for the CE channel.
BH-BH total mass distribution: In our new models there is a drop in the merger rates starting from BH-BH mergers up to ∼50 M⊙ (Figs. 4 and 6). Above that mass we find that the rate is comparable to or higher than the prior models, due to Hertzsprung gap donors developing convective envelopes, and therefore contributing to the population of gravitational wave sources. The net result of this is that the total mass distribution changes from a declining power law to a bimodal distribution. We note, however, that our criteria for what we treat as a convective-envelope star is rather optimistic, setting a threshold at just 10% of the envelope mass being in outer convective regions. With the increasing stellar mass, the subsurface convective zones grow bigger, such that the 10% threshold can be met farther away from the classical Hayashi line of convective stars. A more conservative threshold of 30–50% would likely lead to a considerable decrease in the CE channel yield for BH-BH mergers with ∼50 M⊙ and beyond.
Thorne-Żytkow objects and quasi-stars: At Z ≈ Z⊙, under the optimistic assumption that mergers during common envelope events with black hole or neutron star accretors lead to the formation of QSs and TŻOs rather than transient events, their estimated formation rate (respectively ∼2.6 × 10⁻⁵ and 2.9 × 10⁻⁴ yr−1; TŻO rates in agreement with Cannon 1993; Podsiadlowski et al. 1995; Hutilukejiang et al. 2018; Nathaniel et al. 2025) remains almost unaltered throughout all the considered models. However, even with a clear method for distinguishing such objects from giant stars, their limited lifetime (∼105 yr) makes them unlikely to be detected in the Milky Way.
Key uncertainties: Predicting when massive giants develop convective envelopes is very sensitive to the treatment of radiation-dominated outer envelope layers that approach the Eddington limit. Ad hoc simplified solutions already exist in 1D codes, such as MLT++ (Paxton et al. 2013), use_superad_reduction (Jermyn et al. 2023), or super-Eddington mass ejection (Cheng et al. 2024; Mukhija & Kashi 2024). This results in considerable differences in the efficiency of the common envelope channel, to the point that models suppressing superadiabaticity can result in up to one order of magnitude more BH-BH mergers than those that do not. Ultimately, a more comprehensive guidance on how to improve 1D codes will hopefully come from 3D simulations (e.g., Jiang et al. 2015). In binary population models, most common envelope events leading to gravitational-wave sources are initiated by stars that are above the Humphrey-Davidson limit. Understanding the origin of this limit and in particular the nature of stellar winds and eruptive mass loss from the most luminous supergiants is one of the key challenges in refining the isolated binary evolution scenario. In particular, it has been shown that strong mass loss can prevent very massive stars from expanding (e.g., Maeder & Meynet 1989; Ekström et al. 2012; Bavera et al. 2023; Cheng et al. 2024; Mukhija & Kashi 2024; Romagnolo et al. 2024; Vink et al. 2024), and therefore from contributing to the common envelope channel as stellar donors.
Overestimated BH-BH merger rates from the common envelope channel. While in our new models the common envelope channel can reproduce the observed rate of NS-NS mergers and likely contributes to the population of low-mass BH-BH mergers, we find that the yield of the common envelope channel may have been overestimated so far for the formation of massive BH-BH mergers (Mtot ≳ 20 M⊙). Our results suggest that BH-BH merger rate density can be as low as 3 Gpc−3 yr−1, which is roughly 22 times lower than is estimated with the standard models (∼66 Gpc−3 yr−1). Notably, in the new models the rate of the most massive BH-BH mergers (Mtot ≳ 50 M⊙) remains high (Figs. 4 and 6) due to the inclusion of Hertzsprung gap donors, which were previously disregarded for common envelope evolution (see Sect. 2.2.1 for more details). Black holes this massive are expected to originate from stars with masses M ≳ 40 M⊙ that would lie above the Humphreys–Davidson limit. It is unclear whether such stars ever expand sufficiently to develop outer convective envelopes and why no such red supergiants have been observed. With a more detailed implementation of stellar winds that can account for the initiation of strong optically thick winds (e.g., Chen et al. 2015; Sabhahit et al. 2022, 2023; Romagnolo et al. 2024; transition criteria for thick winds from e.g.,Vink & Gräfener 2012 and Bestenlehner 2020), the rate of massive BH-BH mergers (Mtot ≳ 50 M⊙) from common envelope evolution is likely to significantly decrease.
We acknowledge that reducing the Dutch_scaling_factor in MESA not only reduces the mass loss rates for OBA-type stars, but also those for the dust-driven winds (de Jager et al. 1988) and the optically thick winds (Nugis & Lamers 2000). However, a reduction in the mass loss rates for these winds might be justified by the recent literature (wind-driven mass loss rates comparisons: for dust-driven winds see Sect. 3 of Decin et al. 2024 and Sect. 5 of Antoniadis et al. (2024); for thick and thin winds see Sect. 2 of Gormaz-Matamala et al. 2024 and Appendix A of Romagnolo et al. 2024).
As described in Belczynski et al. (2008), the standard prescription in StarTrack for the presence of convective envelopes in massive giants is set to Teff ≤ 5370 K.
Acknowledgments
AR, JK, and AVG would like to dedicate this article to Krzysztof Belczyński who sadly passed away when the work was still in progress. We thank him for years of collaboration, honest mentorship, and the inspiring energy and passion that will never be forgotten. We thank T. Braun, A. C. Gormaz-Matamala, M. Renzo, R. Hirai, S. Justham, A. Olejak, I. Kotko, K. Nathaniel and T. Shenar for the useful discussions. We thank the Kavli Foundation and the Max Planck Institute for Astrophysics for supporting the 2023 Kavli Summer Program during which much of this work was completed. AR acknowledges the support from the Polish National Science Center (NCN) grant Maestro (2018/30/A/ST9/00050). AR and JK acknowledge the support of a ESO SSDF grant. JK acknowledges the support of a ESO fellowship. Special thanks go to the tens of thousands of citizen-science project “Universe@home” (universeathome.pl) enthusiasts that help to develop the StarTrack population synthesis code used in this study. AVG acknowledges funding from the Netherlands Organisation for Scientific Research (NWO), as part of the Vidi research program BinWaves (project number 639.042.728, PI: de Mink).
References
- Abbott, B. P., Abbott, R., & Abbott, T. D. 2019, ApJ, 882, L24 [NASA ADS] [CrossRef] [Google Scholar]
- Abbott, R., Abbott, T. D., Abraham, S., et al. 2021, ApJ, 913, L7 [NASA ADS] [CrossRef] [Google Scholar]
- Abbott, R., Abbott, T. D., Acernese, F., et al. 2023, Phys. Rev. X., 13, 011048 [NASA ADS] [Google Scholar]
- Agrawal, P., Stevenson, S., Szécsi, D., & Hurley, J. 2022a, A&A, 668, A90 [NASA ADS] [CrossRef] [EDP Sciences] [Google Scholar]
- Agrawal, P., Szécsi, D., Stevenson, S., Eldridge, J. J., & Hurley, J. 2022b, MNRAS, 512, 5717 [NASA ADS] [CrossRef] [Google Scholar]
- Ali-Haïmoud, Y., Kovetz, E. D., & Kamionkowski, M. 2017, Phys. Rev. D, 96, 123523 [CrossRef] [Google Scholar]
- Antoniadis, K., Bonanos, A. Z., de Wit, S., et al. 2024, A&A, 686, A88 [NASA ADS] [CrossRef] [EDP Sciences] [Google Scholar]
- Antonini, F., & Rasio, F. A. 2016, ApJ, 831, 187 [Google Scholar]
- Antonini, F., Toonen, S., & Hamers, A. S. 2017, ApJ, 841, 77 [NASA ADS] [CrossRef] [Google Scholar]
- Asplund, M., Grevesse, N., Sauval, A. J., & Scott, P. 2009, ARA&A, 47, 481 [NASA ADS] [CrossRef] [Google Scholar]
- Bavera, S. S., Fragos, T., Zapartas, E., et al. 2022, A&A, 657, L8 [NASA ADS] [CrossRef] [EDP Sciences] [Google Scholar]
- Bavera, S. S., Fragos, T., Zapartas, E., et al. 2023, Nat. Astron., 7, 1090 [NASA ADS] [CrossRef] [Google Scholar]
- Begelman, M. C., Rossi, E. M., & Armitage, P. J. 2008, MNRAS, 387, 1649 [NASA ADS] [CrossRef] [Google Scholar]
- Belczynski, K., Jr, Fields, C. E., et al. 2020, A&A, 636, A104 [NASA ADS] [CrossRef] [EDP Sciences] [Google Scholar]
- Belczynski, K., Kalogera, V., & Bulik, T. 2002, ApJ, 572, 407 [NASA ADS] [CrossRef] [Google Scholar]
- Belczynski, K., Kalogera, V., Rasio, F. A., et al. 2008, ApJS, 174, 223 [Google Scholar]
- Belczynski, K., Dominik, M., Bulik, T., et al. 2010, ApJ, 715, L138 [Google Scholar]
- Belczynski, K., Wiktorowicz, G., Fryer, C. L., Holz, D. E., & Kalogera, V. 2012, ApJ, 757, 91 [NASA ADS] [CrossRef] [Google Scholar]
- Belczynski, K., Heger, A., Gladysz, W., et al. 2016, A&A, 594, A97 [NASA ADS] [CrossRef] [EDP Sciences] [Google Scholar]
- Belczynski, K., Romagnolo, A., Olejak, A., et al. 2022, ApJ, 925, 69 [NASA ADS] [CrossRef] [Google Scholar]
- Bellinger, E. P., Caplan, M. E., Ryu, T., et al. 2023, ApJ, 959, 113 [NASA ADS] [CrossRef] [Google Scholar]
- Bestenlehner, J. M. 2020, MNRAS, 493, 3938 [Google Scholar]
- Bestenlehner, J. M., Gräfener, G., Vink, J. S., et al. 2014, A&A, 570, A38 [NASA ADS] [CrossRef] [EDP Sciences] [Google Scholar]
- Biehle, G. T. 1991, ApJ, 380, 167 [NASA ADS] [CrossRef] [Google Scholar]
- Bird, S., Cholis, I., Muñoz, J. B., et al. 2016, Phys. Rev. Lett., 116, 201301 [NASA ADS] [CrossRef] [Google Scholar]
- Böhm-Vitense, E. 1958, Z. Astrophys., 46, 108 [Google Scholar]
- Bouret, J. C., Lanz, T., & Hillier, D. J. 2005, A&A, 438, 301 [NASA ADS] [CrossRef] [EDP Sciences] [Google Scholar]
- Broekgaarden, F. S., Berger, E., Stevenson, S., et al. 2022, MNRAS, 516, 5737 [NASA ADS] [CrossRef] [Google Scholar]
- Cannon, R. C. 1993, MNRAS, 263, 817 [NASA ADS] [CrossRef] [Google Scholar]
- Cannon, R. C., Eggleton, P. P., Zytkow, A. N., & Podsiadlowski, P. 1992, ApJ, 386, 206 [NASA ADS] [CrossRef] [Google Scholar]
- Cantiello, M., Langer, N., Brott, I., et al. 2009, A&A, 499, 279 [NASA ADS] [CrossRef] [EDP Sciences] [Google Scholar]
- Cariulo, P., Degl’Innocenti, S., & Castellani, V. 2004, A&A, 421, 1121 [NASA ADS] [CrossRef] [EDP Sciences] [Google Scholar]
- Casares, J. 2007, IAU Symp., 238, 3 [Google Scholar]
- Cason, A. L., Lloyd-Ronning, N., & Cheng, R. 2024, RNAAS, 8, 192 [NASA ADS] [Google Scholar]
- Chen, Z.-C., & Huang, Q.-G. 2018, ApJ, 864, 61 [NASA ADS] [CrossRef] [Google Scholar]
- Chen, Y., Bressan, A., Girardi, L., et al. 2015, MNRAS, 452, 1068 [Google Scholar]
- Cheng, S. J., Goldberg, J. A., Cantiello, M., et al. 2024, ApJ, 974, 270 [NASA ADS] [CrossRef] [Google Scholar]
- Choi, J., Dotter, A., Conroy, C., et al. 2016, ApJ, 823, 102 [Google Scholar]
- Chun, S.-H., Yoon, S.-C., Jung, M.-K., Kim, D. U., & Kim, J. 2018, ApJ, 853, 79 [NASA ADS] [CrossRef] [Google Scholar]
- Cignoni, M., Degl’Innocenti, S., Prada Moroni, P. G., & Shore, S. N. 2006, A&A, 459, 783 [NASA ADS] [CrossRef] [EDP Sciences] [Google Scholar]
- Davies, B., Crowther, P. A., & Beasor, E. R. 2018, MNRAS, 478, 3138 [NASA ADS] [CrossRef] [Google Scholar]
- Decin, L., Richards, A. M. S., Marchant, P., & Sana, H. 2024, A&A, 681, A17 [NASA ADS] [CrossRef] [EDP Sciences] [Google Scholar]
- de Jager, C., Nieuwenhuijzen, H., & van der Hucht, K. A. 1988, A&AS, 72, 259 [NASA ADS] [Google Scholar]
- de Kool, M. 1990, ApJ, 358, 189 [Google Scholar]
- Deloye, C. J., & Taam, R. E. 2010, ApJ, 719, L28 [NASA ADS] [CrossRef] [Google Scholar]
- de Mink, S. E., & Belczynski, K. 2015, ApJ, 814, 58 [Google Scholar]
- de Mink, S. E., & Mandel, I. 2016, MNRAS, 460, 3545 [NASA ADS] [CrossRef] [Google Scholar]
- Dewi, J. D. M., & Tauris, T. M. 2000, A&A, 360, 1043 [NASA ADS] [Google Scholar]
- Di Carlo, U. N., Giacobbo, N., Mapelli, M., et al. 2019, MNRAS, 487, 2947 [NASA ADS] [CrossRef] [Google Scholar]
- Dominik, M., Belczynski, K., Fryer, C., et al. 2012, ApJ, 759, 52 [Google Scholar]
- Dorozsmai, A., & Toonen, S. 2024, MNRAS, 530, 3706 [NASA ADS] [CrossRef] [Google Scholar]
- Drout, M. R., Götberg, Y., Ludwig, B. A., et al. 2023, Sci, 382, 1287 [NASA ADS] [CrossRef] [Google Scholar]
- Eich, C., Zimmermann, M. E., Thorne, K. S., & Zytkow, A. N. 1989, ApJ, 346, 277 [NASA ADS] [CrossRef] [Google Scholar]
- Ekström, S., Georgy, C., Eggenberger, P., et al. 2012, A&A, 537, A146 [Google Scholar]
- Everson, R. W., Hutchinson-Smith, T., Vigna-Gómez, A., & Ramirez-Ruiz, E. 2024, ApJ, 971, 132 [NASA ADS] [CrossRef] [Google Scholar]
- Farmer, R., Renzo, M., Götberg, Y., et al. 2023, MNRAS, 524, 1692 [NASA ADS] [CrossRef] [Google Scholar]
- Fryer, C. L., Belczynski, K., Wiktorowicz, G., et al. 2012, ApJ, 749, 91 [Google Scholar]
- Gaia Collaboration (Panuzzo, P., et al.) 2024, A&A, 686, L2 [NASA ADS] [CrossRef] [EDP Sciences] [Google Scholar]
- Gallegos-Garcia, M., Berry, C. P. L., Marchant, P., & Kalogera, V. 2021, ApJ, 922, 110 [NASA ADS] [CrossRef] [Google Scholar]
- Ge, H., Webbink, R. F., Chen, X., & Han, Z. 2015, ApJ, 812, 40 [Google Scholar]
- Ge, H., Webbink, R. F., Chen, X., & Han, Z. 2020, ApJ, 899, 132 [NASA ADS] [CrossRef] [Google Scholar]
- Gilkis, A., Shenar, T., Ramachandran, V., et al. 2021, MNRAS, 503, 1884 [NASA ADS] [CrossRef] [Google Scholar]
- Glebbeek, E., Gaburov, E., de Mink, S. E., Pols, O. R., & Portegies Zwart, S. F. 2009, A&A, 497, 255 [NASA ADS] [CrossRef] [EDP Sciences] [Google Scholar]
- Gormaz-Matamala, A. C., Curé, M., Hillier, D. J., et al. 2021, ApJ, 920, 64 [NASA ADS] [CrossRef] [Google Scholar]
- Gormaz-Matamala, A. C., Cuadra, J., Ekström, S., et al. 2024, A&A, 687, A290 [NASA ADS] [CrossRef] [EDP Sciences] [Google Scholar]
- Götberg, Y., de Mink, S. E., Groh, J. H., et al. 2018, A&A, 615, A78 [NASA ADS] [CrossRef] [EDP Sciences] [Google Scholar]
- Götberg, Y., Drout, M. R., Ji, A. P., et al. 2023, ApJ, 959, 125 [CrossRef] [Google Scholar]
- Gräfener, G. 2021, A&A, 647, A13 [NASA ADS] [CrossRef] [EDP Sciences] [Google Scholar]
- Gräfener, G., Owocki, S. P., & Vink, J. S. 2012, A&A, 538, A40 [NASA ADS] [CrossRef] [EDP Sciences] [Google Scholar]
- Hawking, S. 1971, MNRAS, 152, 75 [Google Scholar]
- Haywood, M., Di Matteo, P., Lehnert, M. D., Katz, D., & Gómez, A. 2013, A&A, 560, A109 [NASA ADS] [CrossRef] [EDP Sciences] [Google Scholar]
- Hilditch, R. W. 2001, An Introduction to Close Binary Stars (Cambridge University Press) [Google Scholar]
- Hirai, R. 2023, MNRAS, 523, 6011 [NASA ADS] [CrossRef] [Google Scholar]
- Hirai, R., Podsiadlowski, P., Owocki, S. P., Schneider, F. R. N., & Smith, N. 2021, MNRAS, 503, 4276 [NASA ADS] [CrossRef] [Google Scholar]
- Horvath, J. E., Rocha, L. S., Bernardo, A. L. C., de Avellar, M. G. B., & Valentim, R. 2022, Astrophysics in the XXI Century with Compact Stars, ed. C. A. Z. Vasconcellos (Singapore: World Scientific), 1 [Google Scholar]
- Humphreys, R. M., & Davidson, K. 1979, ApJ, 232, 409 [Google Scholar]
- Humphreys, R. M., & Davidson, K. 1994, PASP, 106, 1025 [NASA ADS] [CrossRef] [Google Scholar]
- Hurley, J. R., Pols, O. R., & Tout, C. A. 2000, MNRAS, 315, 543 [Google Scholar]
- Hutchinson-Smith, T., Everson, R. W., & Batta, A. 2023, ArXiv e-prints [arXiv:2311.06741] [Google Scholar]
- Hutilukejiang, B., Zhu, C., Wang, Z., & Lü, G. 2018, JA&A, 39, 21 [NASA ADS] [Google Scholar]
- Ivanova, N., Justham, S., Chen, X., et al. 2013, A&ARv, 21, 59 [Google Scholar]
- Ivanova, N., Justham, S., & Ricker, P. 2020, Common Envelope Evolution (IOP Publishing) [Google Scholar]
- Jermyn, A. S., Anders, E. H., Lecoanet, D., & Cantiello, M. 2022, ApJS, 262, 19 [NASA ADS] [CrossRef] [Google Scholar]
- Jermyn, A. S., Bauer, E. B., Schwab, J., et al. 2023, ApJS, 265, 15 [NASA ADS] [CrossRef] [Google Scholar]
- Jiang, Y.-F., Cantiello, M., Bildsten, L., Quataert, E., & Blaes, O. 2015, ApJ, 813, 74 [Google Scholar]
- Joyce, M., & Tayar, J. 2023, Galaxies, 11, 75 [NASA ADS] [CrossRef] [Google Scholar]
- King, A. R., Davies, M. B., Ward, M. J., Fabbiano, G., & Elvis, M. 2001, ApJ, 552, L109 [NASA ADS] [CrossRef] [Google Scholar]
- Klencki, J., Nelemans, G., Istrate, A. G., & Pols, O. 2020, A&A, 638, A55 [NASA ADS] [CrossRef] [EDP Sciences] [Google Scholar]
- Klencki, J., Nelemans, G., Istrate, A. G., & Chruslinska, M. 2021, A&A, 645, A54 [EDP Sciences] [Google Scholar]
- Kozai, Y. 1962, AJ, 67, 591 [Google Scholar]
- Kroupa, P. 2002, Science, 295, 82 [Google Scholar]
- Kroupa, P., Tout, C. A., & Gilmore, G. 1993, MNRAS, 262, 545 [NASA ADS] [CrossRef] [Google Scholar]
- Kruckow, M. U., Tauris, T. M., Langer, N., et al. 2016, A&A, 596, A58 [NASA ADS] [CrossRef] [EDP Sciences] [Google Scholar]
- Kulkarni, S. R., Hut, P., & McMillan, S. 1993, Nature, 364, 421 [Google Scholar]
- Landri, C., Ricker, P. M., Renzo, M., Rau, S., & Vigna-Gómez, A. 2024, ArXiv e-prints [arXiv:2407.15932] [Google Scholar]
- Ledoux, P. 1947, ApJ, 105, 305 [NASA ADS] [CrossRef] [Google Scholar]
- Licquia, T. C., & Newman, J. A. 2015, ApJ, 806, 96 [NASA ADS] [CrossRef] [Google Scholar]
- Lidov, M. 1962, P&SS, 9, 719 [NASA ADS] [CrossRef] [Google Scholar]
- Liu, B., & Lai, D. 2018, ApJ, 863, 68 [NASA ADS] [CrossRef] [Google Scholar]
- Livio, M., & Soker, N. 1988, ApJ, 329, 764 [Google Scholar]
- MacLeod, M., Macias, P., Ramirez-Ruiz, E., et al. 2017, ApJ, 835, 282 [NASA ADS] [CrossRef] [Google Scholar]
- Maeder, A., & Meynet, G. 1989, A&A, 210, 155 [Google Scholar]
- Mandel, I., & Broekgaarden, F. S. 2021, Liv. Rev. Relativ., 25, 1 [NASA ADS] [Google Scholar]
- Mandel, I., & de Mink, S. E. 2016, MNRAS, 458, 2634 [NASA ADS] [CrossRef] [Google Scholar]
- Mandel, I., & Farmer, A. 2022, Phys. Rep., 955, 1 [NASA ADS] [CrossRef] [Google Scholar]
- Marchant, P., Langer, N., Podsiadlowski, P., Tauris, T. M., & Moriya, T. J. 2016, A&A, 588, A50 [NASA ADS] [CrossRef] [EDP Sciences] [Google Scholar]
- Marchant, P., Pappas, K. M. W., Gallegos-Garcia, M., et al. 2021, A&A, 650, A107 [NASA ADS] [CrossRef] [EDP Sciences] [Google Scholar]
- Matson, R. A. 2016, Ph.D. Thesis, Georgia State University, USA [Google Scholar]
- McKernan, B., Ford, K. E. S., Kocsis, B., Lyra, W., & Winter, L. M. 2014, MNRAS, 441, 900 [NASA ADS] [CrossRef] [Google Scholar]
- Mennekens, N., & Vanbeveren, D. 2014, A&A, 564, A134 [NASA ADS] [CrossRef] [EDP Sciences] [Google Scholar]
- Metzger, B. D. 2022, ApJ, 932, 84 [NASA ADS] [CrossRef] [Google Scholar]
- Miller, M. C., & Lauburg, V. M. 2009, ApJ, 692, 917 [Google Scholar]
- Moe, M., & Di Stefano, R. 2017, ApJS, 230, 15 [Google Scholar]
- Mukhija, B., & Kashi, A. 2024, ApJ, 974, 124 [NASA ADS] [CrossRef] [Google Scholar]
- Nathaniel, K., Vigna-Gómez, A., Grichener, A., et al. 2025, A&A, in press, https://doi.org/10.1051/0004-6361/202451531 [Google Scholar]
- Nugis, T., & Lamers, H. J. G. L. M. 2000, A&A, 360, 227 [NASA ADS] [Google Scholar]
- Ogata, M., Hirai, R., & Hijikawa, K. 2021, MNRAS, 505, 2485 [NASA ADS] [CrossRef] [Google Scholar]
- Olejak, A., Belczynski, K., Bulik, T., & Sobolewska, M. 2020a, A&A, 638, A94 [NASA ADS] [CrossRef] [EDP Sciences] [Google Scholar]
- Olejak, A., Fishbach, M., Belczynski, K., et al. 2020b, ApJ, 901, L39 [NASA ADS] [CrossRef] [Google Scholar]
- Olejak, A., Belczynski, K., & Ivanova, N. 2021, A&A, 651, A100 [NASA ADS] [CrossRef] [EDP Sciences] [Google Scholar]
- Olejak, A., Klencki, J., Xu, X.-T., et al. 2024, A&A, 689, A305 [NASA ADS] [CrossRef] [EDP Sciences] [Google Scholar]
- Orosz, J. A. 2003, IAU Symp., 212, 365 [NASA ADS] [Google Scholar]
- Owocki, S. P., Gayley, K. G., & Shaviv, N. J. 2004, ApJ, 616, 525 [NASA ADS] [CrossRef] [Google Scholar]
- Paczyński, B. 1967, Acta Astron., 17, 355 [NASA ADS] [Google Scholar]
- Paczynski, B. 1976, IAU Symp., 73, 75 [NASA ADS] [Google Scholar]
- Pavlovskii, K., & Ivanova, N. 2015, MNRAS, 449, 4415 [Google Scholar]
- Pavlovskii, K., Ivanova, N., Belczynski, K., & Van, K. X. 2017, MNRAS, 465, 2092 [Google Scholar]
- Paxton, B., Bildsten, L., Dotter, A., et al. 2011, ApJS, 192, 3 [Google Scholar]
- Paxton, B., Cantiello, M., Arras, P., et al. 2013, ApJS, 208, 4 [Google Scholar]
- Paxton, B., Marchant, P., Schwab, J., et al. 2015, ApJS, 220, 15 [Google Scholar]
- Paxton, B., Schwab, J., Bauer, E. B., et al. 2018, ApJS, 234, 34 [NASA ADS] [CrossRef] [Google Scholar]
- Paxton, B., Smolec, R., Schwab, J., et al. 2019, ApJS, 243, 10 [Google Scholar]
- Picker, L., Hirai, R., & Mandel, I. 2024, ApJ, 969, 1 [NASA ADS] [CrossRef] [Google Scholar]
- Podsiadlowski, P. 2001, ASP Conf. Ser., 229, 239 [Google Scholar]
- Podsiadlowski, P., Cannon, R. C., & Rees, M. J. 1995, MNRAS, 274, 485 [NASA ADS] [CrossRef] [Google Scholar]
- Pols, O. R., Schröder, K.-P., Hurley, J. R., Tout, C. A., & Eggleton, P. P. 1998, MNRAS, 298, 525 [Google Scholar]
- Portegies Zwart, S. F., & McMillan, S. L. W. 2000, ApJ, 528, L17 [Google Scholar]
- Quataert, E., Fernández, R., Kasen, D., Klion, H., & Paxton, B. 2016, MNRAS, 458, 1214 [NASA ADS] [CrossRef] [Google Scholar]
- Renzo, M., Zapartas, E., Justham, S., et al. 2023, ApJ, 942, L32 [NASA ADS] [CrossRef] [Google Scholar]
- Rodriguez, C. L., Morscher, M., Pattabiraman, B., et al. 2015, Phys. Rev. Lett., 115, 051101 [Google Scholar]
- Romagnolo, A., Belczynski, K., Klencki, J., et al. 2023, MNRAS, 525, 706 [NASA ADS] [CrossRef] [Google Scholar]
- Romagnolo, A., Gormaz-Matamala, A. C., & Belczynski, K. 2024, ApJ, 964, L23 [NASA ADS] [CrossRef] [Google Scholar]
- Sabhahit, G. N., Vink, J. S., Higgins, E. R., & Sander, A. A. C. 2022, MNRAS, 514, 3736 [NASA ADS] [CrossRef] [Google Scholar]
- Sabhahit, G. N., Vink, J. S., Sander, A. A. C., & Higgins, E. R. 2023, MNRAS, 524, 1529 [NASA ADS] [CrossRef] [Google Scholar]
- Samsing, J., Bartos, I., D’Orazio, D. J., et al. 2022, Nature, 603, 237 [NASA ADS] [CrossRef] [Google Scholar]
- Sana, H., de Mink, S. E., de Koter, A., et al. 2012, Science, 337, 444 [Google Scholar]
- Sander, A. A. C., Hamann, W. R., Todt, H., Hainich, R., & Shenar, T. 2017, A&A, 603, A86 [NASA ADS] [CrossRef] [EDP Sciences] [Google Scholar]
- Schneider, F. R. N., Ohlmann, S. T., Podsiadlowski, P., et al. 2019, Nature, 574, 211 [Google Scholar]
- Scott, L. J. A., Hirschi, R., Georgy, C., et al. 2021, MNRAS, 503, 4208 [NASA ADS] [CrossRef] [Google Scholar]
- Shenar, T., Sablowski, D. P., Hainich, R., et al. 2020, A&A, 641, C2 [NASA ADS] [CrossRef] [EDP Sciences] [Google Scholar]
- Sigurdsson, S., & Hernquist, L. 1993, Nature, 364, 423 [Google Scholar]
- Spitzer, L., Jr 1969, ApJ, 158, L139 [NASA ADS] [CrossRef] [Google Scholar]
- Stone, N. C., Metzger, B. D., & Haiman, Z. 2017, MNRAS, 464, 946 [Google Scholar]
- Šurlan, B., Hamann, W. R., Kubát, J., Oskinova, L. M., & Feldmeier, A. 2012, A&A, 541, A37 [NASA ADS] [CrossRef] [EDP Sciences] [Google Scholar]
- Šurlan, B., Hamann, W. R., Aret, A., et al. 2013, A&A, 559, A130 [NASA ADS] [CrossRef] [EDP Sciences] [Google Scholar]
- Tauris, T. M., & Dewi, J. D. M. 2001, A&A, 369, 170 [NASA ADS] [CrossRef] [EDP Sciences] [Google Scholar]
- Tauris, T. M., & van den Heuvel, E. P. J. 2006, Cambridge Astrophys. Ser., 39, 623 [NASA ADS] [Google Scholar]
- Tauris, T. M., Kramer, M., Freire, P. C. C., et al. 2017, ApJ, 846, 170 [Google Scholar]
- Thompson, T. A. 2011, ApJ, 741, 82 [NASA ADS] [CrossRef] [Google Scholar]
- Thorne, K. S., & Zytkow, A. N. 1975, ApJ, 199, L19 [NASA ADS] [CrossRef] [Google Scholar]
- Thorne, K. S., & Zytkow, A. N. 1977, ApJ, 212, 832 [Google Scholar]
- Ulmer, A., & Fitzpatrick, E. L. 1998, ApJ, 504, 200 [NASA ADS] [CrossRef] [Google Scholar]
- Vanbeveren, D., De Donder, E., Van Bever, J., Van Rensbergen, W., & De Loore, C. 1998, New Astron., 3, 443 [CrossRef] [Google Scholar]
- van den Heuvel, E. P. J. 2019, Proc. Int. Astron. Union, 346, 1 [NASA ADS] [Google Scholar]
- van Marle, A. J., Owocki, S. P., & Shaviv, N. J. 2008, MNRAS, 389, 1353 [NASA ADS] [CrossRef] [Google Scholar]
- van Son, L. A. C., de Mink, S. E., Callister, T., et al. 2022, ApJ, 931, 17 [NASA ADS] [CrossRef] [Google Scholar]
- Vigna-Gómez, A., Toonen, S., Ramirez-Ruiz, E., et al. 2021, ApJ, 907, L19 [Google Scholar]
- Vigna-Gómez, A., Wassink, M., Klencki, J., et al. 2022, MNRAS, 511, 2326 [CrossRef] [Google Scholar]
- Vink, J. S., & Gräfener, G. 2012, ApJ, 751, L34 [Google Scholar]
- Vink, J. S., de Koter, A., & Lamers, H. J. G. L. M. 2001, A&A, 369, 574 [NASA ADS] [CrossRef] [EDP Sciences] [Google Scholar]
- Vink, J. S., Muijres, L. E., Anthonisse, B., et al. 2011, A&A, 531, A132 [NASA ADS] [CrossRef] [EDP Sciences] [Google Scholar]
- Vink, J. S., Sabhahit, G. N., & Higgins, E. R. 2024, A&A, 688, L10 [NASA ADS] [CrossRef] [EDP Sciences] [Google Scholar]
- Webbink, R. F. 1984, ApJ, 277, 355 [NASA ADS] [CrossRef] [Google Scholar]
- Woosley, S. E. 2017, ApJ, 836, 244 [Google Scholar]
- Xu, X.-J., & Li, X.-D. 2010a, ApJ, 722, 1985 [NASA ADS] [CrossRef] [Google Scholar]
- Xu, X.-J., & Li, X.-D. 2010b, ApJ, 716, 114 [Google Scholar]
- Yoon, S.-C., & Cantiello, M. 2010, ApJ, 717, L62 [NASA ADS] [CrossRef] [Google Scholar]
- Yusof, N., Hirschi, R., Eggenberger, P., et al. 2022, MNRAS, 511, 2814 [NASA ADS] [CrossRef] [Google Scholar]
- Ziółkowski, J. 2008, Chin. J. Astron. Astrophys., 8, 273 [Google Scholar]
Appendix A: Outer convective envelope evolution
Figure A.1 shows a Kippenhahn and an HR diagram of a MZAMS = 50 M⊙ star at 0.1 Z⊙ taken from M_αML1.82_MLTpp. To exemplify the evolution of its convective envelope we evolved the model until its outer convective envelope mass Menv, conv reaches ∼70% of the total envelope mass Menv. If such a star were a CE donor, we assume that it would have a low enough Ebind for its host binary to eject the CE only once it expanded above ∼ 1700 R⊙.
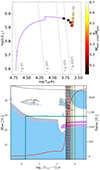 |
Fig. A.1. Evolution of a MZAMS = 50 M⊙ star at 0.1 Z⊙ from M_αML1.82_MLTpp until ∼ 70% of its envelope mass becomes convective. Top panel: HR diagram. We show the HR position of the star when Menv, conv is 1, 5, 10, 20, 30, 40, 50, 60 and 70% of Menv. Bottom panel: Kippenhahn diagram, with radial evolution represented by the red line. In cyan, purple and gray respectively the convective, semiconvection and overshooting regions, while the green line represent the post-MS core-envelope boundary. The dashed vertical lines have the same colors of the scatter points in the left panel and represent the evolutionary stage at which the star reaches its respective Menv, conv/Menv ratio. |
Figure A.2 shows the same plots of Fig. A.1, but for a star at MZAMS = 50 M⊙ star at Z⊙. We highlight that for this metallicity the MLT++ procedure is enabled, which can be seen from the higher Teff at which a convective envelope forms. The formation of a convective envelope is quicker than the star at 0.1 Z⊙. Once such an envelope forms for the first time, it already possesses 10% of the total envelope mass. For such a star to form a convective envelope of at least 10% of the total stellar mass, it would need to expand at least at ∼400 R⊙.
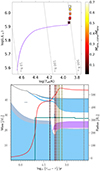 |
Fig. A.2. Same as Fig. A.1, but at Z = Z⊙. and with the HR position of the star when Menv, conv is 10, 20, 30, 40, 50, 60, and 70% of Menv. |
Appendix B: Maximum stellar expansion
B.1. Metallicity dependence
Figure B.1 illustrates the impact of varying metallicities on stellar expansion in our MESA simulations. We analyze the change in the RMAX parameter as a function of initial stellar mass, comparing it between the reference model at Z = 0.1 Z⊙ from Romagnolo et al. (2023) and models with lower and higher metallicities (Z = 10−6, 0.01 Z⊙, Z⊙). For Z = Z⊙ we adopt the same adjustments for superadiabaticity and wind-driven mass loss that were described in Sect. 2.1, i.e., the use of the module MLT++ and Dutch_scaling_factor = 0.5. We explore the difference in metallicities as the ratio between RMAX(MZAMS) at 0.1 Z⊙ and the RMAX(MZAMS) from the other metallicities.
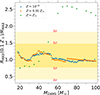 |
Fig. B.1. Maximum radius RMAX ratios as a function of ZAMS mass MZAMS between the reference metallicity Z = 0.1 Z⊙ and the other adopted metallicities according to our MESA simulations. We show the RMAX(0.1 Z⊙/RMAX mean value at ∼1.1 and its Gaussian distribution up to 2σ. The variability of all the low-Z models with respect to 0.1 Z⊙ sits within 1σ, while it gets significantly beyond 2σ at Z⊙ for MZAMS≳ 60 M⊙ due to the increasingly large effect of wind mass loss and the treatment of superadiabaticity. |
We observe small discrepancies among the models at Z ≤ 0.1 Z⊙, as all the variations fall within a 1 sigma σ deviation from the mean value. Furthermore, the mean value itself remains in close proximity to unity, approximately 1.1, indicating the relatively modest impact of metallicity on RMAX on the considered metallicities. However, a substantial difference arises from the Z⊙ model. This difference is moderate for stars with mass ≲ 50 M⊙. Above this mass, the disparities become considerable. This is due to the extreme mass loss that is characteristic to massive stars at high metallicity. It is worth emphasizing that even in the context of low-metallicity scenarios, massive stars can already expand up to 2.5 times the Z⊙ counterparts despite our deliberate reduction of wind mass loss by half for the high-metallicity scenarios. This is due to the fact that at this metallicity massive stars still lose more envelope mass due to winds and because the use of MLT++ reduces their expansion (more details in Sect. 3.6). If we kept the wind mass loss to its default values, the differences would be even more striking, since even more envelope mass would have been lost.
For Z⊙ metallicities, we therefore fitted the maximum expansion of stars from our MESA simulations to the formula below:
 (B.1)
(B.1)
The RMAX prescription described here is applicable exclusively to stars in their giant phase with initial masses below 100 M⊙. Beyond this mass threshold, we assume a consistent behavior in the form of log RMAX(MZAMS≥ 100 M⊙) = log RMAX(100 M⊙), which yields RMAX(MZAMS≥ 100 M⊙) ∼ 955 R⊙. In light of the negligible differences observed in RMAX among low-metallicity models, we have decided in our StarTrack framework to employ the RMAX(MZAMS, 0.1 Z⊙) prescription for stars at any metallicity below 0.5 Z⊙. For metallicities exceeding the 0.5 Z⊙ threshold, we transition to the RMAX(MZAMS, Z⊙) variant.
B.2. Effect on stellar evolution
In order to understand the consequences of using our RMAX prescription on stellar evolution, we show in Fig. B.2 an HR diagram with seven StarTrack evolutionary tracks at Z = 0.00142, 0.0142 and with MZAMS between 20 and 150 M⊙. We simulated these stars with M0RMAX, which is noticeable from the tracks following their respective isoradii during the latest stages of their evolution. As a reference, we also show with the grey lines how these stellar tracks evolve during their latest stages without any RMAX prescription (M0). The teal area is the part of the HR diagram that, according to the Hurley et al. (2000) prescription, is beyond the HD limit:
 (B.2)
(B.2)
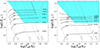 |
Fig. B.2. HR diagram for seven StarTrack stellar tracks simulated with our RMAX prescription for Z = 0.5 Z⊙ (left panel) and Z= Z⊙ (right panel). The initial masses are shown above their respective stellar tracks. The grey lines represent how the stars would evolve without limiting their expansion with our new radial prescription. The cyan area represents the area of the HR diagram beyond the HD limit. Despite the differences between M0 and M0RMAX, in every case with MZAMS≳40 M⊙, the RMAX limit to stellar expansion only takes place in our models when the stars are already in the LBV regime (which means that, according to our wind prescription, the wind mass loss does not change) or for relatively short periods of time that do not significantly impact the final properties of COs. |
and
 (B.3)
(B.3)
where L stellar luminosity in L⊙ and R stellar radius in R⊙. In our models a star crossing this boundary will enter its Luminous Blue Variable (LBV) phase, with a wind mass loss Ṁlbv of
![Mathematical equation: $$ \begin{aligned} \dot{M}_{\rm lbv}=f_{\text{LBV}} 10^{-4}[M_\odot \,\mathrm{yr}^{-1}] f_{\rm lbv} = 1.5 \end{aligned} $$](/articles/aa/full_html/2025/01/aa52169-24/aa52169-24-eq6.gif) (B.4)
(B.4)
This value is meant to account for both LBV wind mass loss and possible LBV shell ejections. fLBV was originally calibrated in Belczynski et al. (2010) to reproduce the most massive Galactic BHs from the catalogues of that time (e.g., Orosz 2003; Casares 2007; Ziółkowski 2008). Since our LBV mass loss prescription was meant as an average between the wind-driven mass loss and the super-Eddington mass ejection events, the mass lost of a star beyond the HD limit is not dependent in our models by its position on the HR diagram. Stars with MZAMS≳ 40 M⊙ for Z = 0.0014 and MZAMS≳ 50 M⊙ for Z = 0.014 reach their maximum expansion when they are already in their LBV phase. This means that, at least for that mass range, for all intents and purposes the use of our RMAX prescription does not affect stellar evolution in any way other than its intended effect on binary interactions. We nevertheless argue that if our RMAX prescription was combined with different LBV winds models that do take into account the position of stars in the HR diagram (or even just the effective temperature), our RMAX prescription would more considerably change the evolution of stars. We highlight that at high metallicities, the stellar tracks that do not cross the HD-limit almost do not even expand beyond their respective RMAX. For Z = 0.0014, despite the track at MZAMS = 20 M⊙ does not cross the HD limit and therefore possesses temperature-dependent winds, the cumulative time at which M0 and M0RMAX diverge in the HR diagram for these initial conditions is less than 0.2 Myr. During this time the two stars do lose different amounts of envelope mass, but after their collapse the BH from M0 will have a mass of 7.24 M⊙, while the one from M0RMAX will have one of 7.29 M⊙, which is a negligible difference. This comes in agreement with the results presented in Romagnolo et al. (2023), where the use of our RMAX prescription with StarTrack does not alter the estimates of the distribution of the least massive BHs in BH-BH mergers within a redshift z < 2.
Appendix C: TŻO and QS lifetimes
We show in Fig. C.1 the different models for the lifetimes of TŻOs that our study and Nathaniel et al. (2025) adopt up to MTZO = 50 M⊙. For objects below (above) 5 (20) M⊙ our model predicts lifetimes that are lower (higher) than the ones reported in Nathaniel et al. (2025), while between 5 and 20 M⊙ the values are similar.
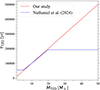 |
Fig. C.1. Comparison of the TŻO lifetime models between our work and Nathaniel et al. (2025) |
All Tables
Adopted models with respective assumptions for the determination of the CE outcome prior to the αλ calculation, mixing length and density inversion treatment (with or without MLT++).
Estimated population of Thorne-Żytkow objects (TŻOs) and quasi-stars (QSs) in the Galactic thin disk at the present time, and the respective formation rate at Z⊙.
All Figures
|
Fig. 1. HR diagram with the positions of stars from our MESA models where they develop convective envelopes for metallicities Z = 0.1 Z⊙ (teal) and Z = Z⊙ (red). Their respective fits (Eqs. (1) and (2)) are represented by the dashed lines. |
| In the text | |
|
Fig. 2. HR diagram position of the donor stars at the onset of a CE event with a BH accretor at Z = 0.1 Z⊙ (left) and Z⊙ (right), with six evolutionary tracks for single stars at MZAMS = 20, 40, 60, 80, 100, and 150 M⊙ for M0 (black dashed line) and M0RMAX (black solid line). The gray dots represent the CE events with a BH companion that lead to a stellar merger and the potential formation of a QS, while the blue and green dots represent respectively HG and CHeB stars (i.e., evolutionary types in StarTrack, following Hurley et al. 2000) in binaries that successfully expel the CE and become BH-BH. The red and blue lines represent the threshold for respectively M_αML1.5 and M_αML1.82_MLTpp, where a star becomes cold enough to develop a convective envelope. The horizontal purple dotted line represents the luminosity threshold beyond which we extrapolate the convective boundary tracks. We plot the distributions of log Teff and log L values of donors that have led to the CE mergers (in gray) or to CE ejections and the formation of BH-BH systems (in green or blue, depending on the donor evolutionary type in StarTrack). In the right panel there is a near-complete overlap between the BH-BH progenitor binaries and the ones that become GW sources. The dashed-line histograms correspond only to BH-BH systems that merge within a Hubble time. |
| In the text | |
|
Fig. 3. BH-BH merger rate distribution as a function of redshift. The influence of more optimistic assumptions for convective envelope formation at high metallicities for M_αML1.82_MLTpp noticeably increases the merger rates for the local Universe. |
| In the text | |
|
Fig. 4. Mass distribution of the BH-BH mergers within redshift 2. In the different panels we show the total mass (top) as well as the masses of the most (middle) and least (bottom) massive BH in the binary. |
| In the text | |
|
Fig. 5. Normalized spin distribution of the BH-BH mergers within redshift 2. The reference M0 model for StarTrack and M_αML1.82_MLTpp show a spread to positive values, while M_αML1.5 concentrates uniquely on the peak at 0.15. |
| In the text | |
|
Fig. 6. BH-BH total mass distribution within redshift 2 as a function of metallicity for M0 (top), M_αML1.82_MLTpp (middle), and M_αML1.5 (bottom). The dashed cyan line represents the metallicity threshold beyond which the formation of a convective envelope is estimated from the MESA tracks using MLT++ for M_αML1.82_MLTpp (see details in Sect. 3.6). |
| In the text | |
|
Fig. A.1. Evolution of a MZAMS = 50 M⊙ star at 0.1 Z⊙ from M_αML1.82_MLTpp until ∼ 70% of its envelope mass becomes convective. Top panel: HR diagram. We show the HR position of the star when Menv, conv is 1, 5, 10, 20, 30, 40, 50, 60 and 70% of Menv. Bottom panel: Kippenhahn diagram, with radial evolution represented by the red line. In cyan, purple and gray respectively the convective, semiconvection and overshooting regions, while the green line represent the post-MS core-envelope boundary. The dashed vertical lines have the same colors of the scatter points in the left panel and represent the evolutionary stage at which the star reaches its respective Menv, conv/Menv ratio. |
| In the text | |
|
Fig. A.2. Same as Fig. A.1, but at Z = Z⊙. and with the HR position of the star when Menv, conv is 10, 20, 30, 40, 50, 60, and 70% of Menv. |
| In the text | |
|
Fig. B.1. Maximum radius RMAX ratios as a function of ZAMS mass MZAMS between the reference metallicity Z = 0.1 Z⊙ and the other adopted metallicities according to our MESA simulations. We show the RMAX(0.1 Z⊙/RMAX mean value at ∼1.1 and its Gaussian distribution up to 2σ. The variability of all the low-Z models with respect to 0.1 Z⊙ sits within 1σ, while it gets significantly beyond 2σ at Z⊙ for MZAMS≳ 60 M⊙ due to the increasingly large effect of wind mass loss and the treatment of superadiabaticity. |
| In the text | |
|
Fig. B.2. HR diagram for seven StarTrack stellar tracks simulated with our RMAX prescription for Z = 0.5 Z⊙ (left panel) and Z= Z⊙ (right panel). The initial masses are shown above their respective stellar tracks. The grey lines represent how the stars would evolve without limiting their expansion with our new radial prescription. The cyan area represents the area of the HR diagram beyond the HD limit. Despite the differences between M0 and M0RMAX, in every case with MZAMS≳40 M⊙, the RMAX limit to stellar expansion only takes place in our models when the stars are already in the LBV regime (which means that, according to our wind prescription, the wind mass loss does not change) or for relatively short periods of time that do not significantly impact the final properties of COs. |
| In the text | |
|
Fig. C.1. Comparison of the TŻO lifetime models between our work and Nathaniel et al. (2025) |
| In the text | |
Current usage metrics show cumulative count of Article Views (full-text article views including HTML views, PDF and ePub downloads, according to the available data) and Abstracts Views on Vision4Press platform.
Data correspond to usage on the plateform after 2015. The current usage metrics is available 48-96 hours after online publication and is updated daily on week days.
Initial download of the metrics may take a while.