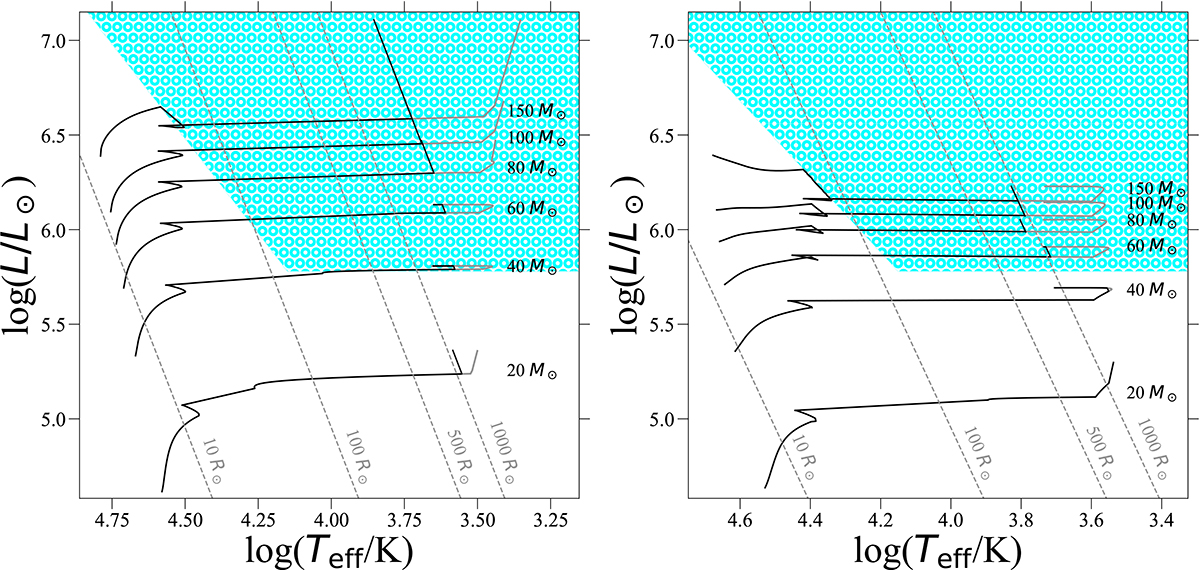
Fig. B.2.
Download original image
HR diagram for seven StarTrack stellar tracks simulated with our RMAX prescription for Z = 0.5 Z⊙ (left panel) and Z= Z⊙ (right panel). The initial masses are shown above their respective stellar tracks. The grey lines represent how the stars would evolve without limiting their expansion with our new radial prescription. The cyan area represents the area of the HR diagram beyond the HD limit. Despite the differences between M0 and M0RMAX, in every case with MZAMS≳40 M⊙, the RMAX limit to stellar expansion only takes place in our models when the stars are already in the LBV regime (which means that, according to our wind prescription, the wind mass loss does not change) or for relatively short periods of time that do not significantly impact the final properties of COs.
Current usage metrics show cumulative count of Article Views (full-text article views including HTML views, PDF and ePub downloads, according to the available data) and Abstracts Views on Vision4Press platform.
Data correspond to usage on the plateform after 2015. The current usage metrics is available 48-96 hours after online publication and is updated daily on week days.
Initial download of the metrics may take a while.