| Issue |
A&A
Volume 694, February 2025
|
|
|---|---|---|
| Article Number | A83 | |
| Number of page(s) | 13 | |
| Section | Stellar structure and evolution | |
| DOI | https://doi.org/10.1051/0004-6361/202451531 | |
| Published online | 05 February 2025 | |
Population synthesis of Thorne-Żytkow objects
Rejuvenated donors and unexplored progenitors in the common envelope formation channel
1
Max-Planck-Institut für Astrophysik, Karl-Schwarzschild-Str. 1, D-85748 Garching, Germany
2
Center for Computational Relativity and Gravitation, Rochester Institute of Technology, 85 Lomb Memorial Drive, Rochester, NY 14623, USA
3
Steward Observatory, University of Arizona, 933 North Cherry Avenue, Tucson, AZ 85721, USA
4
Department of Physics, Technion, Haifa 3200003, Israel
5
Department of Astronomy and Astrophysics, University of California, Santa Cruz, 1156 High Street, Santa Cruz, CA 95064, USA
6
Department of Physics and Astronomy, University of North Carolina at Chapel Hill, 120 E. Cameron Ave, Chapel Hill, NC 27599, USA
⋆ Corresponding authors; This email address is being protected from spambots. You need JavaScript enabled to view it.
, This email address is being protected from spambots. You need JavaScript enabled to view it.
Received:
16
July
2024
Accepted:
12
November
2024
Abstract
Context. Common envelope evolution of a massive star and a neutron star companion has two possible outcomes: the formation of a short-period binary (a potential gravitational wave source progenitor) or the merger of the massive star with the neutron star. If the binary merges, a structure may form, comprised of a neutron star core surrounded by a large diffuse envelope, known as a Thorne-Żytkow object (TŻO). The predicted appearance of this hypothetical class of star is very similar to that of a red supergiant, making it difficult to identify them in observations.
Aims. Our objective is to understand the properties of systems that are potential TŻO progenitors; specifically, binary systems that enter a common envelope phase with a neutron star companion. We also aim to distinguish those that have been through a previous stable mass transfer phase, which can rejuvenate the accretor.
Methods. We used the rapid population synthesis code COMPAS at solar metallicity, with the common envelope efficiency parameter set to unity, to determine the population demographics of TŻOs. We used one-dimensional (1D) evolutionary TŻO models from the literature to determine a fit for the TŻO lifetime to estimate the current number of TŻOs in the Milky Way, as well as to assess core disruption during the merger.
Results. We explored the progenitors in the Hertzsprung-Russell diagram, calculated the formation rates, and investigated the kinematics of the progenitor stars. We find that the vast majority (≈92%) of TŻO progenitors in our population have experienced mass transfer and are rejuvenated prior to their formation event. For the Milky Way, we estimate a TŻO formation rate of ≈4 × 10⁴ yr−1, which results in ≈5 ± 1 TŻOs at present.
Key words: binaries: general / stars: massive / stars: neutron
© The Authors 2025
 Open Access article, published by EDP Sciences, under the terms of the Creative Commons Attribution License (https://creativecommons.org/licenses/by/4.0), which permits unrestricted use, distribution, and reproduction in any medium, provided the original work is properly cited.
This article is published in open access under the Subscribe to Open model.
Open Access funding provided by Max Planck Society.
1. Introduction
In the late 1930s, Landau (1938) and Oppenheimer & Volkoff (1939) first theorized that stars could have dense neutron cores. Four decades later, Thorne & Zytkow (1975, 1977) predicted and calculated the first structural models of a stable configuration of a star with a neutron star (NS) core surrounded by a diffuse envelope, later designated as a Thorne-Żytkow object (TŻO).
TŻOs are a theoretical class of star that resemble an ordinary M supergiant on the surface, despite the NS core hiding beneath (e.g., Thorne & Zytkow 1977; Farmer et al. 2023). Multiple formation channels have been proposed, such as the merger of a non-degenerate star and NS via common envelope (CE) evolution (e.g., Taam et al. 1978; Terman et al. 1995, but see also Ablimit et al. 2022, where TŻOs are proposed to form via CE evolution with a white dwarf core), direct collision of the NS with the stellar core via a kick (e.g., Leonard et al. 1994; Hirai & Podsiadlowski 2022) or dynamical mergers within a cluster or triple system (e.g., Ray et al. 1987; Eisner et al. 2022). The collision and dynamical formation channels are thought to have very low rates comparatively (Podsiadlowski et al. 1995; Renzo et al. 2019; Grichener 2023). Thus, the focus of this paper is the CE channel scenario.
TŻOs which form via CE evolution share a common channel with most NS binaries (NS-NS) in the Galaxy (Tauris et al. 2017). The channels are the same up to the formation of the CE; if the CE fails to eject a TŻO may form, otherwise a NS-NS will then form with a successful envelope ejection. This same channel was suggested to account for GW170817 (e.g., Vigna-Gómez et al. 2018; Kruckow et al. 2018), the first gravitational wave signal observed by the Laser Interferometer Gravitational-wave Observatory (LIGO) and Virgo from the inspiral of a NS-NS (Abbott et al. 2017). An outline of the CE channel is shown in Fig. 1, starting with the binary at the zero-age main sequence (ZAMS) in step 1. After undergoing mass transfer (MT) through Roche lobe overflow (RLOF) and stripping (steps 2 and 3), the first supernova (SN) occurs (step 4). At this point, when there is just one NS and one non-degenerate star (step 5), there are several possible outcomes for the binary. If the explosion ejects enough mass or the natal kick received by the NS is high enough (or both at the same time), the binary may become unbound (e.g., Blaauw 1961; Boersma 1961). This comprises the fate of the vast majority of massive binaries (e.g., Eldridge et al. 2011; Renzo et al. 2019). If the binary remains bound and the orbital evolution imposes it, a CE may follow (step 6; e.g., Paczynski 1976; Taam et al. 1978; Webbink 1984; Iben & Livio 1993; Ivanova et al. 2013, 2020; Röpke & De Marco 2023), which is thought to be crucial to the formation of NS-NSs (e.g., Tauris et al. 2017; Vigna-Gómez et al. 2018; Gallegos-Garcia et al. 2023).
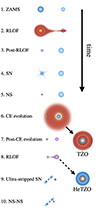 |
Fig. 1. Schematic showing the CE formation channel for TŻOs, based on Fig. 1 of Vigna-Gómez et al. (2020), Vigna-Gómez & Rebagliato (2020). The chronology and the nomenclature is the following. 1. Zero-age main sequence (ZAMS); 2. Roche lobe overflow (RLOF); 3. Post-RLOF, or envelope detachment; 4. Supernova (SN) of the primary; 5. Neutron star (NS) forms from the SN explosion; 6. Common envelope evolution (CE evolution); 7. Post-CE evolution, which can lead to either the ejection of the envelope, forming a stripped star + NS, or the formation of a TŻO from the merger of the NS and the stellar core; 8. RLOF of the stripped binary, further stripping the companion star; 9. Ultra-stripped SN of the companion star; and 10. NS binary. The solid arrow from step 6 indicates the CE formation channel for TŻOs and the dashed arrow from step 8 shows the alternative channel to a TŻO with a HeMS donor star. |
During the CE phase, a non-degenerate star overflows its Roche lobe and initiates dynamically unstable MT with its NS companion. A CE forms around the NS and the core of the companion. Drag and frictional forces in this configuration lead to a rapid inspiral phase that decreases the orbital separation of the binary. If the envelope is ejected before the NS reaches the core, then the binary becomes a short-period NS + stripped-star binary (e.g. Götberg et al. 2020), the ideal candidate for a NS-NS progenitor (steps 7 through 10 in Fig. 1). Alternatively, the NS and core can merge, resulting either in a luminous transient (e.g., Chevalier 2012; Soker & Gilkis 2018; Soker et al. 2019; Dong et al. 2021; Grichener & Soker 2023) or a TŻO. In this study, we use the terms “TŻO” and “TŻO candidate” interchangeably to describe these merger products, while remaining agnostic to the details of establishing a stable post-merger structure.
Following the pioneering work on structural models by Thorne & Zytkow (1975, 1977), Biehle (1991) extended the static model space by constructing models that had a convective burning region based on the rapid-proton process. The first evolutionary models of TŻOs were created by Cannon et al. (1992) and Cannon (1993), and more recently revisited by Farmer et al. (2023). High-mass TŻOs (≳12 M⊙) have a completely convective envelope and extremely high temperatures close to the NS (Eich et al. 1989; Cannon 1993). Consequently, they undergo the interrupted rapid-proton (irp) process, which is expected to result in a unique chemical abundance profile (Biehle 1994; Cannon 1993) that may possibly be used as an observational signature. Lower mass TŻOs are supported by accretion onto the NS and are not expected to have a discernible observational signature from red giants, as they have a radiative envelope and therefore no irp-process. For a deeper discussion of TŻO structure and chemical profile analysis, we refer to Cannon et al. (1992), Cannon (1993), Levesque et al. (2014), and O’Grady et al. (2020, 2023, 2024).
TŻOs are an exciting prospect in stellar physics, as they are part of an exotic class of theoretical star-like objects. Their interiors and unique nucleosynthetic processes are an excellent test of the capabilities of state-of-the-art stellar evolution codes (Levesque et al. 2014; Farmer et al. 2023). They are excellent candidates for multimessenger astronomy, as the asymmetries and rapid rotation of the NS core are expected to emit continuous gravitational waves (DeMarchi et al. 2021). In practice, TŻOs are very difficult to distinguish from red (super)giants through electromagnetic only observations (Biehle 1991, 1994; O’Grady et al. 2020; O’Grady et al. 2023). The current candidates, HV 2112 (Levesque et al. 2014), VX Sgr (Tabernero et al. 2021), and HV 11417 (Beasor et al. 2018), have all been identified through unusual chemical abundance profiles, although there is still a great deal of ongoing debate regarding their classification (e.g., Coe & Pightling 1998; Vanture et al. 1999; Tout et al. 2014; Maccarone & de Mink 2016; Tabernero et al. 2021; Farmer et al. 2023).
In this study, we investigate TŻO progenitor systems in detail. Although there are many processes in binary evolution that have been studied previously or merit further investigation, for simplicity we focus on one important aspect in this work, namely: the role of rejuvenation, which can change the stellar structure (Hellings 1984; Renzo et al. 2023). Rejuvenation occurs when a star in a binary experiences stable RLOF and transfers mass onto its main sequence (MS) companion (e.g., Neo et al. 1977; Hellings 1983, 1984, see step 2 of Fig. 1). Accretion causes the MS accretor to increase its mass and consequently leads to an increase in the size of the convective core. As the core mass increases, unburnt material from outside the core is mixed through the convective boundary, refueling the core with fresh hydrogen and rejuvenating the accretor star. This process is not driven by rotation, as even non-rotating models can become rejuvenated (Renzo et al. 2023; Wagg et al. 2024).
The change in structure in the core-envelope boundary region due to rejuvenation affects the binding energy of the accretor after the MT phase. The core-envelope boundary region contains most of the mass of the envelope; therefore, structure changes in that layer have a long-lasting impact on the envelope, which is amplified later on by the evolutionary contraction of the core. Renzo et al. (2023) showed that the binding energy at a fixed total mass and radius is still lower after rejuvenation than that of an unrejuvenated star of the same mass and radius. This implies that if a binary system consisting of a NS and a rejuvenated star engages in a CE phase, it is possible that the less bound envelope of the rejuvenated star could be ejected, resulting in a short-period stripped binary, instead of a TŻO. Most massive binaries leading to NS-NSs experience stellar rejuvenation (Vigna-Gómez et al. 2018, 2020). However, the impact of rejuvenation is not yet fully understood and it is conceivable that it might have contradictory effects on the formation rate of TŻOs.
In this paper, we use rapid population synthesis to quantify and characterize binary systems that enter a CE phase with a NS companion. We then distinguish between those that merge (i.e., TŻO candidates) and those that do not (i.e., NS-NS candidates). We determine the potential impact of rejuvenation of the companion at the population level for NSs interacting with non-degenerate stars. We calculate the formation rate of TŻOs per unit solar mass (M⊙) and per SN and estimate the predicted number of TŻOs in the Galaxy. We also explore the potential effect of rejuvenation on the formation and merger rate of double compact objects (DCOs). In Sect. 2, we discuss our synthetic population and how we identify and quantify systems of interest. In Sect. 3, we present our results. We set them in context and discuss their broader implications in Sect. 4. We conclude with a brief summary in Sect. 5.
2. Methods
2.1. Data and initial distributions
We used the synthetic stellar populations from Grichener (2023)1, generated with the rapid binary population synthesis code COMPAS2, version 02.31.06 (Stevenson et al. 2017; Vigna-Gómez et al. 2018; Team-COMPAS et al. 2022). For emulating single-star evolution, COMPAS uses the analytical fits of Hurley et al. (2000), based on the stellar models of Pols et al. (1998). For binary evolution, COMPAS follows Hurley et al. (2002). The stellar models extend up to 50 M⊙; therefore, COMPAS extrapolates for stars of higher masses. During binary evolution, COMPAS accounts for mass loss through stellar winds, MT via RLOF, CE episodes, SNe, and gravitational wave radiation. COMPAS version 02.31.06 does not account for rotation, magnetic braking, nor tidal interactions. For more details, we refer to the COMPAS methods paper (Team-COMPAS et al. 2022).
Grichener (2023) studied NSs and black holes (BHs) that merged with giant secondaries during CE evolution using synthetic populations of 10 million massive binaries at various metallicities and CE efficiency parameters (see Eq. 1). In this study, we use the population created with solar metallicity (Z = Z⊙ = 0.0142, Asplund et al. 2009) and CE efficiency parameter set to unity. The setup is based on the Fiducial model from Vigna-Gómez et al. (2018). We defined the star with the larger ZAMS mass as the primary and denoted its mass as M1 throughout the evolution. In this synthetic population, the primary mass at the ZAMS is drawn using a Kroupa (2001) initial mass function (IMF), which takes the form  from 5 M⊙ to 100 M⊙. The mass, M2, of the secondary star is then calculated from a flat distribution in the initial mass ratio (q = M2/M1) between 0.1 and 1, largely consistent with observational constraints (Sana et al. 2012; Kobulnicky et al. 2012; Offner et al. 2023). The initial separation, ai, is drawn from a flat-in-log distribution from 0.1 au to 1000 au (Abt 1983; Sana et al. 2012). The eccentricity is set to zero at ZAMS. We elaborate on our assumption on the CE parameters in Sect. 2.1.1 and compact object remnants in Sect. 2.1.2.
2.1.1. Mass transfer and common envelope evolution
MT is one of the most common ways through which stars in a binary can interact. It occurs when the (donor) star fills its Roche lobe and begins to deposit mass onto its companion: the accretor star. The point at which a donor star has filled its Roche lobe is determined using the fitting formulae for the Roche radii from Eggleton (1983). The dynamical stability of MT (i.e., whether it results in stable RLOF or a CE event) is determined solely by the stellar properties at the onset of MT. Although the analytic prescriptions determining the stability are meant to capture the long term stability based on the instantaneous initial conditions, it is possible for stable MT to become unstable over time (e.g., Ivanova et al. 2020). However, this is not currently implemented in COMPAS.
To assess the stability of the MT episode, we use the criterion of Soberman et al. (1997), which compares how the radius of the donor star changes with mass loss (ζstar ≡ dlnRstar/dlnM) versus how the radius of the Roche lobe changes with MT (ζRL ≡ dlnRRL/dlnM). This criteria is sensitive to the amount of mass accreted by the companion (accretor) and how much specific angular momentum is removed from the system by the non-accreted mass. If ζstar is greater than ζRL, then the MT is assumed to be stable. The amount of mass removed from the donor depends on its stellar type. For donors on the MS, mass is removed until they are able to fit within their Roche lobe, at which point the MT episode ends. For donors with a defined core/envelope structure (i.e., post-MS), the whole envelope is removed on a thermal timescale. The amount of accreted mass depends on the stellar type of the accretor. In the synthetic population, we assume no accretion onto compact objects during CE evolution, as it does not impact the results (Grichener 2023). Material that is not accreted is removed from the system with the specific angular momentum of the accretor (for additional details, see Sect. 4.2 of Team-COMPAS et al. 2022).
Binary systems with NSs tend to experience dynamically unstable MT, which leads to CE evolution. During CE evolution, the orbital separation can drastically decrease within several orbits; the CE evolution can result in the ejection of the envelope or merger. To estimate the outcome of a CE episode, COMPAS uses the “αCE-λ” energy formalism to calculate the orbital separation following the CE phase (Webbink 1984; Livio & Soker 1988; Iben & Livio 1993; Ivanova et al. 2013). The energy formalism equates the change in orbital energy (ΔEorb) before and after CE evolution with the binding energy of the CE (Ebind) as
 (1)
(1)
where αCE is the CE efficiency factor that parameterizes the fraction of orbital energy that can be used to eject the CE, which is set to unity in our simulations (i.e., αCE = 1). COMPAS estimates the binding energy of the envelope by calculating the structure parameter λ (on the order of unity) using the “Nanjing lambda” prescriptions of Xu & Li (2010a,b), so that
 (2)
(2)
where G is the gravitational constant, M is the mass of the (secondary) star, Menv is the mass of the envelope, and R is the stellar radius. For our case of a NS engulfed by a star, we write Eq. (1) as
 (3)
(3)
where Mcore is the core mass of the non-degenerate star at the onset of CE evolution, MNS is the mass of the NS, and apre − CE and apost − CE are the orbital separations before and after CE evolution, respectively. We can then solve for the post-CE separation by substituting Eq. (2) for Ebind in Eq. (3) to determine if a system merges. The binary is assumed to be circularized throughout the CE episode; therefore, the post-CE eccentricity is zero. In our synthetic population, we define a binary system as merged if it fits the condition apost − CE ≤ Rcore. Contrary to Grichener (2023), we have taken Rcore as the radius of the stripped star as computed by COMPAS. If a star enters a CE with a NS companion and merges, we consider it to be a TŻO candidate.
2.1.2. Compact object remnants
A SN must occur before the CE to form the NS that makes the core of the TŻO. COMPAS considers four SN scenarios: regular core-collapse SNe (CCSNe), electron-capture SNe (ECSNe), ultra-stripped SNe (USSNe), and pair-instability SNe (PISNe). It uses the pre-SN core and envelope masses to determine SN type. Our synthetic population, at solar metallicity, does not contain any PISNe (Langer et al. 2007; Farmer et al. 2019).
When a SN occurs, some material can fall back onto the core remnant. The fraction of material that falls back is known as the “fallback fraction” and it determines how much material is not ejected during the SN. A fallback fraction of unity means that all material falls back onto the remnant, there is no ejecta and the stellar collapse is not observable. To determine the SNe rate (NSNe), we find all the CCSNe and ECSNe events with a fallback fraction less than unity. Out of the 10 million simulated binaries, we find 4 222 994 core-collapse events predicted to be associated with an observable SN; and thus define ℛ = N/NSNe = N/4 222 994, which normalizes our event rates to the number of SNe (we do not consider Type Ia nor Type Ibc SNe in our estimates) in our synthetic population.
We only followed systems that remain bound after the first SN and we did not follow the evolution of unbound stars and DCOs. Therefore, we did not account for the SN explosions that occur in these systems in our SN rate estimate. However, we estimate this to change the total SN rate by only a factor of ≲2.
In our population, the maximum NS mass is set to 2 M⊙ (Özel et al. 2010), which reproduces the hypothetical mass gap between NSs and BHs (although this is not confirmed, see, e.g., Siegel et al. 2023 and Zhu et al. 2024). The NS natal-kick distribution is bimodal Maxwellian, with CCSNe at the higher mode of 265 km s−1 and with ECSNe and USSNe at the lower mode of 30 km s−1 (Vigna-Gómez et al. 2018). The BH natal kicks are drawn from the same distributions and then the kick magnitude is reduced using the fallback model from Fryer et al. (2012).
We assume 100% primordial binarity, although the previously mentioned 1000 au upper limit on the semi-major axis means that approximately half of all binaries in the synthetic population do not interact at any point in their evolution. If the binary has an eccentricity equal to or greater than unity after the natal kick, the binary becomes gravitationally unbound.
2.2. Identifying subpopulations of interest
We filtered our synthetic population to identify which systems have an evolutionary channel that leads to TŻO candidate formation. Figure 1 presents an overview of the TŻO evolutionary channel studied in this paper, as explained in detail in Sect. 1. Our goal is to characterize TŻO demographics, which involves also quantifying systems with similar evolutionary pathways. To this effect, we first identified systems consisting of a star with a NS companion. We then distinguished between systems that later undergo CE evolution and those that become disrupted following the SN (the unbound stars). Systems that undergo CE evolution can result in either the ejection of their envelope (the stripped star and NS candidates; hereafter referred to as star + NS) or mergers of the NS with the stellar core (TŻO candidates).
As star + NS systems continue to evolve, the naked core can have its own core-collapse event (the second one in the system) and become a NS or a BH. As previously shown, TŻOs and DCOs have similar evolutionary channels (see, e.g., Belczynski et al. 2016; Vigna-Gómez et al. 2018; Broekgaarden et al. 2021; Grichener 2023 and Fig. 1); thus, we can also quantify the DCOs in the population, filtering as NS-NS, BH-BH, and NS-BH and subcategorizing based on whether the binary will merge within the age of the Universe. The coalescence time of DCOs via gravitational waves is based on Peters (1964). If it is less than the Hubble time, the system is a merger candidate.
The rejuvenated stars or their progenitors can be present in any of the aforementioned subpopulations, as rejuvenation only requires stable MT onto a MS star. When rejuvenation occurs, the internal structure of the accretor is reorganized on a timescale comparable to a few convective turnover timescales of the accretor’s core or the MT timescale (whichever is shorter). In most cases, this means a timescale comparable to or shorter than the global thermal timescale of the accretor (Renzo et al. 2023). As the thermal timescale of the accretor is much shorter than the typical remaining lifetime of the donor post-MT, it is likely that the accretor is in thermal equilibrium by the time the primary collapses and undergoes a SN. We identified stellar companions in all of our subpopulations that had accreted via stable MT while on the MS and flagged them as rejuvenated.
2.3. Statistical uncertainties
To assess the statistical uncertainty in the outcomes of our population synthesis simulations, we used the Clopper-Pearson method (Clopper & Pearson 1934). This approach, also known as the exact binomial confidence interval, is based on the cumulative distribution function of the binomial distribution. The statistical error arises from the finite sample size of 10 million stellar binary systems, within which we identified our different subpopulations. If we were to draw different samples of 10 million systems, the numbers would vary due to random sampling variability. The Clopper-Pearson intervals account for this variability by providing a range within which the true results are likely to fall, with a specified confidence level. The intervals were computed using the beta.ppf function from the SciPy library, providing a robust measure of the statistical uncertainty associated with our estimated outcome rates. Within our synthetic population, we found the likelihood of having a statistically different number of TŻO progenitors, star + NS progenitors, or unbound stars under a 1% confidence level.
2.4. Galactic rate estimates
To estimate the number of TŻO candidates existing in the Milky Way today, we require the time of TŻO formation, as well as the time the TŻO remains observable in that configuration, along with the Galactic star formation rate (SFR). For the duration for which TŻOs remain observable (i.e., the TŻO lifetime), we used the models from Farmer et al. (2023) to approximate the TŻO lifetime as a function of the total TŻO mass. These models have a mass range of 5–20 M⊙, so we extrapolate the fit to be flat outside of this range. The resulting linear fit is
 (4)
(4)
where m is the mass of the TŻO in solar masses. Farmer et al. (2023) determined a TŻO lifetime of  years, which is comparable or shorter to models from Cannon et al. (1992), Cannon (1993). We calculated our fit as accurate within ≲6%.
For the formation rate, we followed the procedure outlined in Appendix B of Chruslinska et al. (2018). To estimate when a TŻO progenitor is formed, we assumed a constant SFR in the Galaxy, SFRGal = 2.0 ± 0.7 M⊙ yr−1 (Elia et al. 2022). In practice, this means that each TŻO progenitor system was assigned a random birth time (τbin) between 0 Gyr and 10 Gyr (TGal). We then calculated the delay time for each TŻO (τdelay), which is the sum of their binary progenitor birth time and their formation time (τform), τdelay = τbin + τform. We added the TŻO’s lifetime from Eq. (4) to the delay time,  . If this sum is greater than or equal to the age of the Galaxy, TGal, then the TŻO currently exists and we increment
  , which is the unnormalized number of TŻOs in the Galaxy.
The final step to obtain estimations for the number of TŻOs in the Galaxy as well as TŻOs per solar mass is to normalize our values to the total stellar mass formed in the Galaxy over its lifetime. We accounted for the full IMF, which includes stars less massive than the 5 M⊙ lower limit in our synthetic population. We calculated a total stellar mass of Msim = 6 × 10⁸ M⊙, assuming that all stars are created in binaries3 and used a total mass range of 0.08–100 M⊙. The synthetic population uses a mass range of 5–100 M⊙, since a TŻO requires a NS to form; therefore, progenitor systems must have a massive primary that experiences core collapse. While stars with an initial mass of ≲5 M⊙ will not experience core-collapse, NS formation is still possible due to MT. We then normalized  with nnorm = TGal × SFRGal/Msim. The final number of TŻOs expected in the Galaxy is
  . The TŻO formation rate per year is calculated as the raw number of TŻOs in our synthetic population divided by Msim and multiplied by the SFR. We present the results in Sect. 3.1.
3. Results
3.1. Formation rates
Here, we present the formation rates of systems in the synthetic population (Fig. 2). Understanding the event rates in our population is key for constraining formation channels and predicting the likely end product of a binary. We find that the rate of systems in the synthetic population that undergo MT is ℛ ≈ 1.2, from which ℛ ≈ 0.85 for systems that have a CE evolution phase. There are more MT events than SNe, as the synthetic population has a lower mass limit of 5 M⊙; thus, not all stars in the population will end up exploding (see Sect. 2.1.2). While not all binaries in our synthetic population interact with their companions, those that do are likely to experience CE evolution.
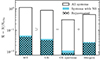 |
Fig. 2. Summary of the event rates in our synthetic population at Solar metallicity (Z = 0.0142, Asplund et al. 2009). We quantify the rate of binaries that experience the following (from left to right): mass transfer (MT), common envelope (CE) events (a subset of previous, can only lead to ejections or mergers), CE ejections, and mergers. For each column, the outline (black) indicates all binaries in the population that go through the event, the bar (light blue) indicates binaries with a NS, and hatching indicates companions to the NS rejuvenated by previous stable MT. The y-axis is in logarithmic scale and it shows the number of systems of interest (N) normalised by the number of SNe (NSNe, see Sect. 2.1.2 for more details). |
Systems with a NS that undergo CE evolution are possible progenitors for either TŻOs or star + NS systems; our synthetic population systems with a NS that undergo CE evolution have a formation rate of ℛ ≈ 0.040 (second column of Fig. 2). If we limit ourselves to systems with rejuvenated companions, the rate only drops by 14%, demonstrating the importance of understanding the impact of rejuvenation on massive interacting binaries.
Systems with a NS that merge with the core are defined as potential TŻOs and we find a rate of  . If the system does not merge, it is defined as a star + NS system and we found a rate of ℛstar + NS ≈ 0.011. We also estimated the number of TŻOs present in our Galaxy at the current moment (see Sect. 2.4). We found a TŻO formation rate of ≈4 × 10⁻⁴ yr−1 at solar metallicity. From this we estimate ≈5 ± 1 TŻOs in the Milky Way at the present.
In our synthetic population, we find that a NS-NS binary is an alternative to TŻO formation (Fig. 1). However, due to the large uncertainties in MT prior to the second SN explosion and mass accretion onto the NS, we believe that NS-BH and BH-BH might also be an alternative outcome of the TŻO CE formation channel. Figure 3 presents the DCO rates in our synthetic population at solar metallicity. These systems are categorized by whether they will merge within a Hubble time or remain a binary, with each bar in the figure representing the total number of systems of the stated type. With the exception of BH-BH systems that do not merge, the DCOs in our population (mergers and not) are evenly split between staying a binary and merging, due to gravitational wave emission. NS-NS systems are the most rare, with ℛNS − NS ≈ 0.002, and the vast majority (91%) of NS-NS systems had a rejuvenated companion before both SNe, regardless of whether or not they merge. We find a BH-BH rate of ℛBH − BH ≈ 0.004, with 96% of merging systems having had a rejuvenated companion before both SNe and only 23% of non-merging systems with a rejuvenated companion before both SNe. This is because merging systems must interact, increasing the chances of previous rejuvenation. Wider systems do not have this requirement and can evolve from MS to BH without ever interacting. NS-BH systems have a rate of ℛNSBH ≈ 0.003 and 96% had a rejuvenated companion before the second SN. We find that over 90% of DCO binaries have rejuvenated stars, indicating that including the effects of rejuvenation in COMPAS simulations and post-processing is pertinent.
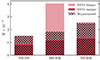 |
Fig. 3. Summary of the double compact object (DCO) rates in our synthetic population at Solar metallicity (Z = 0.0142). We quantify the rates of DCOs (from left to right): NS-NS binaries, BH-BH binaries, and NS-BH binaries. For each column, the upper portion (light pink) indicates non-merging DCOs, the lower column (dark pink) indicates DCOs that merge in a Hubble time, and the hatching indicates DCOs that had a rejuvenated companion before both SNe. The y-axis is scaled as in Fig. 2. |
3.2. Progenitors in the Hertzsprung-Russell diagram
Once we have quantified the formation rates of our subpopulations of interest (Sect. 3.1), we can focus our attention on the location of TŻO and star + NS progenitor systems in the Hertzsprung-Russell diagram (HRD). Figure 4 presents systems with a star and a NS at the onset of RLOF leading to CE. They are further divided by whether they merge (TŻO candidate) or eject the CE (star + NS candidate). The histograms above and to the right of the main panel show that the majority of donors in both of these populations have experienced a previous stable MT event and become rejuvenated.
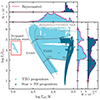 |
Fig. 4. HRD showing the progenitors of TŻO candidates (light blue) and star + NS systems (dark blue) at Solar metallicity (Z = 0.0142). These progenitors are shown at the onset of RLOF leading to a CE event. Two representative single star tracks (Hurley et al. 2000) for 5–20 M⊙ are shown as solid lines (gray). ZAMS and the terminal-age main sequence (TAMS) are shown as dotted lines (black). The Humphreys-Davidson limit (Humphreys & Davidson 1994) is shown as a dotted line (gray). Above and to the right: Histograms showing the rate density of TŻO and star + NS progenitors in their respective colors. The outline (pink) indicates the subset of systems with a rejuvenated companion. The y-axes of the histograms are scaled by the number of observable SNe in the synthetic population (see Sect. 2.1.2 for more details). |
At the onset of RLOF, the TŻO donor progenitors exhibit a mass range of ≈2 M⊙ to ≈110 M⊙ and star + NS donor progenitors exhibit a mass range of ≈2 M⊙ to ≈68 M⊙. Previous TŻO models have had an upper mass limit of ≈60 M⊙ (e.g., Cannon et al. 1992; Farmer et al. 2023; Hutchinson-Smith et al. 2023), meaning this population could potentially indicate TŻOs more massive than have been modeled thus far. We find that hotter stellar donors always result in mergers, while cooler donors might result in envelope ejection (e.g., Klencki et al. 2021). Examining the features of the HRD, we can see that stellar donors of TŻOs can be on the MS, even close to the ZAMS, when the CE begins. Stellar donors for star + NS systems, however, are limited to the end of the Hertzsprung gap (HG) and within the asymptotic giant branch (AGB). There is a horizontal gap at 104.5 L⊙, a numerical feature from the fitting formulae, which enhances the gap between stars that begin core He burning while in the HG and stars that do not reach the required core temperature until after crossing the HG into the AGB (for more details, see Vigna-Gómez et al. 2020). There is also a lack of TŻO progenitors past the MS for donors below 5 M⊙. These donor stars have white dwarf companions rather than NS companions. These systems may result in interesting transients, such as late SNe (Zapartas et al. 2017).
3.3. Kinematics
SN explosions lead to NS (and BH) formation, and the violent explosion is usually accompanied by a natal kick (e.g., Fryer et al. 2012; Vigna-Gómez et al. 2018). The sudden change in the velocity of the newly born compact object alters the orbit and changes the center-of-mass velocity (vCoM) of the system. We investigate these center-of-mass “spatial velocities” as well as their relationship to the mass of the secondary (the donor) in Fig. 5. Here, we explore whether there are distinct, unequivocal signatures to differentiate between unbound stars (which become unbound after the first SN explosion and do not undergo CE evolution) and TŻOs.
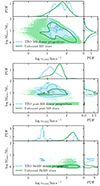 |
Fig. 5. Mass of the secondary plotted against the center-of-mass speed for TŻO progenitors (light blue) and unbound stars (green) on the MS (top), post-MS (middle), and HeMS (bottom). The contours enclose 90% of the systems. Above and to the right of the main panel are histograms showing the density, normalized so that each integrates to unity. |
Overall, the unbound stars (see step 4 of Fig. 1) dominate the parameter space, as the TŻO rate is  and the unbound star rate is ℛunbound ≈ 0.83; that is, the formation rate of unbound stars in our synthetic population is approximately 27 times greater than that of the TŻOs. It is useful to try and differentiate between TŻOs and unbound stars. We do so by taking TŻO progenitors on the MS, past the MS, and at a stage where they become stripped stars depleted of hydrogen and rich in helium (HeMS) and comparing them to unbound stars in the same respective stages. In general, unbound stars are more massive and their velocity has negligible dependence on the natal kick of the NS or BH formed when the companion explodes; thus, they move more slowly (Eldridge et al. 2011; Renzo et al. 2019). TŻOs are formed from binaries that do not become unbound when the primary undergoes a SN, meaning the magnitude of the natal kick of the NS is likely smaller (or it is in a tight binary), and vCoM is strongly dependent on it (Eldridge et al. 2011; Renzo et al. 2019; van der Meij et al. 2021).
For the MS subpopulation (top panel of Fig. 5), we find  for the MS TŻO donor progenitors and ℛMS unbound ≈ 0.71 for the MS unbound stars. The top panel of Fig. 5 shows nearly complete degeneracy in donor mass and vCoM. For the subpopulation with stars beyond the MS (middle panel of Fig. 5), we find
  for the TŻO progenitors and ℛpost − MS unbound ≈ 0.045 for the unbound stars. The TŻO donor and unbound star progenitors show less overlap in both mass and vCoM. The TŻO progenitors have a higher mass range, reaching up to ≈65 M⊙, while the unbound stars have a maximum mass of ≈30 M⊙. The vCoM of the TŻO progenitors suggest they move slower than the unbound stars, as higher velocities imply a higher chance of being disrupted. Mass, which is strongly correlated to luminosity, is a prominent distinguishing feature in these distributions; i.e., massive (greater than ≈30 M⊙), luminous objects might serve as an observable indicator of TŻOs.
For the subpopulation with HeMS stars (bottom panel of Fig. 5), we find  for the HeMS TŻO donors (dashed arrow in Fig. 1) and ℛHeMS unbound ≈ 0.008 for the HeMS unbound stars. This subpopulation shows strong differentiation between the TŻO and unbound star progenitors. While the number of HeMS TŻO donor progenitors in our synthetic population is two orders of magnitude smaller than that of the unbound stars, they have markedly higher donor masses, lower vCoM, and are depleted in hydrogen; these properties make them an extremely interesting prospect for future study (see Sect. 4.6 for a discussion).
In total, we find that vCoM and stellar mass are largely degenerate in the subpopulation of MS TŻO donor and unbound star progenitors, but are more clearly distinguished in the post-MS and HeMS subpopulations. The post-MS TŻO progenitors have a much higher maximum mass, which might serve as an observable indicator for TŻOs. The HeMS TŻO donor progenitors are small in number, but show clear differences to the unbound stars; thus, they are an interesting prospect for future studies. As the unbound stars have a much higher rate than the TŻO progenitors, finding TŻOs among observations of massive stars is challenging. It is likely that to indisputably identify a TŻO would require a combination of an unusual abundance profile, kinematics, and perhaps stellar pulsations (e.g., Levesque et al. 2014; Farmer et al. 2023).
4. Discussion
We have presented the population demographics of binary systems that enter a CE phase with a NS companion, using a solar metallicity-synthetic population generated with COMPAS and publicly available at Zenodo (see Sect. 2.1). In this discussion, we focus on the subset of the population that is predicted to result in a merger during CE evolution, which are the potential progenitors of TŻOs.
4.1. Rates
Throughout this work, we have focused on the formation rates of TŻO candidates, particularly CE evolution in field binaries under the premise that TŻOs can be successfully assembled through this channel (see Sect. 4.8 for a discussion on formation from collisions following a SN). Therefore, our quoted rates likely represent an optimistic estimate. Based on this premise, we find a TŻO formation rate per core-collapse SN of  , which is equivalent to ≈4 × 10⁻⁴ yr−1 in the Galaxy. From these values, we estimated ≈5 ± 1 TŻOs presently in the Milky Way (Sect. 3.1). We now compare these rates with those in the literature.
Grichener (2023) also calculates rates of NS and stellar core mergers using the same population, although they exclude progenitor systems with a MS donor and calculate Rcore using the fitting formulae of Hall & Tout (2014) for the a < Rcore merger condition. Moreover, they normalize based on the number of core-collapse SNe in the synthetic population – not filtering by fallback fraction; thus, they give a rate of ≈0.011 relative to core-collapse SNe (approximately one third of our rate). As TŻO progenitors with MS donors make up ≈25% of our TŻO subpopulation and the SN filtering discussed in Sect. 2.1.2 takes out ≈7% of the SN population, our differing rates do not impact our conclusions.
Cannon (1993) estimated 107 TŻOs in the history of the Galaxy. Using our value for the current number of TŻOs and the mean TŻO lifetime in our population (8.8 × 10⁴ yr), we estimate ≈3 × 10⁴ TŻOs across the history of the Galaxy. The large discrepancy is due to the fact that Cannon (1993) assumes that a TŻO is a later evolutionary stage for massive X-ray binaries (XRBs), with a significantly larger formation rate of ∼0.001 yr (Meurs & van den Heuvel 1989). It is common for massive X-ray binaries to have a CE evolution phase, but not all CE evolution phases lead to mergers, which is illustrated by our subpopulation of star + NS systems (see Fig. 2). However, the dichotomy between envelope ejection and stellar merger resulting in a TŻOs is not clearly understood and will be dependent on the evolutionary history of the progenitor star (see Sects. 4.3 and 4.5).
Our estimated formation rate matches the formation rates estimated by Podsiadlowski et al. (1995) and Hutilukejiang et al. (2018). They both consider the TŻO lifetime to be 105–106 yr, based on the calculations by Cannon (1993) and Biehle (1994). Under these assumptions, they both predicted similar rates: Podsiadlowski et al. (1995) predicted between 20 and 200 TŻOs in our Galaxy at any given moment, while Hutilukejiang et al. (2018) determined there are 15–150 TŻOs. In contrast, we use the 104–105 yr estimated TŻO lifetime based on the models from Farmer et al. (2023), which results in only 5 ± 1 TŻOs presently in the Milky Way. The major discrepancy between our number and the number found in Podsiadlowski et al. (1995) comes from the difference in assumed TŻO lifetime. Farmer et al. (2023) analyzed the pulsational stability of TŻOs and found modes with growing amplitudes, which lead the models to shed their envelopes (thus no longer TŻOs), impacting the lifetime (see also Romagnolo et al. 2025).
4.2. Formation uncertainties
In this study, we assess the role of recent work on stellar rejuvenation (Renzo et al. 2023), core disruption during stellar merger events (Everson et al. 2024; Hutchinson-Smith et al. 2023), and TŻO lifetimes from stellar models (Farmer et al. 2023) on the predicted population of TŻOs at Solar metallicity. However, we have not explored the many uncertainties coming from stellar and binary evolution in the proposed CE formation channel (Figure 1), such as the initial distributions or the first SN leading to the NS formation, which inevitably propagates to the rate uncertainties for TŻOs. Arguably, the main uncertainties are around the difficulties surrounding the CE phase.
The CE phase is complex and modeling its evolution is challenging (Ivanova et al. 2013; Röpke & De Marco 2023), making the determination of the outcome of a CE episode a rather uncertain endeavor. In rapid population synthesis, many simplifying assumptions have been made to determine which systems engage in a CE phase and, if they do, which systems lead to a CE (partial or total) ejection, or alternatively result in a merger. In order to determine which systems engage in a CE phase, COMPAS relies on mass-radius exponents which determine how the radius of the donor star responds to stripping of its envelope (see Sect. 2.1.1). For giant stars, which we consider as likely leading to a CE phase, COMPAS defines the mass-radius exponents in terms of polytropes (Soberman et al. 1997). However, polytropes are not the only way to calculate the mass-radius exponents. They can also be calculated with detailed one-dimensional (1D) stellar models, as done by e.g., Ge et al. (2020) and Temmink et al. (2023). This tentatively suggests that MT is more stable than previously thought. These models incorporate very rapid mass transfer and can account for such processes as the delayed dynamical instability, which is not currently included in COMPAS (e.g., Ge et al. 2010). While 1D detailed models offer important insights, it is important to note that three-dimensional (3D) radiation hydrodynamic simulations of the convective envelopes of giants suggest that 1D models are likely failing to accurately approximate radiation transport and opacities (Chiavassa et al. 2010; Jiang 2023; Goldberg et al. 2022), which directly affects the stellar radius.
Other methods for determining whether MT leads to a CE episode depend on either a stellar-phase-dependent critical mass ratio (e.g., Claeys et al. 2011, see Sect. 4.4) or a threshold for the formation of a convective envelope in the donor (Picker et al. 2024; Romagnolo et al. 2025), for which RLOF is then assumed to result in a CE phase. However, the stability of a MT episode with a NS accretor is not only determined by the structure and response to mass loss of the donor, but also by the response of the accretor to mass gain (e.g., Kippenhahn & Meyer-Hofmeister 1977; Wei et al. 2024; Lau et al. 2024). This stability is also very sensitive to assumptions about how the non-accreted mass is lost from the binary (e.g., Willcox et al. 2023; Ge et al. 2024).
Willcox et al. (2023) used COMPAS to study the impact of updating these criteria with new prescriptions for the critical mass ratios and, therefore, MT stability, based on Claeys et al. (2011) and Ge et al. (2020). They found that the mass-radius exponents are generally higher for all masses and radii, signifying that unstable MT (and therefore CE evolution) may occur less frequently than previously thought. These prescriptions assume fully conservative MT, which might not be the case for the TŻOs progenitors. In this work, we explore TŻOs which generally experience two MT episodes (Figure 1). The first MT episode, in which rejuvenation occurs, involves a donor star with a less evolved MS companion and mass ratio close to that at ZAMS; it is generally uncertain to what extent this MT episode is conservative. In the second MT episode, which potentially leads to TŻO formation, there is a donor star with a NS companion and a more unequal mass ratio; this MT episode is likely highly non-conservative. Ge et al. (2024) explored non-conservative MT, particularly in the context of NS high-mass X-ray binaries. They find that dynamically unstable mass transfer is more likely to occur for systems with extreme mass ratios and wide orbital periods, which correspond to more luminous and more extended systems in our population (Figure 4). For a deeper discussion of uncertainties in TŻO formation, we refer to O’Grady et al. (2024).
4.3. Progenitors
From our synthetic population, we have determined: (i) which binary star systems exhibit MT from a non-degenerate star onto a NS companion; (ii) if these MT episodes are dynamically unstable and lead to CE evolution; and (iii) if CE evolution will ultimately lead to a merger and, thus, to the possible formation of a TŻO. There are several uncertainties in the stellar evolution leading to the onset of MT (RLOF) and arguably even more in the merger process and the potential assembly of a TŻO (Langer 2012; Pavlovskii & Ivanova 2015; Everson et al. 2024; Ivanova et al. 2024). In this paper, we focus on providing insights in the properties of the TŻO stellar progenitor, rather than on the TŻOs themselves. Understanding the evolutionary pathways of TŻOs and providing their more common configurations will be crucial in assessing whether or not a TŻO can form (see Sect. 4.5).
Generally, the non-stripped stellar progenitors of TŻOs can be anywhere between the ZAMS and the (super)giant phase, with masses between 2 M⊙ and 110 M⊙, and effectively anywhere in the HRD (Fig. 4). There is, however, a slight preference for less evolved and more massive hot donors with envelopes that are significantly more gravitationally bound than those of their less massive cool counterparts. In our models, there is a non-negligible fraction (≈15%) of progenitors with masses above 20 M⊙ (middle panel of Fig. 5), which we consider as potential candidates for TŻOs (but see Sect. 3.3 for a discussion about unbound stars).
We find that the vast majority (92%) of TŻO progenitors have donor stars that have been rejuvenated. This means that the donor star has previously stably accreted mass during a MT episode (Fig. 2). Here, we analyzed the synthetic solar metallicity population from Grichener (2023). Metallicity influences the stellar radii across the evolution through different physical effects (e.g., Xin et al. 2022, and references therein). The possible variation with metallicity of the fraction of rejuvenated donors for CE with a NS remains to be studied.
Rejuvenation alters the structure of the accretor star, especially at the core-envelope boundary (see Sect. 1 for more details). The structural changes are highly uncertain and are likely to vary depending on the evolutionary stage of the star when rejuvenation occurs. Renzo et al. (2023) proposed that the altered structure could lower the binding energy of the envelope. Under the energy formalism used throughout this work (Sect. 2.1.1), the binding energy of the envelope must be lesser than αCEΔEorb for envelope ejection to occur. In our TŻO progenitor population, Ebind, while large enough to prevent envelope ejection, was still less than 1.5 times αCEΔEorb. Assessing the impact of structural changes in rejuvenated stars will require 3D simulations (Landri et al. 2024).
A decrease in the binding energy of the envelope of the donor could potentially have catastrophic effects on the formation rate of TŻOs due to the substantial increase in systems where the envelope is unbound, but would increase the formation of binaries with a NS and a stripped star. If we assume that TŻOs with rejuvenated stellar donors would be unable to form through the CE evolution channel due to the decrease in binding energy, the stripped binary formation rate could increase by a factor of four (Fig. 2). For these stripped binaries, the non-degenerate massive star in the binary would continue to evolve and potentially form a compact object. If the objects are close enough, they could merge within the age of the Universe, emitting gravitational waves detectable by ground-based observatories. Alternatively, the formation of wide DCO binaries in the Galaxy could also be detectable by space-based gravitational wave detectors (see Lau et al. 2020; Wagg et al. 2022). In summary, rejuvenation could potentially increase DCO formation and merger rates in the isolated binary formation scenario (but only by a factor of a few), and could drastically decrease the TŻO formation rate.
4.4. X-ray binaries as progenitors
Constraining TŻO rates using observations is difficult, as we are yet to confirm one and they are predicted to look very similar to red supergiants (Thorne & Zytkow 1975, 1977; Levesque et al. 2014; Farmer et al. 2023). Previous estimations of the TŻO rate has been based on forward modeling of XRBs (e.g., Podsiadlowski et al. 1995), as TŻOs and high-mass XRBs share an evolutionary path. Here, we briefly comment on population studies of these systems to gain some insights on their observed and predicted rates.
Unlike their less massive counterparts, high-mass XRBs transfer their mass through stellar winds. Because of their relatively short orbital periods (∼1 − 10 d), most of these high-mass XRBs will eventually expand and potentially fill their Roche lobes. Nevertheless, the outcome of the Roche lobe overflow episode is uncertain. Using a population of 69 Be XRBs from the Coe & Kirk (2015) catalog, Vinciguerra et al. (2020) argued that in order for a system to result in a merger, massive donors need to be extended and have an extreme mass ratio. In another study, Hutchinson-Smith et al. (2023) investigated LMC X-4, a tight (semi-major axis ≈14.2 R⊙) star + NS binary in the Large Magellanic Cloud with a mass ratio of 0.09 that has some of the most accurately measured orbital parameters of high-mass XRBs (Falanga et al. 2015). They predicted that after filling its Roche lobe, the stellar companion will engulf the NS, which will merge with the core, accrete mass, and subsequently collapse into a BH and form a thin-envelope TŻO (see Sect. 4.5). It is not unreasonable to expect similar systems in the Milky Way.
Ge et al. (2024) calculated critical mass ratios for non-conservative mass transfer for stellar models from 1 M⊙ to 100 M⊙ at Z = 0.001. They fit the maximum critical mass ratio as a function of the orbital period and found that as orbital period increased, the required mass ratio for unstable MT becomes more extreme, with a minimum of q = 0.05 at Porb = 400 d. Even for short period binaries (∼1 d), they predicted a maximum mass ratio of 0.4, above which MT is unstable and results in a CE episode. Finally, they compared 14 NS high-mass XRBs to their orbital period-mass ratio fit and found that ten of them lie in the unstable MT parameter space, although they speculated that seven of them might be helium stars, which have different critical mass ratios (see Sect. 4.6). We used the TŻO progenitors in our synthetic population that have mass ratios and periods within the parameter space of the Ge et al. (2024) study to do a rough comparison to the mass ratio-orbital period fit. We found that ≈70% fit the criteria for unstable MT, meaning that a CE would still form. A TŻO is still not certain at this step, as the binary must merge inside the envelope rather than eject it. Studies of the impact of the common envelope efficiency parameter on envelope ejection rates for star + NS binaries show that with the most extreme assumptions, the number of mergers decreases by an order of magnitude (Grichener 2023).
4.5. Core-disruption and thin-envelope TŻOs
Recent studies by Everson et al. (2024) and Hutchinson-Smith et al. (2023) have once again called into question the possibility of forming TŻOs (see also, e.g., Tout et al. 2014; Maccarone & de Mink 2016; Beasor et al. 2018), specifically in field binaries undergoing CE evolution. In their 3D hydrodynamical merger simulations, shocks generated by the inspiraling compact object propagate through the companion star and spin up the envelope and core, such that conditions are met to form a central accretion disk upon completion of the merger. Accretion disk formation disallows the internal structure required to form a stable TŻO (Podsiadlowski et al. 1995); thus, in their parameter space study, Everson et al. (2024) sought to determine cases in which accretion disk formation might be avoided, first looking at populations in which the stellar core of the companion remains intact through the merger. They provided a criterion for core disruption based on the tidal radius of the system ( ; qc ≡ MNS/Mcore), such that the core will be destroyed and form an accretion disk about the NS upon merger if rtidal > Rcore. This translates to a simple metric based on the mass ratio, qc ≤ 1, for the core to remain intact. Applying this metric, we find that ≈20% of TŻO progenitors in our synthetic population satisfy this criterion for core disruption (Fig. 6). These systems are preferentially low-luminosity (≲104 L/L⊙) post-MS stars. More luminous progenitors have cores massive enough that they generally avoid core disruption; this is primarily due to the binding energy of the core being directly proportional to the square of mass.
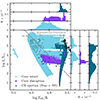 |
Fig. 6. HRD showing an alternative outcome of the CE phase (cf. Fig. 4). We analyze our synthetic population in the context of the evolutionary models from Everson et al. (2024). We assess the outcome of the CE evolution based on the criteria described by Everson et al. (2024) and show systems predicted to have an intact core (light blue), disrupted core (purple), and those that eject the CE (dark blue). The data from Everson et al. (2024) are overplotted as the same symbols with black outlines. We show a 30 R⊙ isoradial line, the cutoff for TETŻO formation, as a solid line (gray). The y-axes of the histograms are scaled by the number of observable SNe in the synthetic population (see Sect. 2.1.2 for more details). |
Using our synthetic population, we find that a non-negligible fraction of TŻO progenitors are more massive and luminous, covering a wider temperature range than those modeled by Everson et al. (2024). Their models are exclusively post-MS with an upper mass limit of ≲40 M⊙, lacking the resolution to coarsely fill the crossing of the HG.
A caveat within our method with respect to the simulations of Everson et al. (2024) is that our stellar tracks are based on fitting formulae (Hurley et al. 2000), which do not contain the details of the structure of the core. These simplifying assumptions mean that we can only estimate qc and, thus, the outcome of the NS plunge-in. One effect of these differences can be seen in Fig. 6, where the less luminous MS progenitors in our model retain an intact core when detailed stellar models in hydrodynamic simulations clearly suggest they will experience core disruption. For MS donors, we assume the core mass of the star to be approximately equal to its total mass, which naturally results in an overestimation of the core mass. Taking a fraction of the star’s mass as the core would increase the qc, favoring an outcome of core disruption.
Finally, Everson et al. (2024) found that all of their models, with both disrupted and non-disrupted cores, will form an accretion disk due to the angular momentum deposited by the NS during inspiral and merger, therefore preventing the assembly of stable TŻOs. From these failed TŻOs, they suggested instead that a thin-envelope TŻO (TETŻO) may be formed after the NS plunges in and subsequently collapses into a BH due to mass accretion. For these systems, if the binding energy of the core released during collapse or as accretion feedback is not sufficient to fully eject the post-merger remnant envelope, a small fraction (≲1%) of the initial envelope mass may remain as an optically thick (physically) thin envelope around the BH. The thin envelope reprocesses accretion luminosity from the central engine and emits in the X-ray band, possibly contributing to the population of ultraluminous X-ray sources. We explored their metrics within our population and provided an estimate of the number of TŻO progenitors that could become possible TETŻOs. We estimated the formation rate of these TETŻOs by considering the progenitors where the companion radius is ≤30 R⊙ (below which TETŻO formation may be most likely; see Fig. 7 of Everson et al. 2024) and we estimated their lifetime following Eq. 13 from Everson et al. (2024). From our population, and following the metrics provided by Everson et al. (2024), we obtain ≈1.1 × 10⁻⁴ TETŻOs per M⊙, which corresponds to  . This results in 1.5 ± 0.5 TETŻOs in the Milky Way, which would form instead of the 5 ± 1 TŻOs previously discussed.
4.6. Helium-rich TŻOs
We find a small fraction (≈0.1% of our TŻO subpopulation) of systems where the donor is a HeMS star (see Sect. 3.3). These HeMS donors originate via the same formation pathway discussed throughout this work. Following Fig. 1, after the successful ejection (step 6) of the CE, the newly stripped HeMS star in the binary (step 7) might later fill its Roche lobe (step 8), beginning a new MT episode. Typically, this episode of MT proceeds in a dynamically stable manner (Hjellming & Webbink 1987; Soberman et al. 1997; Vigna-Gómez et al. 2018). The CE evolution leading to HeTŻOs occurs ∼104 yr to ∼106 yr after the binary’s first CE event, well after the stripped star has had time to thermally readjust (Vigna-Gómez et al. 2022). In our population, ≈8% of the HeMS stars with a NS companion experience dynamically unstable MT, resulting in a HeTŻO. We find a formation rate of  for these systems, which may constitute a lower limit for the following reasons. First, the radii of these stars may be underestimated, although the effect is small at high metallicity, and stability criteria in this regime are highly uncertain and untested (Laplace et al. 2020). Second, COMPAS does not account for tidal evolution nor circumbinary disks in post-CE binaries (see, e.g., Valli et al. 2024, and references therein) that could lower the separation of post-CE systems, increasing the number of mergers. Therefore, both the possible underestimation of the radius and the effect of tides could mean we are underestimating the number of HeTŻOs.
HeMS TŻO progenitor donor stars in our synthetic population have luminosities between ≈5 × 10³ L⊙ and ≈5 × 10⁴ L⊙ with masses in the range from ≈2.5 M⊙ to ≈6 M⊙. With respect to their parameters as star + NS binaries, the mass ratio (MHeMS/MNS) of these systems ranges from 2.3 to 5.3 and the ζRL is between approximately 2 to 8. In COMPAS, the radius-mass exponent of HeMS stars is simplistically defined as a fixed number (ζHeMS = 2) and the accretion rate onto a NS is determined by the Eddington limit (Team-COMPAS et al. 2022), which is why the condition for dynamical instability (ζRL > ζHeMS) is met for a fraction of systems. It is not clear whether these configurations should actually result in a CE phase. Hjellming & Webbink (1987) used polytropic models to assess rapid MT in binaries; for radiative MS stars, they found that a dynamical instability might arise if the mass ratio is above the critical value of 2.14. Another approach is to consider the structure and response of HeMS stars, which was done by Zhang et al. (2024) and Ge et al. (2024). Zhang et al. (2024) assumed fully conservative MT and found the critical mass ratio below which unstable MT occurs to lie between 0.38 and unity. Overall, 65% of our HeMS TŻO progenitor donors have a mass ratio below 0.38, indicating that many of these systems would still enter into a CE. Conversely, Ge et al. (2024) assumed non-conservative MT and calculated a fit for the mass ratio-orbital period space for the He stellar donors (at Z = 0.02), finding a maximum mass ratio of 0.1 for unstable MT. If we follow this criteria, all of our HeMS TŻO donor progenitors undergo stable MT, meaning no CE and therefore no formation of HeMS TŻOs.
In Fig. 5, we show that HeMS TŻO systems have markedly different position in the mass and vCoM parameter space with respect to unbound HeMS stars. If formed, TŻOs from the HeMS evolutionary channel might be identifiable through their slow spatial velocities, unusually high masses, and lack of hydrogen spectral lines. These donor stars have a mass range of 2.5–5.9 M⊙, which is distinguishable from their unbound counterparts. Even if rare, these objects form an interesting avenue for future study, for example in the context of Luminous Fast Blue Optical Transients (Metzger 2022; Soker 2022).
4.7. Nucleosynthetic signatures
While the potential nucleosynthetic signature of high mass TŻOs has been discussed (see Levesque et al. 2014), the impact of rejuvenation and HeMS donors on the nucleosynthetic signature has not. In the case of rejuvenation, the accreted material is rich in He and N and poor in O and C, but these differences would not impact the outcome of the irp-process. Therefore, we do not expect nucleosynthesis from TŻOs to be significantly different due to previous rejuvenation.
Helium content, however, could have a noticeable impact on the abundance profile. The irp-process in high mass TŻOs is expected to lead to production of rubidium, strontium, yttrium, and molybdenum (Cannon 1993) as well as an overabundance of lithium (e.g., Podsiadlowski et al. 1995). These spectral features have been key tools in the search for TŻO candidates (Levesque et al. 2014; O’Grady et al. 2020; O’Grady et al. 2023). However, Farmer et al. (2023) found that evolutionary models with very high initial helium fractions can lack Rb. Our synthetic population predicts that a small fraction of TŻOs with high initial helium fractions will form, in particular those with post-terminal age MS or HeMS donors (≈0.5% of our TŻO subpopulation). These TŻOs would likely have a distinct abundance profile, differing from the TŻOs previously considered in the literature (Farmer et al. 2023).
4.8. Collisions following a Supernova
While this scenario is not the main focus of this paper, we note TŻOs have also been predicted to form via collisions following a SN (SN-TŻOs). In this channel, the SN kick propels the newly-formed NS directly into the companion star, which could potentially form a TŻO. We calculated the rate of systems in our synthetic population where one of the stars has experienced a SN resulting in a NS, and the companion is a non-degenerate star, as ℛ ≈ 0.032. We find that ≈1% of these systems have a periastron ≤1 R⊙ directly after the SN explosion and could possibly result in a TŻO candidate from the SN collision scenario; this order-of-magnitude estimate results in a formation rate of  . While this rate is low, these could still become relevant to the TŻO population and are worth consideration.
Leonard et al. (1994) estimated a Galactic formation rate for this channel of 0.25 kpc−2 Myr−1 for TŻOs with an envelope mass over 5 M⊙. Using a Galactic radius of 15 kpc and extrapolating their rate to the Galactic disk gives 2 × 10⁻⁴ yr−1. Our previously computed formation rate of ≈4 × 10⁻⁴ yr−1 is higher than the above extrapolated rate. However, Leonard et al. (1994) only considered dynamically formed TŻOs and noted that including the CE evolution channel could increase the formation rate.
Podsiadlowski et al. (1995) proposed that the SN colliding channel could be of comparable importance to the CE channel, the latter with an estimated rate of ∼10−4 yr−1. Renzo et al. (2019) optimistically estimated that 10−4 TŻOs would form per binary SN events at the time of the SN forming the NS, based on the solid angle seen by the companion. Starting with the rate of binaries where one is a NS and the other is a non-degenerate star, using the formation rate of ∼10−4 per core-collapse events in a binary from Renzo et al. (2019) results in ℛ ≈ 3 × 10⁻⁶ TŻOs formed via collision post-SN in our synthetic population. Translating this into a rate per year (using the previously mentioned SFR), we obtain 10−4 yr−1, the same as Podsiadlowski et al. (1995) estimated for the collision channel and lower than the rate estimated with the CE channel. Additionally, Hirai & Podsiadlowski (2022) studied the scenario in which the NS becomes unbound and then collides with its companion, but concluded that such events were rare enough to not impact previous estimates of the TŻO rate.
5. Summary
In this study, we analyze the Galactic metallicity, CE efficiency parameter at unity synthetic population from Grichener (2023) with a focus on potential progenitors of TŻOs assembled in the field via CE evolution and SN kick-induced mergers. We use this data to explore the potential progenitors of TŻOs assembled in the field, particularly in the context of the CE channel. The TŻO donor progenitors found in this population have an upper mass limit of ≈110 M⊙, which is significantly more massive than existing TŻO models, thus suggesting that TŻOs should be explored at higher mass ranges.
Rates. We find a local TŻO formation rate of ≈4 × 10⁻⁴ yr−1 or  , in agreement with other studies in the literature (e.g., Cannon 1993; Podsiadlowski et al. 1995; Hutilukejiang et al. 2018). We used TŻO lifetimes as calculated in the 1D detailed stellar simulations from Farmer et al. (2023) which are on the order of 104–105 yr. We predicted ≈5 ± 1 TŻOs presently in the Milky Way. We find that our formation rates are overall consistent with those in the literature and that the predicted number of Galactic TŻOs is largely sensitive to the TŻO predicted lifetime.
Rejuvenation. We find that 92% (78%) of TŻO (star + NS) progenitor stellar donors have previously accreted mass during a MT episode and have become rejuvenated. If the lower binding energy of rejuvenated stars results in easier CE ejection, we speculate that many of the TŻO progenitors in our population could actually result in star + NS systems. This would potentially decrease (increase) the formation rate of TŻOs (DCO formations and mergers).
Core disruption and TETŻOs. Using the criterion of Everson et al. (2024), we find that the majority of our TŻO progenitors avoid core disruption. When comparing our results to the TŻO models from Everson et al. (2024), which suggest that excess angular momentum deposited during CE evolution likely prevents the formation of canonical TŻOs in field binaries, we have identified unexplored regions of the parameter space described by our synthetic population. Everson et al. (2024) presented TETŻOs as a hypothetical merger product and X-ray source that may form from failed TŻOs. We estimated the number of TETŻOs in the Milky Way to be 1.5 ± 0.5.
He-rich TŻOs. We report a rare outcome ( ) in which a Helium-rich, stripped progenitor merges with a NS companion; this configuration is generally not accounted for in the literature. These configurations would likely emit a distinct spectral signature and therefore pose an interesting topic that would merit further study.
Kinematics. We compare TŻO progenitors and unbound stars in mass and spatial velocity to find a nearly complete degeneracy for progenitor stars on the MS. However, post-MS and HeMS TŻO progenitor stars are more massive and have lower spatial velocities than their unbound counterparts. We find that TŻO progenitors can be difficult to distinguish from stars which become unbound after the first SN, while also being significantly less common.
SN colliding TŻOs. We briefly explore TŻOs that form when the SN kicks the newly formed NS into the companion star. We located these systems and filtered to choose those with a periastron ≤1 R⊙ directly after the SN explosion to estimate a formation rate of  . We consider that it is possible that these systems collided and merged into TŻOs.
Data publicly available via Zenodo (https://doi.org/10.5281/zenodo.11237180, Grichener 2024).
As the upper limit for the initial period is 1000 au, the population includes many non-interacting binaries that mimic stars that are born and evolve as single stars, see Sect. 2.1.2.
Acknowledgments
We thank Martyna Chruslinska, Selma de Mink, Ryosuke Hirai, Cole Johnston, Stephen Justham, Jing-Ze Ma, Ilya Mandel, Ruggero Valli, and Reinhold Willcox for useful discussions. We thank Richard O’Shaughnessy for his support. We thank the Kavli Foundation and the Max Planck Institute for Astrophysics for supporting the 2023 Kavli Summer Program during which much of this work was completed. KN thanks the LSST-DA Data Science Fellowship Program, which is funded by LSST-DA, the Brinson Foundation, and the Moore Foundation; her participation in the program has benefited this work. AVG acknowledges funding from the Netherlands Organisation for Scientific Research (NWO), as part of the Vidi research program BinWaves (project number 639.042.728, PI: de Mink). AG acknowledges support from the Miriam and Aaron Gutwirth Fellowship and from the Gruber Fellowship funded by the IAU and The Gruber Foundation. RWE acknowledges support from the Heising-Simons Foundation.
References
- Abbott, B. P., Abbott, R., Abbott, T. D., et al. 2017, Phys. Rev. Lett., 119, 161101 [Google Scholar]
- Ablimit, I., Podsiadlowski, P., Hirai, R., & Wicker, J. 2022, MNRAS, 513, 4802 [CrossRef] [Google Scholar]
- Abt, H. A. 1983, ARA&A, 21, 343 [Google Scholar]
- Asplund, M., Grevesse, N., Sauval, A. J., & Scott, P. 2009, ARA&A, 47, 481 [NASA ADS] [CrossRef] [Google Scholar]
- Beasor, E. R., Davies, B., Cabrera-Ziri, I., & Hurst, G. 2018, MNRAS, 479, 3101 [NASA ADS] [CrossRef] [Google Scholar]
- Belczynski, K., Holz, D. E., Bulik, T., & O’Shaughnessy, R. 2016, Nature, 534, 512 [NASA ADS] [CrossRef] [Google Scholar]
- Biehle, G. T. 1991, ApJ, 380, 167 [NASA ADS] [CrossRef] [Google Scholar]
- Biehle, G. T. 1994, ApJ, 420, 364 [NASA ADS] [CrossRef] [Google Scholar]
- Blaauw, A. 1961, Bull. Astr. Inst. Netherlands, 15, 265 [NASA ADS] [Google Scholar]
- Boersma, J. 1961, Bull. Astr. Inst. Netherlands, 15, 291 [NASA ADS] [Google Scholar]
- Broekgaarden, F. S., Berger, E., Neijssel, C. J., et al. 2021, MNRAS, 508, 5028 [NASA ADS] [CrossRef] [Google Scholar]
- Cannon, R. C. 1993, MNRAS, 263, 817 [NASA ADS] [CrossRef] [Google Scholar]
- Cannon, R. C., Eggleton, P. P., Zytkow, A. N., & Podsiadlowski, P. 1992, ApJ, 386, 206 [NASA ADS] [CrossRef] [Google Scholar]
- Chevalier, R. A. 2012, ApJ, 752, L2 [NASA ADS] [CrossRef] [Google Scholar]
- Chiavassa, A., Collet, R., Casagrande, L., & Asplund, M. 2010, A&A, 524, A93 [CrossRef] [EDP Sciences] [Google Scholar]
- Chruslinska, M., Belczynski, K., Klencki, J., & Benacquista, M. 2018, MNRAS, 474, 2937 [CrossRef] [Google Scholar]
- Claeys, J. S. W., de Mink, S. E., Pols, O. R., Eldridge, J. J., & Baes, M. 2011, A&A, 528, A131 [NASA ADS] [CrossRef] [EDP Sciences] [Google Scholar]
- Clopper, C. J., & Pearson, E. S. 1934, Biometrika, 26, 404 [Google Scholar]
- Coe, M. J., & Kirk, J. 2015, MNRAS, 452, 969 [NASA ADS] [CrossRef] [Google Scholar]
- Coe, M. J., & Pightling, S. L. 1998, MNRAS, 299, 223 [NASA ADS] [CrossRef] [Google Scholar]
- DeMarchi, L., Sanders, J. R., & Levesque, E. M. 2021, ApJ, 911, 101 [NASA ADS] [CrossRef] [Google Scholar]
- Dong, D. Z., Hallinan, G., Nakar, E., et al. 2021, Science, 373, 1125 [NASA ADS] [CrossRef] [Google Scholar]
- Eggleton, P. P. 1983, ApJ, 268, 368 [Google Scholar]
- Eich, C., Zimmermann, M. E., Thorne, K. S., & Zytkow, A. N. 1989, ApJ, 346, 277 [NASA ADS] [CrossRef] [Google Scholar]
- Eisner, N. L., Johnston, C., Toonen, S., et al. 2022, MNRAS, 511, 4710 [NASA ADS] [CrossRef] [Google Scholar]
- Eldridge, J. J., Langer, N., & Tout, C. A. 2011, MNRAS, 414, 3501 [NASA ADS] [CrossRef] [Google Scholar]
- Elia, D., Molinari, S., Schisano, E., et al. 2022, ApJ, 941, 162 [NASA ADS] [CrossRef] [Google Scholar]
- Everson, R. W., Hutchinson-Smith, T., Vigna-Gómez, A., & Ramirez-Ruiz, E. 2024, ApJ, 971, 132 [NASA ADS] [CrossRef] [Google Scholar]
- Falanga, M., Bozzo, E., Lutovinov, A., et al. 2015, A&A, 577, A130 [NASA ADS] [CrossRef] [EDP Sciences] [Google Scholar]
- Farmer, R., Renzo, M., de Mink, S. E., Marchant, P., & Justham, S. 2019, ApJ, 887, 53 [Google Scholar]
- Farmer, R., Renzo, M., Götberg, Y., et al. 2023, MNRAS, 524, 1692 [NASA ADS] [CrossRef] [Google Scholar]
- Fryer, C. L., Belczynski, K., Wiktorowicz, G., et al. 2012, ApJ, 749, 91 [Google Scholar]
- Gallegos-Garcia, M., Berry, C. P. L., & Kalogera, V. 2023, ApJ, 955, 133 [NASA ADS] [CrossRef] [Google Scholar]
- Ge, H., Hjellming, M. S., Webbink, R. F., Chen, X., & Han, Z. 2010, ApJ, 717, 724 [NASA ADS] [CrossRef] [Google Scholar]
- Ge, H., Webbink, R. F., Chen, X., & Han, Z. 2020, ApJ, 899, 132 [NASA ADS] [CrossRef] [Google Scholar]
- Ge, H., Tout, C. A., Chen, X., et al. 2024, ApJ, 975, 254 [NASA ADS] [CrossRef] [Google Scholar]
- Goldberg, J. A., Jiang, Y.-F., & Bildsten, L. 2022, ApJ, 929, 156 [NASA ADS] [CrossRef] [Google Scholar]
- Götberg, Y., Korol, V., Lamberts, A., et al. 2020, ApJ, 904, 56 [CrossRef] [Google Scholar]
- Grichener, A. 2023, MNRAS, 523, 221 [NASA ADS] [CrossRef] [Google Scholar]
- Grichener, A. 2024, https://doi.org/10.5281/zenodo.11237180 [Google Scholar]
- Grichener, A., & Soker, N. 2023, MNRAS, 523, 6041 [NASA ADS] [CrossRef] [Google Scholar]
- Hall, P. D., & Tout, C. A. 2014, MNRAS, 444, 3209 [NASA ADS] [CrossRef] [Google Scholar]
- Hellings, P. 1983, Ap&SS, 96, 37 [NASA ADS] [CrossRef] [Google Scholar]
- Hellings, P. 1984, Ap&SS, 104, 83 [NASA ADS] [CrossRef] [Google Scholar]
- Hirai, R., & Podsiadlowski, P. 2022, MNRAS, 517, 4544 [Google Scholar]
- Hjellming, M. S., & Webbink, R. F. 1987, ApJ, 318, 794 [Google Scholar]
- Humphreys, R. M., & Davidson, K. 1994, PASP, 106, 1025 [NASA ADS] [CrossRef] [Google Scholar]
- Hurley, J. R., Pols, O. R., & Tout, C. A. 2000, MNRAS, 315, 543 [Google Scholar]
- Hurley, J. R., Tout, C. A., & Pols, O. R. 2002, MNRAS, 329, 897 [Google Scholar]
- Hutchinson-Smith, T., Everson, R. W., Batta, A., et al. 2023, arXiv e-prints [arXiv:2311.06741] [Google Scholar]
- Hutilukejiang, B., Zhu, C., Wang, Z., & Lü, G. 2018, JApA, 39, 21 [Google Scholar]
- Iben, I., Jr, & Livio, M. 1993, PASP, 105, 1373 [CrossRef] [Google Scholar]
- Ivanova, N., Justham, S., Chen, X., et al. 2013, A&ARv, 21, 59 [Google Scholar]
- Ivanova, N., Justham, S., & Ricker, P. 2020, Common Envelope Evolution (IOP Publishing) [Google Scholar]
- Ivanova, N., Kundu, S., & Pourmand, A. 2024, ApJ, 971, 64 [NASA ADS] [CrossRef] [Google Scholar]
- Jiang, Y.-F. 2023, Galaxies, 11, 105 [NASA ADS] [CrossRef] [Google Scholar]
- Kippenhahn, R., & Meyer-Hofmeister, E. 1977, A&A, 54, 539 [NASA ADS] [Google Scholar]
- Klencki, J., Nelemans, G., Istrate, A. G., & Chruslinska, M. 2021, A&A, 645, A54 [EDP Sciences] [Google Scholar]
- Kobulnicky, H. A., Smullen, R. A., Kiminki, D. C., et al. 2012, ApJ, 756, 50 [NASA ADS] [CrossRef] [Google Scholar]
- Kroupa, P. 2001, MNRAS, 322, 231 [NASA ADS] [CrossRef] [Google Scholar]
- Kruckow, M. U., Tauris, T. M., Langer, N., Kramer, M., & Izzard, R. G. 2018, MNRAS, 481, 1908 [CrossRef] [Google Scholar]
- Landau, L. 1938, Nature, 141, 333 [CrossRef] [Google Scholar]
- Landri, C., Ricker, P. M., Renzo, M., Rau, S., & Vigna-Gómez, A. 2024, A&A, submitted [arXiv:2407.15932] [NASA ADS] [CrossRef] [EDP Sciences] [Google Scholar]
- Langer, N. 2012, ARA&A, 50, 107 [CrossRef] [Google Scholar]
- Langer, N., Norman, C. A., de Koter, A., et al. 2007, A&A, 475, L19 [NASA ADS] [CrossRef] [EDP Sciences] [Google Scholar]
- Laplace, E., Götberg, Y., de Mink, S. E., Justham, S., & Farmer, R. 2020, A&A, 637, A6 [NASA ADS] [CrossRef] [EDP Sciences] [Google Scholar]
- Lau, M. Y. M., Mandel, I., Vigna-Gómez, A., et al. 2020, MNRAS, 492, 3061 [NASA ADS] [CrossRef] [Google Scholar]
- Lau, M. Y. M., Hirai, R., Mandel, I., & Tout, C. A. 2024, ApJ, 966, L7 [NASA ADS] [CrossRef] [Google Scholar]
- Leonard, P. J. T., Hills, J. G., & Dewey, R. J. 1994, ApJ, 423, L19 [NASA ADS] [CrossRef] [Google Scholar]
- Levesque, E. M., Massey, P., Zytkow, A. N., & Morrell, N. 2014, MNRAS, 443, L94 [NASA ADS] [CrossRef] [Google Scholar]
- Livio, M., & Soker, N. 1988, ApJ, 329, 764 [Google Scholar]
- Maccarone, T. J., & de Mink, S. E. 2016, MNRAS, 458, L1 [NASA ADS] [CrossRef] [Google Scholar]
- Metzger, B. D. 2022, ApJ, 932, 84 [NASA ADS] [CrossRef] [Google Scholar]
- Meurs, E. J. A., & van den Heuvel, E. P. J. 1989, A&A, 226, 88 [NASA ADS] [Google Scholar]
- Neo, S., Miyaji, S., Nomoto, K., & Sugimoto, D. 1977, PASJ, 29, 249 [NASA ADS] [Google Scholar]
- Offner, S. S. R., Moe, M., Kratter, K. M., et al. 2023, ASP Conf. Ser., 534, 275 [NASA ADS] [Google Scholar]
- O’Grady, A. J. G., Drout, M. R., Shappee, B. J., et al. 2020, ApJ, 901, 135 [CrossRef] [Google Scholar]
- O’Grady, A. J. G., Drout, M. R., Gaensler, B. M., et al. 2023, ApJ, 943, 18 [CrossRef] [Google Scholar]
- O’Grady, A. J. G., Moriya, T. J., Renzo, M., & Vigna-Gómez, A. 2024, arXiv e-prints [arXiv:2410.02896] [Google Scholar]
- Oppenheimer, J. R., & Volkoff, G. M. 1939, Phys. Rev., 55, 374 [NASA ADS] [CrossRef] [Google Scholar]
- Özel, F., Psaltis, D., Narayan, R., & McClintock, J. E. 2010, ApJ, 725, 1918 [CrossRef] [Google Scholar]
- Paczynski, B. 1976, IAU Symp., 73, 75 [NASA ADS] [Google Scholar]
- Pavlovskii, K., & Ivanova, N. 2015, MNRAS, 449, 4415 [Google Scholar]
- Peters, P. C. 1964, Phys. Rev., 136, 1224 [Google Scholar]
- Picker, L., Hirai, R., & Mandel, I. 2024, ApJ, 969, 1 [NASA ADS] [CrossRef] [Google Scholar]
- Podsiadlowski, P., Cannon, R. C., & Rees, M. J. 1995, MNRAS, 274, 485 [NASA ADS] [CrossRef] [Google Scholar]
- Pols, O. R., Schröder, K.-P., Hurley, J. R., Tout, C. A., & Eggleton, P. P. 1998, MNRAS, 298, 525 [Google Scholar]
- Ray, A., Kembhavi, A. K., & Antia, H. M. 1987, A&A, 184, 164 [NASA ADS] [Google Scholar]
- Renzo, M., Zapartas, E., de Mink, S. E., et al. 2019, A&A, 624, A66 [NASA ADS] [CrossRef] [EDP Sciences] [Google Scholar]
- Renzo, M., Zapartas, E., Justham, S., et al. 2023, ApJ, 942, L32 [NASA ADS] [CrossRef] [Google Scholar]
- Romagnolo, A., Klencki, J., Vigna-Gómez, A., & Belczynski, K. 2025, A&A, 693, A137 [NASA ADS] [CrossRef] [EDP Sciences] [Google Scholar]
- Röpke, F. K., & De Marco, O. 2023, Liv. Rev. Comput. Astrophys., 9, 2 [CrossRef] [Google Scholar]
- Sana, H., de Mink, S. E., de Koter, A., et al. 2012, Science, 337, 444 [Google Scholar]
- Siegel, J. C., Kiato, I., Kalogera, V., et al. 2023, ApJ, 954, 212 [NASA ADS] [CrossRef] [Google Scholar]
- Soberman, G. E., Phinney, E. S., & van den Heuvel, E. P. J. 1997, A&A, 327, 620 [NASA ADS] [Google Scholar]
- Soker, N. 2022, Res. Astron. Astrophys., 22, 055010 [CrossRef] [Google Scholar]
- Soker, N., & Gilkis, A. 2018, MNRAS, 475, 1198 [NASA ADS] [CrossRef] [Google Scholar]
- Soker, N., Grichener, A., & Gilkis, A. 2019, MNRAS, 484, 4972 [NASA ADS] [CrossRef] [Google Scholar]
- Stevenson, S., Vigna-Gómez, A., Mandel, I., et al. 2017, Nat. Commun., 8, 14906 [Google Scholar]
- Taam, R. E., Bodenheimer, P., & Ostriker, J. P. 1978, ApJ, 222, 269 [NASA ADS] [CrossRef] [Google Scholar]
- Tabernero, H. M., Dorda, R., Negueruela, I., & Marfil, E. 2021, A&A, 646, A98 [EDP Sciences] [Google Scholar]
- Tauris, T. M., Kramer, M., Freire, P. C. C., et al. 2017, ApJ, 846, 170 [Google Scholar]
- Team-COMPAS, Riley, J., Agrawal, P., et al. 2022, J. Open Source Softw., 7, 3838 [NASA ADS] [CrossRef] [Google Scholar]
- Temmink, K. D., Pols, O. R., Justham, S., Istrate, A. G., & Toonen, S. 2023, A&A, 669, A45 [NASA ADS] [CrossRef] [EDP Sciences] [Google Scholar]
- Terman, J. L., Taam, R. E., & Hernquist, L. 1995, ApJ, 445, 367 [NASA ADS] [CrossRef] [Google Scholar]
- Thorne, K. S., & Zytkow, A. N. 1975, ApJ, 199, L19 [NASA ADS] [CrossRef] [Google Scholar]
- Thorne, K. S., & Zytkow, A. N. 1977, ApJ, 212, 832 [Google Scholar]
- Tout, C. A., Zytkow, A. N., Church, R. P., et al. 2014, MNRAS, 445, L36 [NASA ADS] [CrossRef] [Google Scholar]
- Valli, R., Tiede, C., Vigna-Gómez, A., et al. 2024, A&A, 688, A128 [NASA ADS] [CrossRef] [EDP Sciences] [Google Scholar]
- van der Meij, V., Guo, D., Kaper, L., & Renzo, M. 2021, A&A, 655, A31 [NASA ADS] [CrossRef] [EDP Sciences] [Google Scholar]
- Vanture, A. D., Zucker, D., & Wallerstein, G. 1999, ApJ, 514, 932 [NASA ADS] [CrossRef] [Google Scholar]
- Vigna-Gómez, A., & Rebagliato, T. 2020, https://doi.org/10.5281/zenodo.3634498 [Google Scholar]
- Vigna-Gómez, A., Neijssel, C. J., Stevenson, S., et al. 2018, MNRAS, 481, 4009 [Google Scholar]
- Vigna-Gómez, A., MacLeod, M., Neijssel, C. J., et al. 2020, PASA, 37, e038 [Google Scholar]
- Vigna-Gómez, A., Wassink, M., Klencki, J., et al. 2022, MNRAS, 511, 2326 [CrossRef] [Google Scholar]
- Vinciguerra, S., Neijssel, C. J., Vigna-Gómez, A., et al. 2020, MNRAS, 498, 4705 [NASA ADS] [CrossRef] [Google Scholar]
- Wagg, T., Broekgaarden, F. S., de Mink, S. E., et al. 2022, ApJ, 937, 118 [NASA ADS] [CrossRef] [Google Scholar]
- Wagg, T., Johnston, C., Bellinger, E. P., et al. 2024, A&A, 687, A222 [NASA ADS] [CrossRef] [EDP Sciences] [Google Scholar]
- Webbink, R. F. 1984, ApJ, 277, 355 [NASA ADS] [CrossRef] [Google Scholar]
- Wei, D., Schneider, F. R. N., Podsiadlowski, P., et al. 2024, A&A, 688, A87 [NASA ADS] [CrossRef] [EDP Sciences] [Google Scholar]
- Willcox, R., MacLeod, M., Mandel, I., & Hirai, R. 2023, ApJ, 958, 138 [NASA ADS] [CrossRef] [Google Scholar]
- Xin, C., Renzo, M., & Metzger, B. D. 2022, MNRAS, 516, 5816 [NASA ADS] [CrossRef] [Google Scholar]
- Xu, X.-J., & Li, X.-D. 2010a, ApJ, 716, 114 [Google Scholar]
- Xu, X.-J., & Li, X.-D. 2010b, ApJ, 722, 1985 [NASA ADS] [CrossRef] [Google Scholar]
- Zapartas, E., de Mink, S. E., Izzard, R. G., et al. 2017, A&A, 601, A29 [NASA ADS] [CrossRef] [EDP Sciences] [Google Scholar]
- Zhang, L., Ge, H., Chen, X., & Han, Z. 2024, ApJS, 274, 11 [NASA ADS] [CrossRef] [Google Scholar]
- Zhu, J.-P., Qin, Y., Wang, Z.-H.-T., et al. 2024, MNRAS, 529, 4554 [NASA ADS] [CrossRef] [Google Scholar]
All Figures
|
Fig. 1. Schematic showing the CE formation channel for TŻOs, based on Fig. 1 of Vigna-Gómez et al. (2020), Vigna-Gómez & Rebagliato (2020). The chronology and the nomenclature is the following. 1. Zero-age main sequence (ZAMS); 2. Roche lobe overflow (RLOF); 3. Post-RLOF, or envelope detachment; 4. Supernova (SN) of the primary; 5. Neutron star (NS) forms from the SN explosion; 6. Common envelope evolution (CE evolution); 7. Post-CE evolution, which can lead to either the ejection of the envelope, forming a stripped star + NS, or the formation of a TŻO from the merger of the NS and the stellar core; 8. RLOF of the stripped binary, further stripping the companion star; 9. Ultra-stripped SN of the companion star; and 10. NS binary. The solid arrow from step 6 indicates the CE formation channel for TŻOs and the dashed arrow from step 8 shows the alternative channel to a TŻO with a HeMS donor star. |
| In the text | |
|
Fig. 2. Summary of the event rates in our synthetic population at Solar metallicity (Z = 0.0142, Asplund et al. 2009). We quantify the rate of binaries that experience the following (from left to right): mass transfer (MT), common envelope (CE) events (a subset of previous, can only lead to ejections or mergers), CE ejections, and mergers. For each column, the outline (black) indicates all binaries in the population that go through the event, the bar (light blue) indicates binaries with a NS, and hatching indicates companions to the NS rejuvenated by previous stable MT. The y-axis is in logarithmic scale and it shows the number of systems of interest (N) normalised by the number of SNe (NSNe, see Sect. 2.1.2 for more details). |
| In the text | |
|
Fig. 3. Summary of the double compact object (DCO) rates in our synthetic population at Solar metallicity (Z = 0.0142). We quantify the rates of DCOs (from left to right): NS-NS binaries, BH-BH binaries, and NS-BH binaries. For each column, the upper portion (light pink) indicates non-merging DCOs, the lower column (dark pink) indicates DCOs that merge in a Hubble time, and the hatching indicates DCOs that had a rejuvenated companion before both SNe. The y-axis is scaled as in Fig. 2. |
| In the text | |
|
Fig. 4. HRD showing the progenitors of TŻO candidates (light blue) and star + NS systems (dark blue) at Solar metallicity (Z = 0.0142). These progenitors are shown at the onset of RLOF leading to a CE event. Two representative single star tracks (Hurley et al. 2000) for 5–20 M⊙ are shown as solid lines (gray). ZAMS and the terminal-age main sequence (TAMS) are shown as dotted lines (black). The Humphreys-Davidson limit (Humphreys & Davidson 1994) is shown as a dotted line (gray). Above and to the right: Histograms showing the rate density of TŻO and star + NS progenitors in their respective colors. The outline (pink) indicates the subset of systems with a rejuvenated companion. The y-axes of the histograms are scaled by the number of observable SNe in the synthetic population (see Sect. 2.1.2 for more details). |
| In the text | |
|
Fig. 5. Mass of the secondary plotted against the center-of-mass speed for TŻO progenitors (light blue) and unbound stars (green) on the MS (top), post-MS (middle), and HeMS (bottom). The contours enclose 90% of the systems. Above and to the right of the main panel are histograms showing the density, normalized so that each integrates to unity. |
| In the text | |
|
Fig. 6. HRD showing an alternative outcome of the CE phase (cf. Fig. 4). We analyze our synthetic population in the context of the evolutionary models from Everson et al. (2024). We assess the outcome of the CE evolution based on the criteria described by Everson et al. (2024) and show systems predicted to have an intact core (light blue), disrupted core (purple), and those that eject the CE (dark blue). The data from Everson et al. (2024) are overplotted as the same symbols with black outlines. We show a 30 R⊙ isoradial line, the cutoff for TETŻO formation, as a solid line (gray). The y-axes of the histograms are scaled by the number of observable SNe in the synthetic population (see Sect. 2.1.2 for more details). |
| In the text | |
Current usage metrics show cumulative count of Article Views (full-text article views including HTML views, PDF and ePub downloads, according to the available data) and Abstracts Views on Vision4Press platform.
Data correspond to usage on the plateform after 2015. The current usage metrics is available 48-96 hours after online publication and is updated daily on week days.
Initial download of the metrics may take a while.