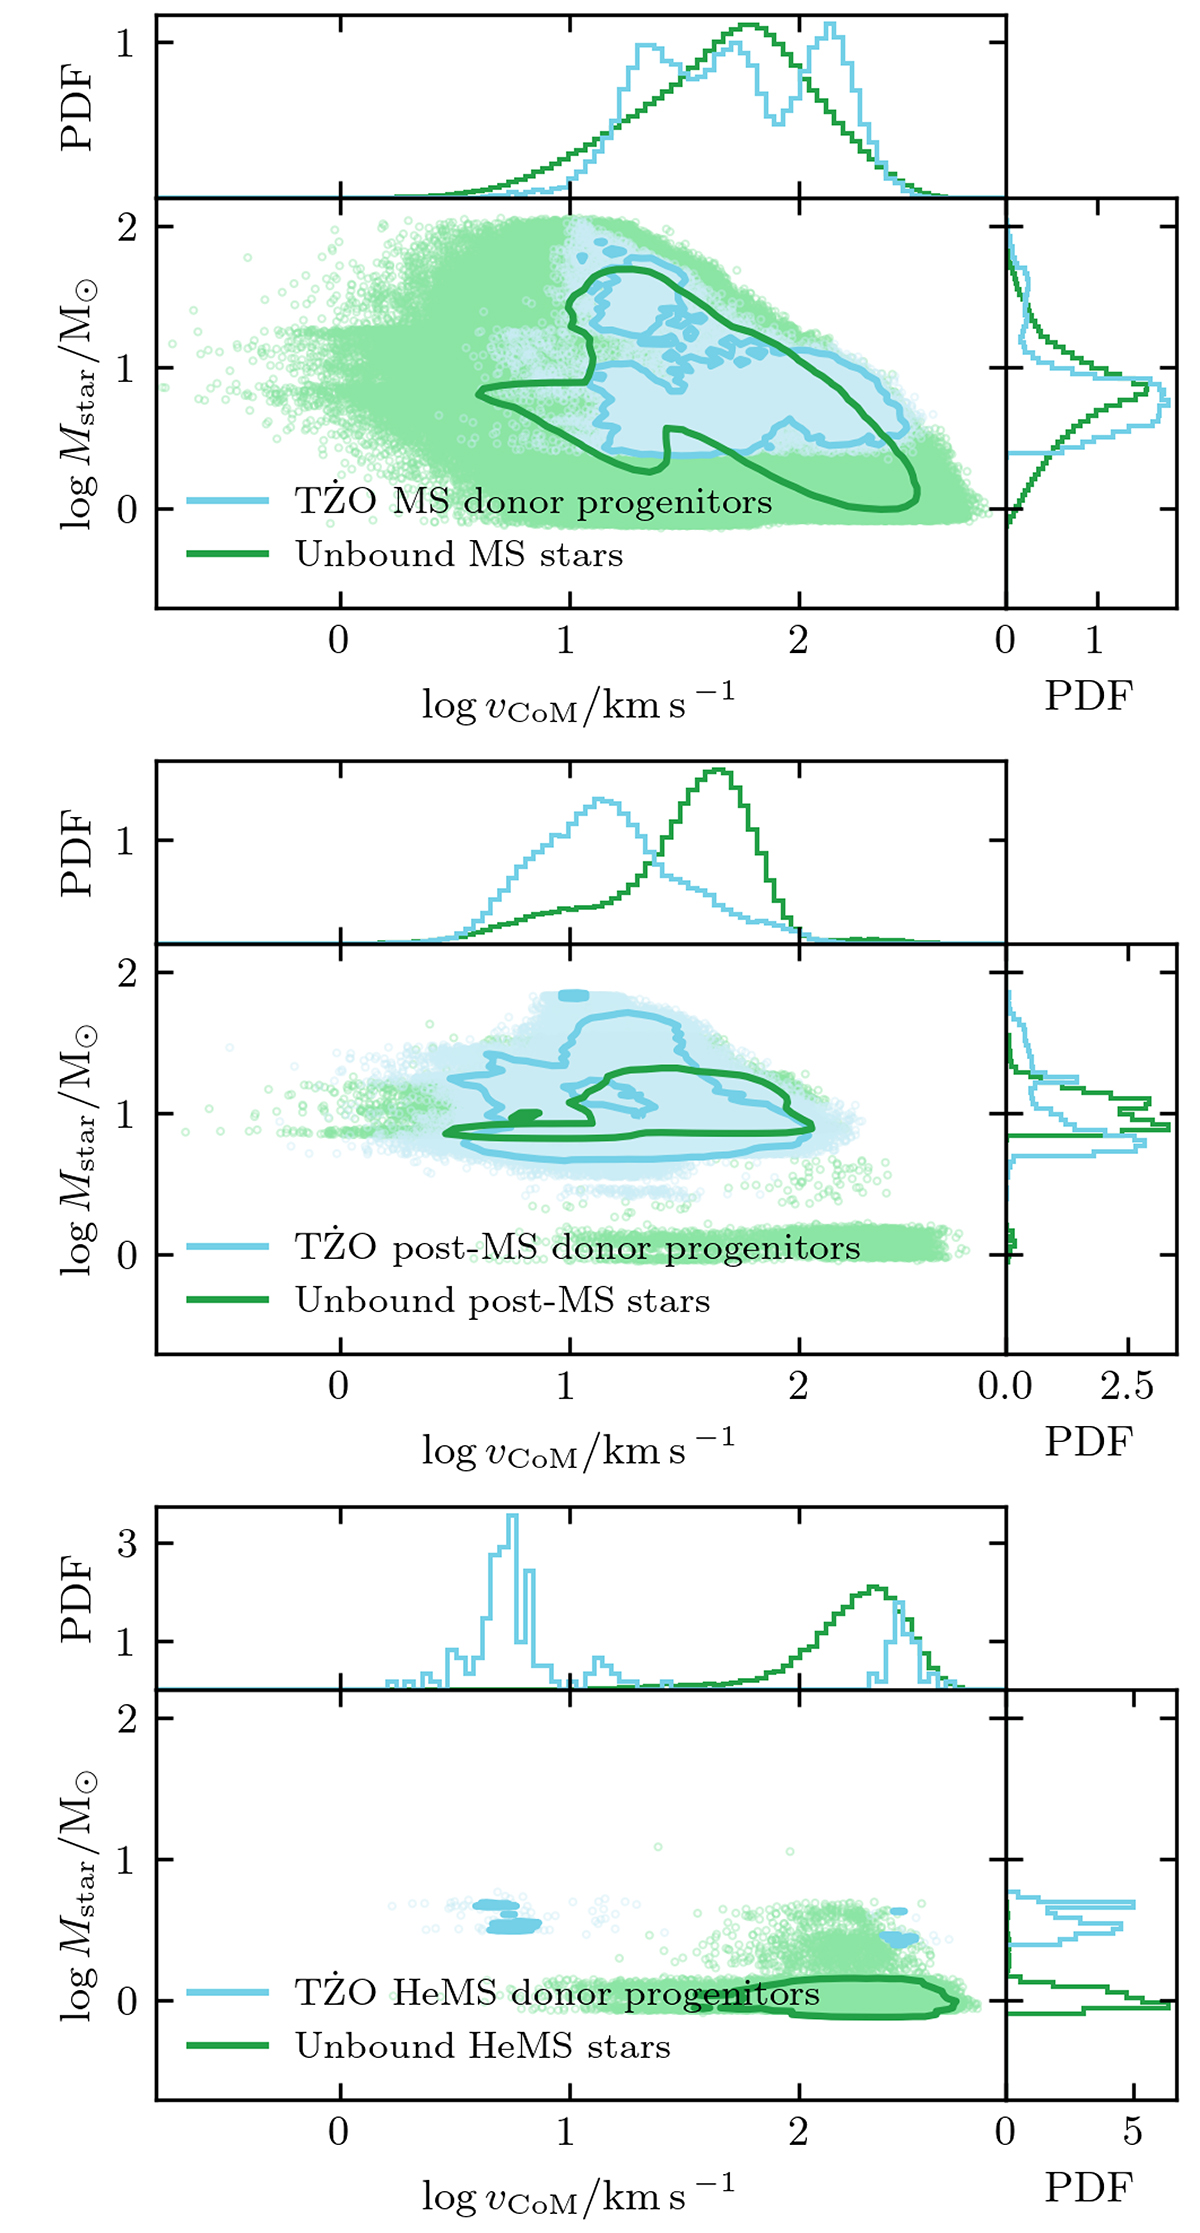
Fig. 5.
Download original image
Mass of the secondary plotted against the center-of-mass speed for TŻO progenitors (light blue) and unbound stars (green) on the MS (top), post-MS (middle), and HeMS (bottom). The contours enclose 90% of the systems. Above and to the right of the main panel are histograms showing the density, normalized so that each integrates to unity.
Current usage metrics show cumulative count of Article Views (full-text article views including HTML views, PDF and ePub downloads, according to the available data) and Abstracts Views on Vision4Press platform.
Data correspond to usage on the plateform after 2015. The current usage metrics is available 48-96 hours after online publication and is updated daily on week days.
Initial download of the metrics may take a while.