Fig. 4.
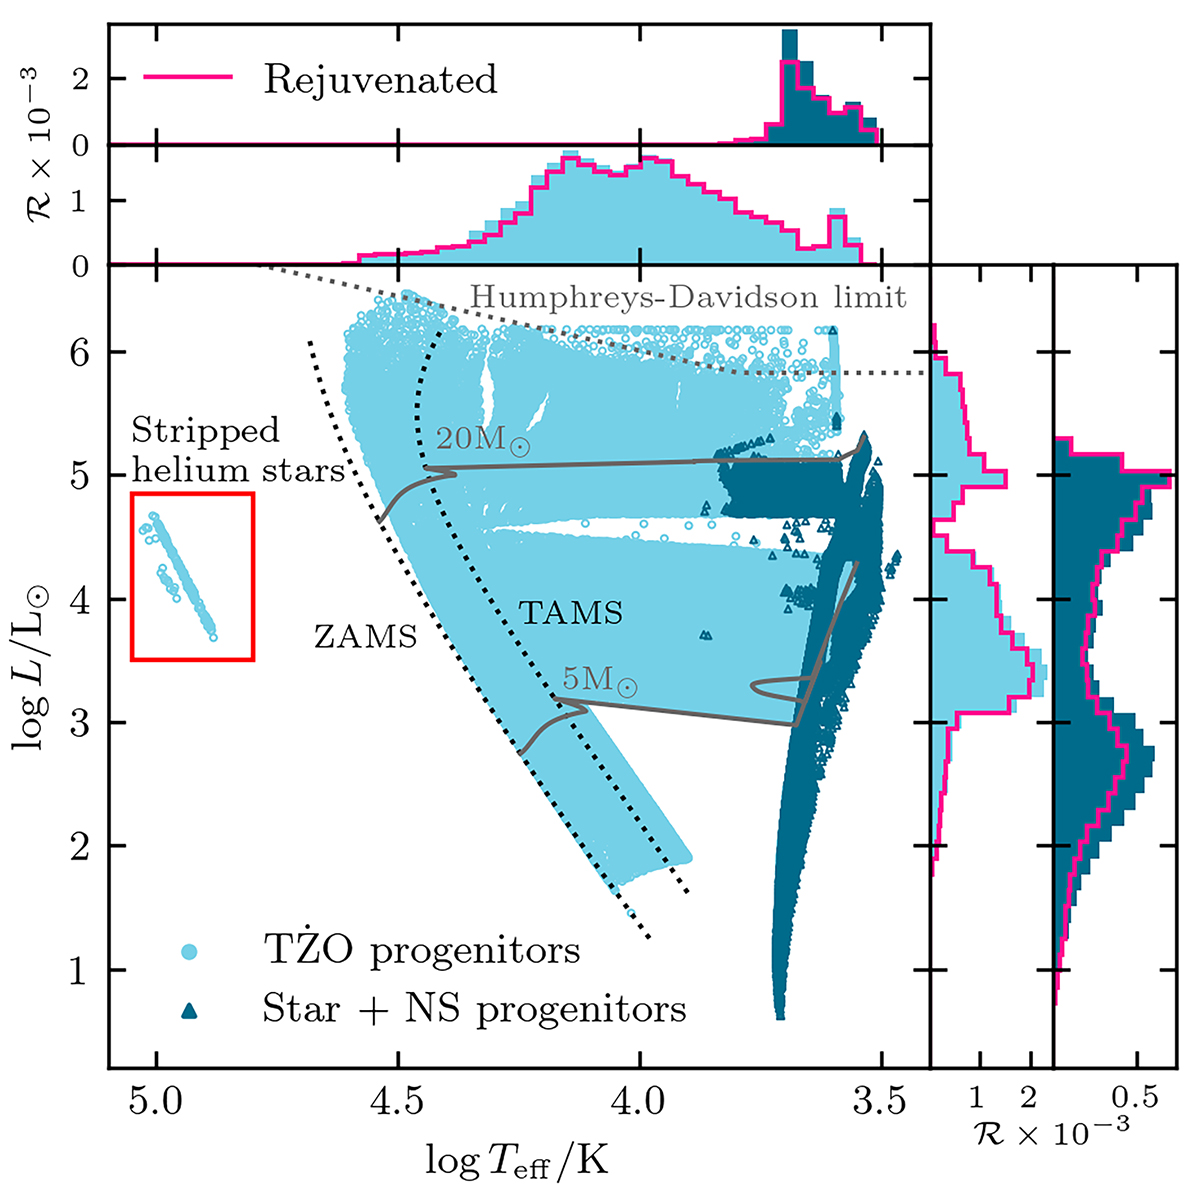
Download original image
HRD showing the progenitors of TŻO candidates (light blue) and star + NS systems (dark blue) at Solar metallicity (Z = 0.0142). These progenitors are shown at the onset of RLOF leading to a CE event. Two representative single star tracks (Hurley et al. 2000) for 5–20 M⊙ are shown as solid lines (gray). ZAMS and the terminal-age main sequence (TAMS) are shown as dotted lines (black). The Humphreys-Davidson limit (Humphreys & Davidson 1994) is shown as a dotted line (gray). Above and to the right: Histograms showing the rate density of TŻO and star + NS progenitors in their respective colors. The outline (pink) indicates the subset of systems with a rejuvenated companion. The y-axes of the histograms are scaled by the number of observable SNe in the synthetic population (see Sect. 2.1.2 for more details).
Current usage metrics show cumulative count of Article Views (full-text article views including HTML views, PDF and ePub downloads, according to the available data) and Abstracts Views on Vision4Press platform.
Data correspond to usage on the plateform after 2015. The current usage metrics is available 48-96 hours after online publication and is updated daily on week days.
Initial download of the metrics may take a while.