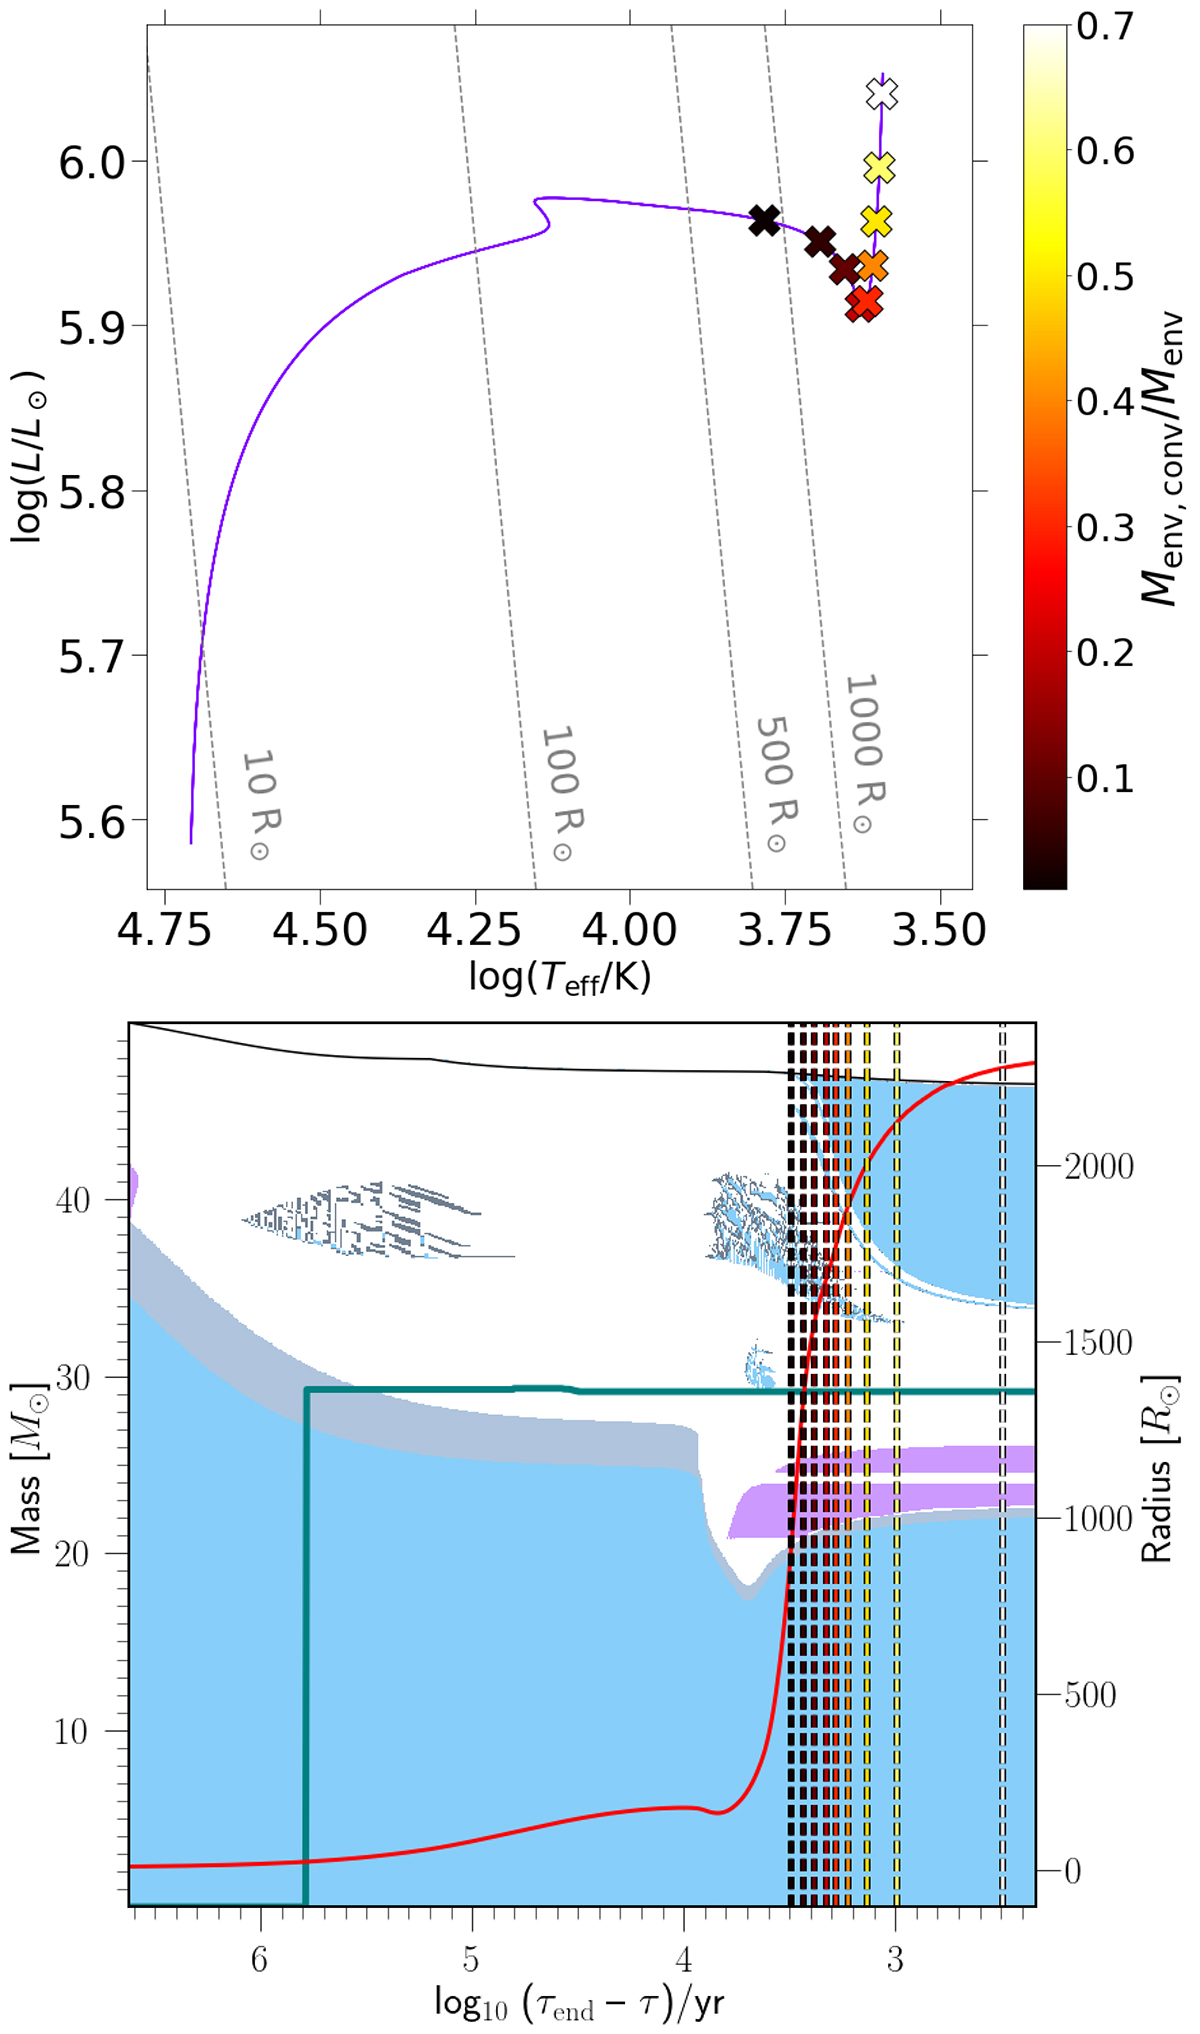
Fig. A.1.
Download original image
Evolution of a MZAMS = 50 M⊙ star at 0.1 Z⊙ from M_αML1.82_MLTpp until ∼ 70% of its envelope mass becomes convective. Top panel: HR diagram. We show the HR position of the star when Menv, conv is 1, 5, 10, 20, 30, 40, 50, 60 and 70% of Menv. Bottom panel: Kippenhahn diagram, with radial evolution represented by the red line. In cyan, purple and gray respectively the convective, semiconvection and overshooting regions, while the green line represent the post-MS core-envelope boundary. The dashed vertical lines have the same colors of the scatter points in the left panel and represent the evolutionary stage at which the star reaches its respective Menv, conv/Menv ratio.
Current usage metrics show cumulative count of Article Views (full-text article views including HTML views, PDF and ePub downloads, according to the available data) and Abstracts Views on Vision4Press platform.
Data correspond to usage on the plateform after 2015. The current usage metrics is available 48-96 hours after online publication and is updated daily on week days.
Initial download of the metrics may take a while.