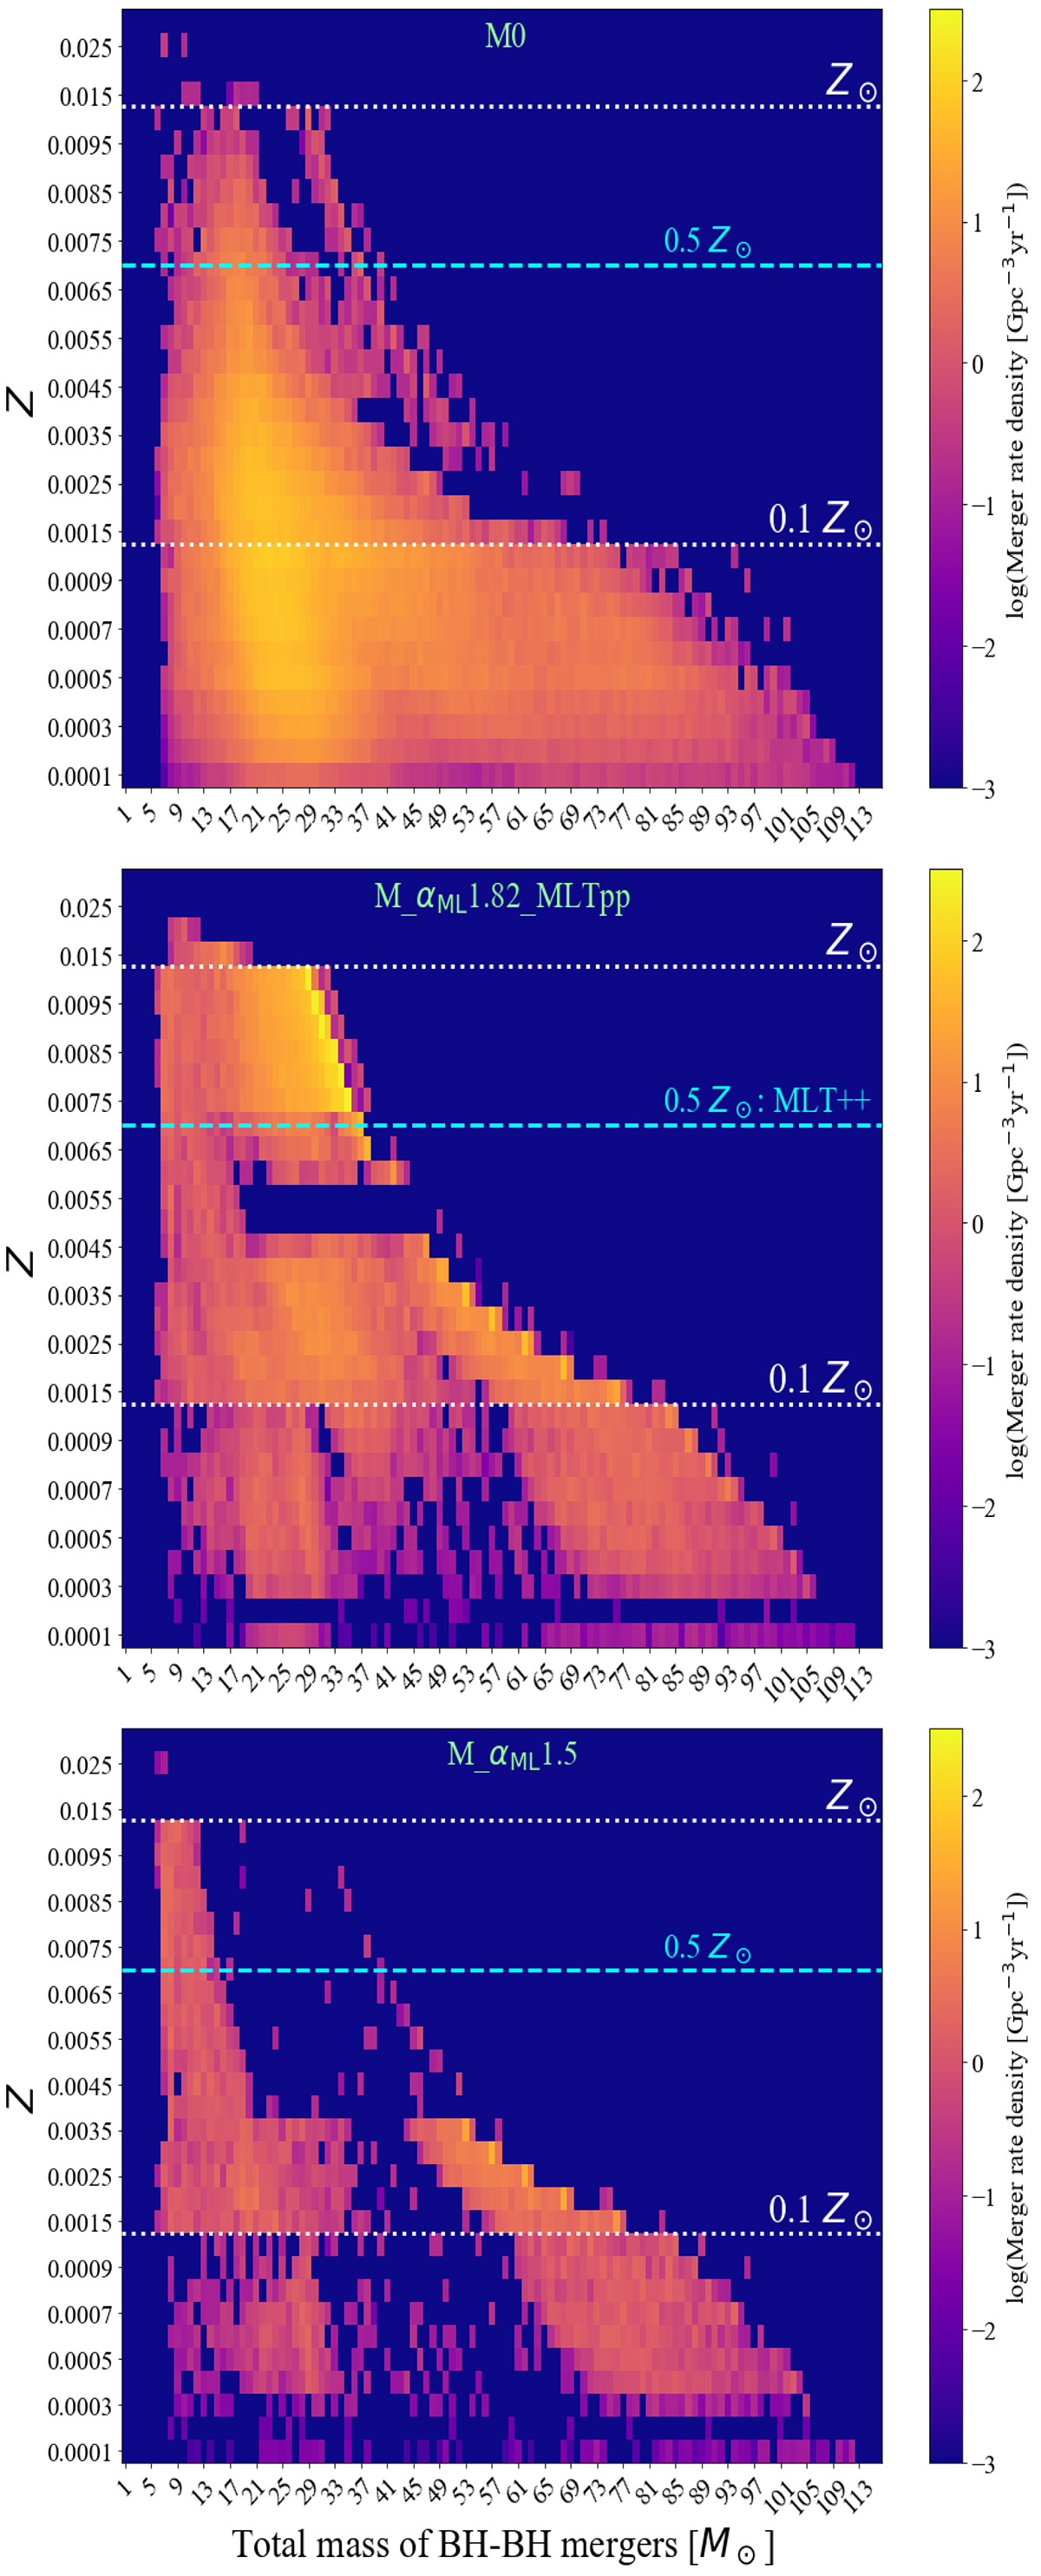
Fig. 6.
Download original image
BH-BH total mass distribution within redshift 2 as a function of metallicity for M0 (top), M_αML1.82_MLTpp (middle), and M_αML1.5 (bottom). The dashed cyan line represents the metallicity threshold beyond which the formation of a convective envelope is estimated from the MESA tracks using MLT++ for M_αML1.82_MLTpp (see details in Sect. 3.6).
Current usage metrics show cumulative count of Article Views (full-text article views including HTML views, PDF and ePub downloads, according to the available data) and Abstracts Views on Vision4Press platform.
Data correspond to usage on the plateform after 2015. The current usage metrics is available 48-96 hours after online publication and is updated daily on week days.
Initial download of the metrics may take a while.