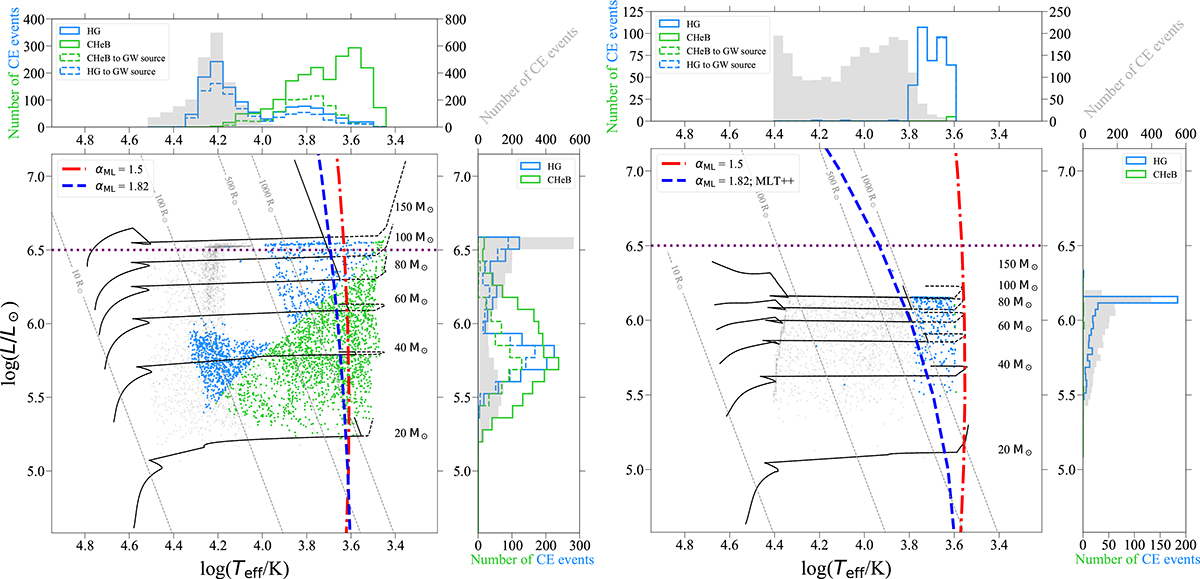
Fig. 2.
Download original image
HR diagram position of the donor stars at the onset of a CE event with a BH accretor at Z = 0.1 Z⊙ (left) and Z⊙ (right), with six evolutionary tracks for single stars at MZAMS = 20, 40, 60, 80, 100, and 150 M⊙ for M0 (black dashed line) and M0RMAX (black solid line). The gray dots represent the CE events with a BH companion that lead to a stellar merger and the potential formation of a QS, while the blue and green dots represent respectively HG and CHeB stars (i.e., evolutionary types in StarTrack, following Hurley et al. 2000) in binaries that successfully expel the CE and become BH-BH. The red and blue lines represent the threshold for respectively M_αML1.5 and M_αML1.82_MLTpp, where a star becomes cold enough to develop a convective envelope. The horizontal purple dotted line represents the luminosity threshold beyond which we extrapolate the convective boundary tracks. We plot the distributions of log Teff and log L values of donors that have led to the CE mergers (in gray) or to CE ejections and the formation of BH-BH systems (in green or blue, depending on the donor evolutionary type in StarTrack). In the right panel there is a near-complete overlap between the BH-BH progenitor binaries and the ones that become GW sources. The dashed-line histograms correspond only to BH-BH systems that merge within a Hubble time.
Current usage metrics show cumulative count of Article Views (full-text article views including HTML views, PDF and ePub downloads, according to the available data) and Abstracts Views on Vision4Press platform.
Data correspond to usage on the plateform after 2015. The current usage metrics is available 48-96 hours after online publication and is updated daily on week days.
Initial download of the metrics may take a while.