| Issue |
A&A
Volume 691, November 2024
|
|
|---|---|---|
| Article Number | A191 | |
| Number of page(s) | 12 | |
| Section | Extragalactic astronomy | |
| DOI | https://doi.org/10.1051/0004-6361/202348982 | |
| Published online | 13 November 2024 | |
Ubiquitous radio emission in quasars: Predominant AGN origin and a connection to jets, dust, and winds
1
European Southern Observatory (ESO), Karl-Schwarzschild-Straße 2, 85748 Garching bei München, Germany
2
German Aerospace Center (DLR), Institute of Communications and Navigation, Wessling, Germany
3
Centre for Extragalactic Astronomy, Department of Physics, Durham University, Durham DH1 3LE, UK
4
School of Mathematics, Statistics and Physics, Newcastle University, Newcastle upon Tyne NE1 7RU, UK
5
Institute for Astronomy, University of Edinburgh, Royal Observatory, Blackford Hill, Edinburgh EH9 3HJ, UK
6
Centre for Astrophysics Research, University of Hertfordshire, College Lane, Hatfield AL10 9AB, UK
7
Leiden Observatory, Leiden University, PO Box 9513 2300 RA Leiden, The Netherlands
8
INAF – Istituto di Radioastronomia, Via P. Gobetti 101, 40129 Bologna, Italy
9
SKA Observatory, Jodrell Bank, Lower Withington, Macclesfield SK11 9FT, UK
10
CSIRO Space and Astronomy, ATNF, PO Box 1130 Bentley, WA 6102, Australia
11
Institute for Computational Cosmology, Department of Physics, University of Durham, South Road, Durham DH1 3LE, UK
⋆ Corresponding author; This email address is being protected from spambots. You need JavaScript enabled to view it.
Received:
17
December
2023
Accepted:
26
August
2024
Abstract
We present a comprehensive study of the physical origin of radio emission in optical quasars at redshifts z < 2.5. We focus particularly on the associations between compact radio emission, dust reddening, and outflows identified in our earlier work. Leveraging the deepest low-frequency radio data available to date (LoTSS Deep DR1), we achieve radio detection fractions of up to 94%, demonstrating the virtual ubiquity of radio emission in quasars, and a continuous distribution in radio loudness. Through our analysis of radio properties, combined with spectral energy distribution modelling of deep multiwavelength photometry, we establish that the primary source of radio emission in quasars is the active galactic nucleus (AGN), rather than star formation. Modelling the dust reddening of the accretion disc emission shows a continuous increase in radio detection in quasars as a function of the reddening parameter E(B − V), suggesting a causal link between radio emission and dust reddening. Confirming previous findings, we observe that the radio excess in red quasars is most pronounced for sources with compact radio morphologies and intermediate radio loudness. We find a significant increase in [O III] and C IV outflow velocities for red quasars not seen in our control sample, with particularly powerful [O III] winds in those around the threshold from radio-quiet to radio-loud. Based on the combined characterisation of radio, reddening, and outflow properties in our sample, we favour a model in which the compact radio emission observed in quasars originates in compact radio jets and their interaction with a dusty, circumnuclear environment. In particular, our results align with the theory that jet-induced winds and shocks resulting from this interaction are the origin of the enhanced radio emission in red quasars. Further investigation of this model is crucial for advancing our understanding of quasar feedback mechanisms and their role in galaxy evolution.
Key words: galaxies: active / galaxies: evolution / galaxies: jets / quasars: emission lines / quasars: general / quasars: supermassive black holes
© The Authors 2024
 Open Access article, published by EDP Sciences, under the terms of the Creative Commons Attribution License (https://creativecommons.org/licenses/by/4.0), which permits unrestricted use, distribution, and reproduction in any medium, provided the original work is properly cited.
This article is published in open access under the Subscribe to Open model. This email address is being protected from spambots. You need JavaScript enabled to view it. to support open access publication.
1. Introduction
Quasars, also known as quasi-stellar objects (QSOs), were first discovered as bright radio sources with luminous star-like compact optical counterparts. Through optical follow-up spectroscopy (Schmidt 1963) they were then identified to be extragalactic objects, powered by accreting supermassive black holes (SMBHs). The powerful radio emission that initially characterized their discovery was later attributed to the presence of radio jets and lobes, which can extend to impressive lengths of up to 7 Mpc according to recent observations (Oei et al. 2024). However, despite their initial characterisation as radio sources, it soon became evident that the large majority (∼90%) of QSOs did not show radio detections at the sensitivities of the telescopes at the time (e.g. Sandage 1965). With new-generation radio interferometers of high sensitivity and large sky coverage (Norris et al. 2013), such as the LOw-Frequency Array (LOFAR; van Haarlem et al. 2013), we are now able to investigate the radio properties of the QSO population to the lowest radio luminosities at low radio frequencies (e.g. Gürkan et al. 2019; Macfarlane et al. 2021; Arnaudova et al. 2024; Yue et al. 2024).
Despite these advancements, the origin of the faint radio emission in QSOs remains strongly debated in the community (Bonzini et al. 2015; Padovani 2016; Panessa et al. 2019; Chen et al. 2023). When large-scale jets are not present, the question of the nature of the radio emission in QSOs is challenging since complementary multiwavelength and multi-scale information is required to determine the primary physical origin amid various processes that can give rise to radio emission. On the one hand, synchrotron emission can originate in star forming regions through the interaction of the high-energy electron plasma from supernova events with magnetic fields, and therefore can be directly linked to massive star formation at galactic scales (e.g. Helou et al. 1985; Bell 2003). On the other hand, the radio emission in QSOs can be of AGN origin, and connected to the black hole accretion responsible for the energetic optical radiation that defines QSOs. Here, physical mechanisms that could produce the synchrotron radio emission are low-power, small-scale versions of the kpc-scale jets observed in traditionally ‘radio-loud’ quasars (e.g. Jarvis et al. 2019; Hartley et al. 2019), shocked electrons produced by the interactions of the interstellar medium (ISM) with jets and/or powerful winds (e.g. Zakamska & Greene 2014; Nims et al. 2015; Hwang et al. 2018), and hot electrons from the X-ray-emitting corona (e.g. Laor & Behar 2008; Baldi et al. 2021; Chen et al. 2023). The identification of the main mechanism(s) responsible for the radio emission is key to characterising the mechanical energy and momentum released as a function of the SMBHs properties. This is in turn essential in order to constrain the overall impact of accreting SMBHs on their host galaxies (black hole/AGN feedback, e.g. Croton et al. 2006; Fabian 2012; Harrison et al. 2018) and is therefore a potential avenue to observationally characterise feedback mechanisms in galaxy evolution.
Traditionally, obscuration in AGN has been ascribed to the dusty structure around the accretion disc known as the torus, and to its orientation with respect to the line of sight (Antonucci 1993). Recently, this picture is evolving, as increasing evidence suggests that the evolutionary stage of the AGN is also an important factor for obscuration (e.g. Hopkins et al. 2004; Alexander & Hickox 2012; Ricci et al. 2017). In particular, fundamental differences have been seen in the radio emission between optical reddened QSOs and the bulk of the QSO population with average blue colours (Klindt et al. 2019; Fawcett et al. 2020, 2021, 2023; Rosario et al. 2020, 2021; Glikman et al. 2022). This finding appears in tension with models that ascribe obscuration exclusively to orientation of the dusty torus. Instead, it may be consistent with the notion that some QSOs are obscured by polar dust, potentially distributed within winds (e.g. Stalevski et al. 2019; Hönig & Kishimoto 2017) and/or galaxy-scale material linked to different evolutionary phases (e.g. Circosta et al. 2019; Andonie et al. 2024). Indeed, recent studies suggest that there is a close connection between QSO reddening and increased level of outflows (Zakamska et al. 2016; Hamann et al. 2017; Bischetti et al. 2017; DiPompeo et al. 2018; Mehdipour & Costantini 2018; Perrotta et al. 2019; Temple et al. 2019; Villar Martín et al. 2020; Rojas et al. 2020; Calistro Rivera et al. 2021; Stacey et al. 2022), where the dust responsible for the red colour in QSOs could potentially reside in circumnuclear dusty winds (Calistro Rivera et al. 2021). Similarly, studies have also focused on the connection between the radio emission and outflow properties in QSOs (e.g. Jarvis et al. 2021; Girdhar et al. 2022; Baldi et al. 2021), finding a positive correlation (e.g. Mullaney et al. 2013; Wang et al. 2022; Petley et al. 2024; Escott et al., in prep.), in particular for compact and GHz-peaked, potentially younger, radio sources (Molyneux et al. 2019; Kukreti et al. 2023).
While most of these studies have individually explored the connection between radio emission and either reddening or outflows, drawing comprehensive conclusions has proven challenging due to the heterogeneity of data sets, and sometimes limited sample sizes and multiwavelength coverage. In this paper we leverage the deepest radio data to date from the LOFAR telescope (LoTSS Deep DR1; Tasse et al. 2021; Sabater et al. 2021), in combination with a comprehensive multiwavelength characterisation, to investigate the physical origin of the radio emission in QSOs. Crucially, using a single consistent sample, we investigate the connection between the radio, reddening and outflow properties of QSOs. In particular, we build upon a detailed analysis of the multiwavelength spectral energy distributions (SEDs) and optical spectral properties of QSOs presented by Calistro Rivera et al. (2021, hereafter CR21). Throughout this work, we adopt a cosmology with H0 = 70 km s−1 Mpc−1, Ωm = 0.3 and ΩΛ = 0.7.
2. Observations and analysis
2.1. Sample selection, multiwavelength data, and SED fiting
The selection process for the QSO sample used in this investigation is described in detail by CR21 as well as in our previous SDSS QSO studies (Klindt et al. 2019; Rosario et al. 2020; Fawcett et al. 2020, 2022). In summary, we select our sample from the SDSS DR14 Quasar catalogue (Pâris et al. 2018), which has detailed photometric and emission line measurements (Rakshit et al. 2020). Adopting the rest-frame luminosity at 6 μm (L6 μm) as the proxy for QSO intrinsic luminosities which is most adequate for our study of optical reddening, we further select only sources with WISE (W1, W2 and W3; Wright et al. 2010) detections at S/N > 3. Then, based on SDSS ugriz bands, we use the redshift-dependent g* − i* colours to define the populations of red QSOs (10% reddest) and a control sample of ‘normal’ QSOs (50% around the distribution median). As demonstrated in our previous studies, this selection ensures a robust and unbiased comparison between red QSOs and a consistently selected control sample. Finally, the most significant cut made by CR21 on the SDSS QSO parent sample was the sky coverage. As illustrated in Figure 1, six survey fields were chosen to achieve the combined availability of deep radio observations and multiwavelength data across all frequencies from the radio to X-rays for all QSOs. They comprise a total area of 175 deg2, including three surveys in the northern sky which are part of the LoTSS Deep Field surveys: the Boötes field, the Lockman-Hole Field, and the ELAIS-N1 Fields (Tasse et al. 2021; Sabater et al. 2021), and three areas in the equatorial sky covered by the Galaxy And Mass Assembly (GAMA) survey fields (Driver et al. 2011), as shown in the upper panel of Figure 1. In the overall LOFAR fields shown by the light cyan areas, we have 4436 QSOs at z < 2.5, from which 755 are red QSOs and 3681 represent the control sample (ALLQSOs sample, see Table 1).
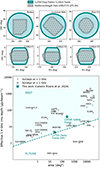 |
Fig. 1. Radio and multiwavelength data used in this paper. The upper panel shows the sky coverage of the LOFAR pointings (cyan area) in the 3 LoTSS Deep Fields DR1 (upper sub-panel) and the GAMA survey fields (lower sub-panel). The sky areas with deep multiwavelength coverage are overplotted (grey stars). The lower panel show the rms sensitivities and sky coverage of the LOFAR data used in this work, i.e. the LoTSS Deep Fields and the LOFAR GAMA Fields, compared to other past and future radio surveys. To enable the comparison, all survey depths are converted to a 1.4 GHz equivalent rms assuming a spectral index of α = 0.7. |
QSO samples used in this study.
To obtain a detailed multiwavelength characterisation of the QSOs in this study, the SDSS ugriz and WISE photometric bands used in the selection, were complemented with abundant FIR-to-UV aperture-matched photometry compiled by Kondapally et al. (2021) for the LoTSS Deep Fields, and the Herschel Extragalactic Legacy Project HELP project (Shirley et al. 2019) for the equatorial GAMA fields. A more detailed description of the multiwavelength photometry consisting of 25−30 photometric data points, from the FIR to the UV (including SDSS and WISE photometry), and the Bayesian SED modelling were presented by CR21. The fraction of the fields (LoTSS Deep + GAMA) with multiwavelength coverage (MWQSOs sample) include 1789 QSOs, from which 306 are red QSOs and 1483 represent the control sample. To disentangle the different physical components, and infer the relevant physical parameters we used the Bayesian AGNFITTER code (Calistro Rivera et al. 2016; Martínez-Ramírez et al. 2024), which applies an MCMC approach to sample the posterior distributions of all physical parameters. The physical model for the host galaxy component in AGNFITTER consists of the stellar populations in the NIR/optical/UV (models by Bruzual & Charlot 2003), and the cold dust emission in the IR/sub-mm (models by Schreiber et al. 2018). The galaxy infrared luminosities used as tracers of the star formation rates (SFR) were estimated by integrating the cold-dust model within 8−1000 μm. The AGN emission was estimated by the addition of the accretion disc emission in the optical/UV (Richards et al. 2006) and the hot dust/torus emission (models by Silva et al. 2004). In particular, the dust-reddening of the accretion disc (also called the Big Blue Bump, BBB) is modelled following a Small Magellanic Cloud dust attenuation law (Prevot et al. 1984), and parametrized by the reddening parameter E(B − V)BBB.
2.2. Radio data
The main radio data used are part of the LoTSS Deep Fields DR1 (Tasse et al. 2021; Sabater et al. 2021), which comprise repeated observations with the LOFAR High Band Antenna (HBA) at 150 MHz of the ELAIS-N1, Lockman Hole, and Boötes fields for a total of ∼380 h. The LoTSS Deep Fields observations are among the deepest wide-field radio-continuum survey at low-frequencies to date, at a resolution of ∼6 arcsec, and with an rms sensitivity reaching 20, 22, and 32 μJy beam−1 in the centres of the three fields, respectively (Figure 1). To complement the LOFAR Deep Fields and obtain a larger sampled volume which is key given the low number density of quasars, we used LOFAR equatorial observations from pipeline verification data which targets three fields from the Galaxy And Mass Assembly survey (GAMA). Each GAMA field consists of 4 LOFAR pointings at 2 × 4 h integration time, at a resolution of ∼8 arcsec and achieving an rms noise level of around 200 μJy beam−1 in the centres of each field (Figure 1). The diversity of sensitivity limits in the different fields was overcome by both field-independent and combined assessments, as well as by focusing on a comparison strategy, carefully matching red and control samples for intrinsic AGN luminosity (L6 μm) and redshift, following our previous work (Lz-matching: Klindt et al. 2019; Fawcett et al. 2020; Rosario et al. 2020, CR21). In particular, the Lz-matching was performed by selecting the closest control QSOs in L6 μm and z for each red quasar (within each field), matched using the Nearest Neighbour method defining a two-dimensional metric on the L6 μm − z space. The resulting luminosity and redshift distributions are shown in Figures 2 and 3, respectively. To quantify the equivalency between the properties of red QSOs and of the Lz-matched control sample we applied the non-parametric two-sample Kolmogorov–Smirnov (KS) test. Based on this test, we found that both the luminosity and redshift distributions are equivalent with p-values of pKS-value = 0.953 and pKS-value = 0.983, respectively. Whenever the limited sample sizes did not allow us to apply this matching approach, we make an explicit note in the respective sections.
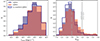 |
Fig. 2. Distributions of 6 μm luminosities (L6 μm, left panel) and radio loudness R150 (right panel), for all SDSS QSOs from the ALLQSO sample. The parent sample of red and control QSOs are shown as red and blue shaded areas, respectively, whereas the subsample of control QSOs matched in z and L6 μm to the red QSOs are shown by the dark blue unfilled histogram. |
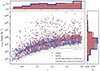 |
Fig. 3. Luminosities at 150 MHz as a function of redshift for SDSS QSOs detected at 3σ by LOFAR (ALLQSOs sample). LOFAR detections in the total SDSS sample are represented in the central panel as red and blue markers, for red QSOs and control QSOs, respectively. The thick grey line shows the radio luminosity expected from a SFR of 100 M⊙ year−1 and the thin grey lines represent the sensitivity levels for the different fields as described in the legend. The upper and side panels show the one-dimensional distributions for the redshifts and 150 MHz luminosities, respectively. The red and blue filled histograms represent the red QSOs and control QSOs respectively, and the dark blue unfilled histogram shows the Lz-matched sample of control QSOs. The distribution of the luminosities at 6 μm for this sample is shown in a similar manner in Figure 2. |
For the catalogued sources, the radio to optical cross-matching was performed using the likelihood-ratio matching for all fields, and additional visual inspection for the LoTSS Deep Fields. A detailed description of the cross-matching process is presented by Kondapally et al. (2021). For this study, we used optical position coordinates from the LoTSS catalogue to find the counterparts to the SDSS QSOs in our sample, adopting a search radius of 1 arcsec with respect to the SDSS positions. In addition to using the LOFAR catalogues associated with the data, we computed the radio fluxes for the SDSS QSOs with fainter radio emission, which are not formally detected by the source extraction strategy used in the construction of the catalogue (Python Blob Detector and Source Finder, see Mohan & Rafferty 2015), which is limited to sources with S/N ≳ 5. We estimate these fluxes by measuring the peak fluxes within circular apertures around the known SDSS source positions, and consider a measurement as a detection if it has a S/N > 3, where the noise is estimated from the local rms. Given the higher spatial resolution, for the Deep Fields we choose an aperture of rDF = 6″, while for the GAMA fields we use rG = 10″ (chosen due to the non-circular shape of the beam in the equatorial fields). To test the robustness of our method, we compare the fluxes computed using this approach with those from the source extraction method for the sources formally detected in the catalogue. We find a tight agreement between these values, with a Pearson product-moment correlation coefficient of 99.93% and a p-value of < 0.0001.
Additionally, in order to assess the ratio of potential false associations we performed a simulation of random associations. In particular, we generated a set of random positions within the survey areas, which have the same number density and distribution characteristics as our QSO population. We then applied the same matching technique and search radius applied to the QSOs in the respective survey areas, and obtained a 3σ detection ratio for the simulated sources. Finally, we repeated the random generation and matching process 100 times to get an average. The average detection ratio of these random positions provides an estimate of the ratio of potential false associations for the 3σ detections in our QSO sample. Comparing these estimates to the radio detection fraction of our QSO population we found false detection ratios to the non-catalogued 3σ sources of 5.2% for the GAMA Fields and 9.3% for the Deep Fields. For 5σ sources these false association ratios decrease to 0.3% and 3.8%, for the GAMA and Deep Fields, respectively. The difference between the surveys is likely driven by the different depths of both fields, where the Deep Fields maps have a larger density of sources.
2.3. Detection fractions, radio loudness and morphology
From the 4436 QSOs in the ALLQSOs sample, we found that 941 QSOs (21%) have radio detections in the LOFAR catalogues (≳5σ, LoTSS Deep + GAMA), and 2469 (56%) have radio detections at > 3σ. Remarkably, in the areas of LoTSS Deep (northern areas) with multiwavelength coverage (MWQSOs), 94% (451/480) of the SDSS QSOs are 3σ-detected, which is the largest radio detection fraction ever achieved for optical QSOs, even after considering the largest ratio of potential false associations (9.3%). Using the catalogued sources only (≳5σ), we found a detection fraction of 60% (286/480), instead. For the entire LOFAR region of LoTSS Deep (ALLQSOs) this number decreases to 74%, due to the fact that the radio sensitivity decreases moving from the centers of the LOFAR pointings. See Table 1 for details on the sample differences. The unique high detection fractions in the LoTSS Deep fields and the complementary wide field coverage of the GAMA fields, allows this study to achieve an improved characterisation of the radio properties of optically selected QSOs at both the radio-faint and the radio-bright ends.
In order to explore the radio luminosity distribution of the QSOs, in Figure 3 we show the 150 MHz luminosities L150 MHz, of all radio-detected sources as a function of redshift. The upper and right panel show histograms of the distributions of redshift and radio luminosities for the radio-detected red and control sample (shaded histograms), as well as the Lz-matched control sample (dark blue unfilled histograms; see Section 2.2 for a description of the Lz-matched sample). While it is clear that an improved similarity in redshift distribution (upper panel) is achieved for the red and control samples matched in redshift and 6 μm luminosity as expected, this is not the case for the radio luminosity (right panel), where the red quasar populations clearly shows a higher radio luminosity despite being matched in 6 μm luminosities. As a reference we plot as well the sensitivity limits for each one of the LOFAR fields. Figure 3 shows that the low-frequency radio luminosities covered by our samples of red and blue QSOs vary by 6 orders of magnitude, from 1023 − 1029 W Hz−1.
The range of radio luminosities and radio properties in the QSO population is in part driven by the diversity in AGN intrinsic power, traced by L6 μm. Analysing and comparing radio luminosities alone can thus be non-informative on the physical conditions which lead to the production of radio emission itself. To focus on this instead, we weight the radio luminosities by the AGN radiative power and define the radio loudness of the populations as R150 = log10(1.5 × L150[W Hz−1]/L6 μm[ergs s−1]). This definition follows the description by Rosario et al. (2020), and is equivalent to the relation used at higher radio frequencies (Klindt et al. 2019). We note that in contrast to many definitions of radio-loudness in the literature which use the optical regimes to trace the radiative power in AGN (e.g. Kellermann et al. 1989; Gürkan et al. 2019; Arnaudova et al. 2024), we use L6 μm instead to avoid biases due to optical reddening, crucial for our study. The deep and wide-field radio maps used in this work allow us to explore the radio loudness parameter space in a complete manner. The distributions of radio-loudness for the ALLQSO sample is shown in Figure 2. We calculate upper-limits for the radio-loudness in non-detected sources using radio aperture fluxes. These are included in Figure 4 to showcase the detection fractions as a function of radio-loudness, where they contribute to the lower radio-loudness bins. However, we note that for the remaining investigation we only consider sources that are radio-detected. To put the radio-loudness distribution observed with our deep radio data in context with traditional radio classifications, we define the limit between radio-loud and radio-quiet at R150 = −4.5, equivalent to previous studies. While our sample comprise an extensive range of radio-loudness (−7.4 < R150 < −2.), the vast majority of the QSOs (94%) in our sample would be considered ‘radio-quiet’ according to traditional classification, and only a small percentage would be considered radio-loud (6%). Given the continuous distribution of radio loudness which is observed in our sample and other deep radio surveys (see also Gürkan et al. 2019; Macfarlane et al. 2021; Yue et al. 2024), for the remaining of this paper we move on from the traditional bimodal scenario to a more detailed study of the radio-loudness distribution.
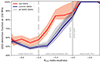 |
Fig. 4. Radio detection fraction at 3σ of the ALLQSOSs sample in the combined LOFAR fields, as a function of radio loudness. Red QSOs and control samples are matched in L6 μm and z. Radio loudness was estimated for the sources without detections using measured radio fluxes at the QSO position. These upper limits are included in this plots and dominate the lower bins of the radio faint regime. Consistent with previous studies, the detection fraction of red QSOs (red line), is significantly higher than the control sample (blue) in particular in the regime of intermediate radio loudness (−5.5 < R150 < −4.5). The shaded areas represent 1σ binomial uncertainties for each bin following Cameron (2011). |
To investigate how the radio detection fraction changes as a function of radio loudness in our QSO sample, Figure 4 shows the radio detection fraction of red QSOs and the control sample populating each bin of radio loudness. In agreement with our previous studies (Klindt et al. 2019; Fawcett et al. 2020; Rosario et al. 2020), we find a clear difference in the detection fractions as a function of radio loudness R150 for red and control QSOs, where red QSOs achieve close to 85% detections already at (R150 > −5.2), whereas control QSOs only reach that detection fraction at the radio-loud limit (R150 > −4.5). In the regime traditionally known as ‘radio-quiet’ (R150 < −4.5), the radio detection of red QSOs is higher than for the control sample, with a maximum difference at a radio-loudness of (R150 ∼ −5.0). To further investigate the radio emission in QSOs traditionally classified as ‘radio-quiet’ (R150 < −4.5; e.g. Klindt et al. 2019; Rosario et al. 2020), we further divide the radio-quiet population into two regimes which appear relevant from Figure 4. We therefore define the radio-intermediate regime within the range of −5.5 < R150 < −4.5, and the radio-faint regime at values of R150 < −5.5, as shown in Figure 4. We observe that the radio-detection excess for red QSOs peaks in the radio-intermediate regime and then decreases for the radio-faint sources. This suggests that the radio-loudness parameter might be a good indicator of the different mechanisms producing radio emission. Moreover, sources within the radio-intermediate regime appear to be particularly relevant for the study of the connection between QSO reddening and radio emission.
The morphology of radio sources can be informative on the physical origin of the radio emission. To apply a morphological analysis to our sample, we restrict our coverage to the QSOs with counterparts in the LoTSS Deep Fields catalogues (e.g. ≳5σ; 166 red QSOs and 405 control QSOs) due to their superior depth and spatial resolution (6″). Extracting thumbnail images from the LOFAR maps at the QSO positions, we classify the sources through visual inspection, without previous knowledge of the colour properties of the source. To make a simple comparison we classify the sources into four morphological classes. These are defined as: ‘compact’ sizes, which are unresolved at the scales of the LoTSS Deep resolution, equivalent to scales of < 50 kpc for a redshift of z = 2; ‘medium’ sizes, which are resolved, slightly larger than the LOFAR beam and corresponding to sizes of 40 kpc < s < 85 kpc; ‘extended’ sizes which are long multi-component structures, corresponding to > 85 kpc; and ‘faint’, as shown in the upper panel of Figure 5. The respective numbers and fractions are reported in Table 2. The latter class ‘faint’ refers to sources with low surface brightness and low S/N, where no assessment can be made on the morphology. As shown in the lower panel of Figure 5, we find that the majority of QSOs are too faint (55% and 77% for red and control QSOs) to characterise their morphologies. After excluding the faint sources, we find that QSOs are overall preferably compact (46%). This is in agreement with our previous studies (Klindt et al. 2019; Fawcett et al. 2020; Rosario et al. 2020) using high frequency and/or shallower radio data. The fraction of sources with medium sizes is lower (35% and 37% for the red and control QSOs, respectively), whereas a minority are extended (19% and 17% for the red and control QSOs, respectively). Given the radio sensitivity achieved in the LoTSS Deep Fields, we can now investigate the distributions of the morphologies as a function of radio loudness. Given that the large majority of morphologies in the radio-faint end is predominantly unconstrained, we focus on the other two radio-loudness bins. Overall we find that compact and medium (marginally resolved) morphologies are present for both red and control populations in a similar manner in the radio-intermediate regime, suggesting that radio mission at both sub-galactic and circum-galactic scales can be both expected. In both the radio-intermediate and at the radio-loud end, we find that compact morphologies are more prevalent for red QSOs than for the control QSOs. This is particularly clear in the radio-loud bin where ∼60% of the red QSOs remain compact, while only ≲20% of the control sample does so, suggesting that red QSOs are less likely to host radio structures of 10 s of kpc.
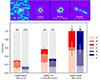 |
Fig. 5. Fraction of sources of a given radio morphology (faint, compact, medium, and extended) within each bin of radio loudness. Thumbnails of the LOFAR images are shown in the upper panel to exemplify the morphological classes used here, where two circles are depicted at 3″ (dashed line) and 10″ (solid line). The bars in the lower panel include all morphology classes (each denoted by a single letter). Only ALLQSOs from the LoTSS Deep Fields catalogue (northern fields) were used here due to their depth and better resolution (6″). Error bars represent 1σ binomial uncertainties. |
Our morphology results are in overall agreement with the conclusions from our previous work, i.e. we also find that faint and compact sources dominate the morphology distribution of QSOs (Klindt et al. 2019; Fawcett et al. 2020; Rosario et al. 2020, 2021), and that the radio-excess in red QSOs is mainly driven by the compact and marginally resolved sources (Fawcett et al. 2020). However, our deep low-frequency radio data reveal larger fractions of medium-sized (marginally resolved) sources (35% and 37% for red and control QSOs, respectively) as compared to the fractions reported by Fawcett et al. (2020) using similarly deep radio data at 1.4 − 3 GHz (18% and 23% for red and control QSOs, respectively). These different fractions are potentially explained by the fact that the most extended regions of radio structures are more visible at lower radio frequencies, as these have steeper radio spectra due to ageing of the electron populations producing the radio emission. We note however that this analysis is limited by caveats related to the small sample statistics as well as potential biases intrinsic to the visual inspection which are not taken into account within the uncertainties.
3. Results
3.1. The origin of the bulk of the radio emission in QSOs is not star formation
It has been widely debated in the community whether synchrotron emission from star formation can be the principal or a significant source of radio emission in radio-quiet AGNs (see Panessa et al. 2019, for a recent review). Building upon previous work (Fawcett et al. 2020; Rosario et al. 2020), we now take advantage of the increased sensitivity and sky coverage of our radio data, to explore this question in a statistical sample of QSOs that populates an extensive range of radio luminosities. Based on our detailed Bayesian SED-fitting approach applied to deep photometry in all the studied fields, including deep Herschel PACS and SPIRE data, we can estimate the radio synchrotron emission expected from star formation using the infrared-radio correlation (IRC). Since the SED fitting output is required for the central and upper panel of Figure 6, we use here the MWQSO sample, which has extensive deep photometric coverage allowing us to distinguish between the different host galaxy and AGN components in individual QSOs.
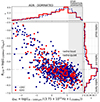 |
Fig. 6. Radio loudness R150 for the MWQSO sample, as a function of the qIRC-value, which parametrises the IR-radio correlation. The central panel shows the posterior median values for red QSOs and the control sample. The upper panel shows the combined distribution of the qIRC posteriors (100 realizations per source) for the two samples, obtained from the Bayesian SED fitting. The grey shaded area represents the value of qIRC found by Calistro Rivera et al. (2017) for star forming galaxies at 150 MHz qIRC − 150 MHz = 1.54 with a scatter of 0.5. The right panel shows the combined distribution of the R150 values for the two samples. |
The IRC is a tight empirical correlation observed across several orders of magnitudes in radio luminosities, redshift, and using different radio frequencies (for low radio frequencies see e.g. Calistro Rivera et al. 2017; Gürkan et al. 2018; Smith et al. 2021; McCheyne et al. 2022; Best et al. 2023). The IRC is parametrized by the qIRC parameter, defined as
 (1)
(1)
where L8 − 1000 μm is the galaxy rest-frame IR luminosity (in erg s−1) and is estimated after subtracting the contribution from the AGN torus emission to the total infrared emission. L150 MHz is given in ergs s−1 Hz−1, and the factor of 3.75 × 10¹² Hz is the frequency corresponding to 80 μm used in the definition to make qIRC a dimensionless quantity. The AGN subtraction to the total IR luminosity is estimated from the Bayesian SED fitting and, while it varies largely across the sample, the torus contribution is overall substantial with a median value of the posterior distribution of ∼70%, and is equivalent for both red and control QSOs (see CR21 for more details).
The central panel in Figure 6 shows the median posterior values of the qIRC parameter for each source in relation to their radio loudness R150. To estimate the fraction of the radio emission that is consistent with star formation, we use the value of qIRC at 150 MHz found by Calistro Rivera et al. (2017) for star forming galaxies qIRC − 150 MHz = 1.54 with a scatter of 0.5, shown as a grey shaded area in Figure 6. The upper side panel shows the distribution of qIRC for red and control QSOs. In particular, we note that the qIRC distribution in the side panel is a superposition of the posterior distributions for each source, obtained from the Bayesian SED fitting, therefore accounting for the uncertainties in the measured IR luminosities, as well as uncertainties on the AGN subtraction. To compare the distributions in the different samples we apply the non-parametric two-sample Kolmogorov–Smirnov (KS) test. Based on this test, no significant differences are seen in the relative contribution of star formation to the radio emission between red and control QSOs (pKS-value = 0.48), albeit the sample size might limit the recognition of subtle differences. This is in line with CR21, which report no differences in the star formation rates between the red and the control QSOs. The right side panel in Figure 6 shows the distribution of R150 for the MWQSO sample. No significant differences are found between the R150 distributions for red and control QSOs according to the KS test, due to the small samples involved. In contrast, using the (> 2×) larger ALLQSO sample, we find significant differences between the R150 distributions for red and control QSOs (p = 0.002 overall, p = 10−7 when Lz-matched), as shown in Figure 2. Using this larger sample it is clear that red QSOs have a higher density at intermediate radio-loudness. As seen in Figure 6 for the MWQSO, a trend between qIRC and R150 is observed, where higher radio-loudness in the QSOs makes it less probable for their radio emission to originate in star formation. At the radio-faint end (R150 < −5.5), star formation can start dominating the radio emission for a small fraction of the QSOs.
To further investigate the origin of the radio emission in QSOs, we use the qIRC to compute the fraction of the radio luminosity of each source which originates in the AGN, i.e. which is in excess from the IRC. Since a multiwavelength characterisation is required here, the study in this section is restricted to the MWQSOs sample. As is apparent from Figure 6 only a small fraction of the QSO population has radio emission which is consistent with being produced by star formation only (grey shaded area). We discuss this fraction in detail next, as well as the implications of different calibrations of the qIRC value. Assuming the median value of qIRC reported by Calistro Rivera et al. (2017) (qIRC = 1.54), we find that the radio emission from 76% of the QSOs in our sample (log L6 μm > 43.7) is AGN-dominated. However, the value and potential dependencies of qIRC have been a matter of discussion and revision in the recent years enabled by the increasing number of deep radio surveys. Indeed, Calistro Rivera et al. (2017) reported a redshift-evolution of qIRC following the relation qIRC = 1.72 × (1 + z)−0.22. If we apply this relation, the fraction of QSOs where the radio emission is dominated by the AGN decreases to 70%. Larger studies using deeper radio data and mass-complete star forming galaxy samples (instead of a radio-selected sample as used by Calistro Rivera et al. 2017) have reported slightly different values of qIRC at low frequencies, and crucially, a dominant dependence on stellar mass (Smith et al. 2021; McCheyne et al. 2022; Das et al. 2024, but see also). In particular, McCheyne et al. (2022) reported a weaker qIRC − z relation following qIRC = 1.94 × (1 + z)−0.04 and a qIRC − M* relation following qIRC = 2 − 0.22 × (log M* − 10.05). Applying this relation to our sample in combination with stellar masses for all sources estimated from the SED fitting (CR21), we find that the fraction of QSOs where the radio emission is dominated by the AGN increases to 91% and 93%, for the z and M*–relations, respectively. To account for the diversity of these results, we will conservatively assume the median value reported by Calistro Rivera et al. (2017) for the remaining of this study, i.e. that at least 76% of all QSOs in our sample (log L6 μm > 43.7) are AGN-dominated.
The combination of a statistical sample of QSOs, uniquely deep radio imaging and FIR-to-UV SED fitting in this study allows us to confirm and complement our previous results on SDSS QSOs (Fawcett et al. 2020; Rosario et al. 2020), which find similar conclusions albeit with smaller radio samples and less multiwavelength coverage, respectively. To see how this fraction evolves as a function of radio luminosity, in Figure 7 we show the AGN fractions for each QSO in our sample as grey points. Although there is a significant variation from source to source, the bulk of the radio luminosity from the QSO population clearly originates in processes other than star formation. A statistical view is shown with the dark cyan line and uncertainties, which represent the fraction of QSOs in our sample for which the AGN fraction at 150 MHz is higher than 50%, i.e. the radio emission is dominated by AGN processes. Accounting for the binning uncertainties (shown as shaded area), we find that the radio emission in QSOs originates in the AGN in ≳68% of the QSOs even at the lowest luminosity bin probed (L150 MHz > 1023 W Hz−1). This result is also in agreement with previous literature (Zakamska & Greene 2014), but now exploring lower AGN luminosities. Macfarlane et al. (2021) and Yue et al. (2024) also address this question by performing a parametric modelling of the radio luminosity distributions of QSOs using larger shallower data sets from LoTSS DR2, with the model assumption that the radio emission is a superposition of two components: star formation and jet emission. While they also find that the fraction of the radio emission in QSOs originating in jets/AGN can be significant and prevalent for QSOs at radio luminosities of L150 MHz > 1025, they find lower fractions at lower luminosities. This discrepancy is however mainly due to their different definition of AGN dominated sources. While they define AGN dominated sources as sources with AGN radio emission 5 times larger than that from SF, we consider AGN dominated sources as those where the AGN is responsible for the majority (> 50%) of the total radio emission. Interestingly, when adopting their definition we find consistent results despite our independent methodologies as well as different data sets employed. In particular, their methodology consists of modelling the shape of the radio luminosity distributions while we study the emission from single sources. Furthermore, while the quasar sample employed in their study is significantly larger (> 40 000 QSOs), their study is restricted to the radio, while our study uses deeper radio data in combination with detailed radio-to-UV photometry and multiwavelength SED modelling for each source.
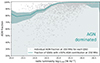 |
Fig. 7. AGN contribution fraction to the radio emission of QSOs at 150 MHz, as a function of radio luminosity L150 (for the MWQSO sample). The grey dots show the AGN fraction of the L150 for each source, i.e. the fraction which is in excess from the SF relation accounting for the scatter. The dark cyan line and shaded area represent the percentage of the overall population which have AGN fractions larger than 50%, i.e. are dominated by the AGN. The shaded dark area around the line shows 1-σ binning uncertainties. |
3.2. A fundamental connection between dust-reddening and radio emission
The remarkable finding of an enhanced compact radio detection fraction in red QSOs (Klindt et al. 2019; Fawcett et al. 2020; Rosario et al. 2020; Glikman et al. 2022) suggests a connection between the radio emission and intrinsic QSO properties. We investigate this further, by looking beyond the red and control QSO classification, and investigating the overall dependence of the radio detection fraction on dust-reddening of the accretion disc, parametrized by the E(B − V)BBB parameter. Through the Bayesian SED-fitting applied on the rich optical photometry available in our fields (Section 2.1), we have inferred robust E(B − V)BBB for all QSOs in our sample (CR21). Interestingly, Figure 8 shows a positive correlation between the detection fraction as a function of reddening E(B − V)BBB. The solid black line shows the dependence for the sources in the catalogue (5σ), while the dashed black line, which shows higher fractions for the 3σ detections at 150 MHz, as expected, presents a similar trend. Uncertainties from the binning are shown as shaded area, colour coded to represent the continuous QSO colour transition traced by the E(B − V)BBB. As shown in Figure 8, this result is in agreement with recent findings by Fawcett et al. (2023), estimated from fitting the DESI spectra of ∼35 000 QSOs. Similar to our findings, they report a continuous relation between the radio detection fraction and the E(B − V) values out to higher dust extinction values than we can probe in SDSS QSOs (up to E(B − V)∼1.0) but with lower-sensitivity LOFAR data. The finding of this continuous relation strongly suggests that there is a physical relation between the dust attenuation at nuclear scales (as suggested by the high dust temperatures found by CR21) and the production of radio emission, which is not restricted to the most reddened optical sources but is a continuous property relevant for the entire quasar population.
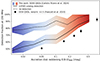 |
Fig. 8. Radio detection fraction of QSOs at 150 MHz as a function of the accretion-disc reddening in the MWQSO sample. The accretion-disc reddening is estimated from the SED fitting for each source and is parametrised by the E(B − V)BBB parameter. The solid line shows the trend considering only catalogued sources (≳5σ), whereas the dashed line considers all QSOs detected down to ∼3σ. The shaded area represent 1σ binomial uncertainties for each bin. A clear positive relation is apparent, where the radio detection fraction increments with increasing dust-reddening, in agreement with QSOs detected in the DESI survey (black circles). |
3.3. The connection between radio, dust reddening and outflows
In our previous work (CR21), our analysis of SDSS spectral properties revealed a higher incidence of winds in red QSOs as compared to the control sample, traced by high-velocity [O III] wing components (z < 1), and C IV blue-shifts (1.4 < z < 2.5). Additionally, we found that the sources with stronger outflow components exhibit higher levels of hot nuclear dust emission (Tdust ∼ 1000 K) as revealed by the SED fitting. These high dust temperatures suggest that the dust reddening in QSOs originates over nuclear and circumnuclear scales (< 1 kpc) and is connected to C IV and [O III] winds. The reddening material thus might be distributed along nuclear dusty winds, similar to what has been observed in a few local AGN (e.g. Hönig & Kishimoto 2017; Lyu & Rieke 2018). We now explore the radio data of these sources to look for a link between the higher incidence of winds and the higher radio detection fractions in red QSOs. Here we use the ALLQSOs sample.
Studies in the literature suggest that the radio detection fraction in QSOs increases as a function of wind velocities (e.g. C IV blueshifts, Rankine et al. 2021), or that radio detected AGN have a higher outflow rate than non-detected radio AGN (Mullaney et al. 2013; Perrotta et al. 2019; Petley et al. 2024; Escott et al., in prep.), although most of them do not consider colour in their study. We evaluate whether this is also observed in our sample using catalogue-detections (∼5σ) in the ALLQSOs samples. We confirm that the radio detection fractions grow as a function of both increasing C IV blueshifts and increasing [O III] velocities. However, we argue that this effect is largely dominated by a dependence of both radio detections and C IV and [O III] line-widths on AGN bolometric luminosities (see also Woo et al. 2017; Rankine et al. 2021). To test this and capitalize on the depth of our data, we use the radio-loudness parameters instead of radio detection fractions, which normalizes the radio luminosities by the AGN intrinsic radiative power.
Figure 9 shows the cumulative distributions of spectral line velocities used as outflow tracers ([O III] wing velocities and C IV blue-shifts), for both red and control QSOs, split into three sub-samples of different levels of radio-loudness, radio faint (R < −5.5), radio-intermediate (−5.5 < R < −4.5) and radio-loud (R > −4.5)1. We apply the same sample cuts as in our previous work, to avoid contamination from the host galaxy and incompleteness (L6 μm > 44.5 ergs s−1), as well as to ensure high quality detections of the wing components (![Mathematical equation: $ F_{\mathrm{[O\textsc{iii}]peak}} > 3\times \mathrm{rms}_{5100\,\AA} $](/articles/aa/full_html/2024/11/aa48982-23/aa48982-23-eq2.gif) ). After these cuts we have in total 33 red QSOs and 144 control QSOs for the [O III] outflow study and 108 red QSOs and 921 control QSOs for the C IV outflow study. Given the small sample size for the [O III] study, we are not able to match the red and control sources by L6 μm and z, however we note that the cuts applied already ensure very similar distributions. We overplot the cumulative distributions of non-detected sources just for reference to make the comparison easier.
). After these cuts we have in total 33 red QSOs and 144 control QSOs for the [O III] outflow study and 108 red QSOs and 921 control QSOs for the C IV outflow study. Given the small sample size for the [O III] study, we are not able to match the red and control sources by L6 μm and z, however we note that the cuts applied already ensure very similar distributions. We overplot the cumulative distributions of non-detected sources just for reference to make the comparison easier.
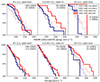 |
Fig. 9. Cumulative distributions of the [O III] and C IV velocities (upper and lower panel, respectively). The [O III] velocities are parametrised by the FWHMs for the wing component of the [O III] emission line, and the C IV velocities are paremetrised by the velocity blueshifts of the C IV emission lines. Red and blue lines represent the distributions for the red and control QSOs, respectively. The left to right panels show the distributions for radio-faint, radio-intermediate and radio-loud subsamples. Solid lines are the distributions of radio detected QSOs within each bin of radio-loudness, while the distributions of undetected sources are shown as dotted lines for reference. Here we use the ALLQSOs sample at the redshifts required to cover the respective emission line within the SDSS spectral window (z < 1 for the [O III] line, and 1.4 < z < 2.5 for C IV). Additionally, a luminosity threshold from our parent sample was applied to avoid contamination from the host galaxy, as well as a S/N criterion to ensure high quality detections of the [O III] wing components. |
As shown in the upper panel of Figure 9, we find a slight apparent enhancement in [O III] wind strength for the red QSOs in the radio-faint regime as compared to the control sample, yet it is not significant according to the 2-sample KS test (p-values = 0.16). Interestingly, for the radio-intermediate subsample, we find that the [O III] wind strength for the red QSOs significantly increases as compared to the control sample (p-value = 0.024). For the last bin of radio-loud sources, our sample was severely reduced, therefore not allowing us to make any comparison. These findings suggests that the bulk of increased [O III] wind velocities reported in the red QSOs by CR21 is connected to radio emission in red QSOs with intermediate radio-loudness.
In the lower panel of Figure 9 we perform the same experiment for the C IV blue-shifts. We find increased C IV blue-shifts for the red QSOs as compared to the control QSO, also when matching the samples in L6 μm and z, with p-values of pKS = 0.0001, 0.002, 0.035, 0.001 for the radio non-detected, the radio-faint, the radio-intermediate and the radio-loud populations, respectively. This is in line with our previous findings in CR21, as well as with simulations which propose that radiation pressure on dust is effective in launching outflows (e.g. Costa et al. 2018; Soliman & Hopkins 2023). Interestingly, in contrast to what we found in the [O III] analysis, the C IV velocity distributions do not seem to change with respect to the radio-loudness. Indeed, comparing the distributions in the three radio-loudness bins to the distributions for the radio-undetected sources (dotted lines), we find that they are consistent according to the KS-test (pKS = 0.98, 0.66; pKS = 0.99, 0.24; pKS = 0.56, 0.11 for control and red QSOs at the radio-faint, the radio-intermediate and radio-loud bins, respectively). This suggests that while there might be an increase in radio detections with increased C IV blue-shifts (e.g. Rankine et al. 2021), this effect disappears when accounting for the intrinsic AGN power. We will discuss possible scenarios which could explain the differences in the outflow properties between C IV and [O III] in Section 4.
We note that our results are limited by a few factors. The SDSS [O III] spectra are available only for sources at z < 1, and strictly require further S/N cuts due to the limited spectral quality, which significantly decreases the sample relevant to the [O III] studies. While the compared quasar samples have equivalent median intrinsic luminosities (differences are < 0.1 dex) and similar redshift distributions due to the cuts performed, the limited sample size did not allow us to further match them in z and L6 μm.
4. Discussion: the origin of the radio emission in QSOs
We can now contextualise these results within physical scenarios that can provide a unified explanation for all observed phenomena. The consistent relationship between reddening and the radio detection fraction, as presented in Figure 8 and Fawcett et al. (2023), implies the existence of a shared physical mechanism responsible for both the compact radio emission in QSOs and the reddening of the accretion disc emission. Having excluded star formation as the origin of the compact radio emission through our SED-fitting approach in Section 3.1, we evaluate the remaining potential explanations.
4.1. Shocks from radiative driven winds
A possible candidate for this mechanism is shocks from dusty radiation-driven winds (e.g. Costa et al. 2018; Soliman & Hopkins 2023). These AGN winds have been proposed in the literature to explain the radio emission in radio-quiet quasars (Zakamska et al. 2016; Nims et al. 2015; Hwang et al. 2018). In particular, accelerated particles in the shock fronts of the winds emit synchrotron radiation through the interaction with the magnetic fields. Since no physical explanation is apparent, which would enhance the radio emission in shocks for dusty (as compared to less dusty) winds of fixed wind velocities, we would expect stronger wind signatures for stronger radio emission, irrespective of their colour. However, for red QSOs, we detect a significant enhancement of [O III] wind velocities at intermediate radio-loudness, as compared to the radio-faint regime, whereas no enhancement is observed for the control QSO sample (Figure 9). This suggests that circumnuclear dust is a key condition to detect a relation between radio emission and [O III] outflows. Moreover, our morphology analysis in Figure 5 suggests that, at the intermediate radio-loudness regime, moderately extended emission (> 40 kpc) is present in the morphologies of the radio emission in both red and control QSOs. While we cannot rule out the wind scenario for red QSOs given their primarily compact morphologies, we argue that the radio emission at 40−85 kpc scales observed for a fraction of both the control and red (radio-quiet) QSOs cannot be due to shock interactions (which would be expected to be most effective on host-galaxy scales where the gas density is higher) and is almost certainly due to jets. Therefore, to reconcile this observation with the observed continuity in radio-loudness, as well as the continuous radio-reddening relation found in Figure 8 and by Fawcett et al. (2023), a self-consistent explanation is achieved by invoking the presence of compact radio jets of different sizes in QSOs.
4.2. Jets and jet-induced shocks
The prevalence of radio jets of compact and moderate scales in ‘radio-quiet’ QSOs has been recently supported by observations at high-resolution (e.g. An & Baan 2012; Jarvis et al. 2019; Hartley et al. 2019) as well as by modelling the flux-density distributions in deep wide-field radio surveys (e.g. Macfarlane et al. 2021; Yue et al. 2024). On the one hand, in our sample we have observed extended morphologies (> 85 kpc) in a fraction of the QSOs in the radio-intermediate and radio-loud bins (Figure 5) for both red and control QSOs. These morphologies strongly suggest that these structures are radio jets, since those extensions cannot easily be created by winds if they are not collimated or exceptionally strong, whereas we find no strong wind signature in their [O III] spectra (Figure 9).
On the other hand, we also see that the radio emission in red QSOs, even at the ‘radio-loud’ regime, is predominantly compact (< 40 kpc). Indeed, the results presented in CR21 find dust temperatures of 1000 K for the dust responsible for the reddening in this QSO sample. These temperatures suggest that the dust is distributed on scales of a few pc to a few 10 s of pc. Additionally, results reported in the literature for small samples at higher radio resolution at 1.4 GHz (Rosario et al. 2021) suggest that the compact radio emission in red QSOs dominates at scales of < 2 kpc. We find as well that the dust and the radio emission is connected to the presence of high-velocity [O III] winds, i.e. wind components at circumnuclear narrow line region (NLR) scales, whereas we do not find this connection to the C IV winds prevalent at broad line region (BLR) scales. We note, however, that these results are limited by the availability of SDSS [O III] and C IV spectra, which is restricted to a few available redshift windows and by S/N cuts due to low spectral quality. Furthermore, this part of the study adopted a less conservative approach when defining comparative samples, since the limited sample size of spectra did not allow us to further match red and control QSOs in z and L6 μm. Limitations aside, these observations would suggest that the radio-wind connection occurs at scales beyond circumnuclear rather than happening at the accretion disc/jet base scales.
To reconcile these observations, we argue that the connection between the radio emission, reddening, and outflows occurs predominantly on circumnuclear-to-sub-galactic scales. This suggests that (a) the origin of the radio emission in red QSOs is different to the control QSOs, and/or (b) radio jets in red QSOs are in a younger phase (i.e. they are smaller) and/or (c) the radio jets in red QSOs are maintained compact due to interaction with the circumnuclear/ISM environment.
While scenario (a) is plausible, it does not agree well with the continuous relation which we observe between the radio emission and QSO reddening in Figure 8, which requires a unified physical explanation for the radio emission in red and control QSOs. So, while different mechanisms might indeed be in place, scenarios that include radio jets as a continuous physical component are more likely, even if these are potentially not the most relevant for the radio excess observed to increase with reddening.
Scenario (b), where red QSOs host younger (more compact) radio jets than control QSOs, on the other hand, would explain our observations on morphology well, as well as those found in the literature (Rosario et al. 2021), since sizes of radio jets are a proxy of the age of the jet (e.g. Hardcastle & Croston 2020). It would also be in agreement with other studies on red QSOs, which suggest red QSOs are part of a different evolutionary phase (Urrutia et al. 2005; Glikman et al. 2012, 2013, 2022; Banerji et al. 2015; Klindt et al. 2019). On the other hand, in order to explain our observations on dust and outflows the younger red QSOs would be required to coincidentally be undergoing a blow-out phase at the same time, where dust and gas would be ejected from the obscured AGN phase to an unobscured phase, as suggested by evolutionary models (Sanders et al. 1988; Hopkins et al. 2008; Alexander & Hickox 2012). This is supported by our findings and studies in the literature, which also find that the [O III] outflows are more prevalent when the radio emission is compact (Molyneux et al. 2019), and young, as suggested by their peaked radio SEDs (Santoro et al. 2020; Kukreti et al. 2023). Our observations of a continuous relation between dust reddening and radio detection, however, is more suggestive of a causal and gradual connection than the parallel occurrence of jet launching and a blow-out phase. We explore this in scenario (c).
Finally, in scenario (c) we propose that the radio emission arise from a superposition of compact radio jets and their interaction with the environment, which produce additional radio emission from jet-induced shocks. For this scenario, we consider that red QSOs are sources with overall denser and dustier circumnuclear environments than the control QSOs, potentially due to evolutionary reasons connected to (b). The interplay between compact radio jets and this dense circumnuclear environment is naturally expected to produce outflows and shocks (e.g. in simulations, Mukherjee et al. 2018; Bicknell et al. 2018). The increased incidence of jet-induced outflows and shocks in redder QSOs would, in turn, produce both the radio emission observed to gradually increase as a function of E(B − V)BBB (Figure 8), as well as the stronger [O III] kinematics we observe in these radio-intermediate sources (Figure 9 and e.g. Mizumoto et al. 2023). Additionally, these interactions with a dense environment would restrict the growth of the evolving radio jet, therefore maintaining it to the compact scales at which they are observed even at the radio-loud regime (here < 40 kpc due to resolution, while sub-arsecond resolution studies suggest sizes of < 2 kpc are typical at least at 1.4 GHz Rosario et al. 2021). This confinement to compact scales will also enhance the radio luminosity of the jets by decreasing adiabatic expansion losses (e.g. Barthel & Arnaud 1996). Conversely, the radio-jets in the control QSOs, residing in less dense environments, can potentially pierce through a circumnuclear and interstellar medium without significant interaction with the galactic environment (as seen also in simulations Mukherjee et al. 2018), growing to the moderate sizes observed in the radio-intermediate and radio-loud populations. While extended radio jets are observed in a similar manner for the control QSOs and red QSOs, they are overall very rare and would correspond to a small fraction of sources which are sufficiently powerful to pierce quickly through the (clumpy) surrounding medium despite the denser environments. This would mean that the early evolution of compact radio jets in QSOs would either be truncated by the dense medium and remain compact (such as most red QSOs even in the radio-loud regime), or grow without much interaction but disappear as it evolves within/shortly after surpassing galactic scales (such as the control QSOs), while a small minority would evolve into a ‘jetted’, radio-loud object. Scenario (c) can be also discussed in the evolutionary context described in (b). In red QSOs, the proposed compact jets could expel dust and gas from the nuclear regions, reducing the dust and gas column density in the process of growth, till they become bluer, consistent with a blow-out phase.
5. Conclusions
In this paper we have presented a comprehensive study of the origin of the radio emission in SDSS QSOs, capitalizing on radio surveys of an unprecedented combination of sensitivity and sky coverage, as well as a consistent multiwavelength characterisation through SED modelling and spectral fitting. Our unique radio data set, in combination with the extensive multiwavelength study presented by Calistro Rivera et al. (2021) for the same sources, allow us to consistently investigate the physical connection between radio emission, dust reddening and the presence of outflows in a statistical sample of QSOs. Our main results are the following:
-
Using the deepest low-frequency radio maps to date, available for a subset of our sources, we find detection fractions up to 94% showing that the radio emission from QSOs is virtually ubiquitous.
-
Applying AGN-tailored IR-to-UV SED-fitting to isolate the host-galaxy and AGN contributions to the overall energetics, we find that the radio emission in > 76% of QSOs is consistent with originating from AGN processes rather than star formation at galactic scales.
-
Consistent with previous studies, we find that this AGN radio emission is enhanced for red QSOs as compared to the control sample, in particular at intermediate radio-loudness and at compact scales, unresolved by the resolution limit of our survey (< 6″).
-
Going beyond the colour-based classification, we find a continuous positive correlation between the radio detection fraction and the accretion disc reddening parameter E(B − V)BBB in QSOs, in agreement with previous results (Fawcett et al. 2023). This finding suggests that the production of radio emission is likely physically connected to the dust attenuation at circumnuclear scales, and is an intrinsic property in QSOs.
-
We find that the [O III] and C IV outflow velocities generally increase when QSOs have red colours (CR21). We find that the [O III] wind velocities are significantly larger for red QSOs at intermediate radio-loudness, whereas for the control QSO sample no differences are observed with respect to radio loudness. No differences are observed for the C IV emission with respect to radio properties in either the red or control samples.
-
We find that faint and compact radio sources dominate the morphologies of the overall population of QSOs, although marginally resolved and extended sources are also detected in all bins of radio-loudness. The radio emission in red QSOs, however, is mainly compact also in radio-loud sources, whereas radio-loud control QSOs are predominantly extended or marginally resolved.
While we cannot rule out other scenarios, our results are consistent with a picture where small-scale jets are a ubiquitous phase in QSOs (see also Jarvis et al. 2019; Hartley et al. 2019; Macfarlane et al. 2021), and that they represent a key part of the evolutionary path of QSOs. We propose that the radio emission in most QSOs arise mainly from a superposition of compact radio jets and their interaction with the environment, which produce additional radio emission from jet-induced shocks. The increased incidence of jet-induced outflows and shocks in redder QSOs would, in turn, produce both the radio emission observed to gradually increase as a function of reddening, as well as the stronger [O III] kinematics.
If the ubiquitousness of compact radio jets is confirmed in new-generation deep radio surveys, this would represent a crucial aspect to consider in our understanding of quasar feedback in galaxy evolution (e.g. Thomas et al. 2021). Indeed, small-scale jets are suggested to have a larger impact on galaxy growth than their large-scale counterparts, heating and inducing turbulence in the surrounding ISM more efficiently, and therefore suppressing the star formation capabilities of the ISM. (e.g. Mukherjee et al. 2018; Cielo et al. 2018; Girdhar et al. 2022). Further studies are necessary to confirm this model and fully understand the connection between radio emission, dust reddening and outflows in QSOs. In particular, one limitation of our study was the restricted availability and moderate quality of SDSS spectra. Therefore, larger studies of spectral properties will be insightful to better characterise outflows in statistical QSO samples. Ongoing programs, such as WEAVE-LOFAR (Smith et al. 2016) will provide large new samples of radio-detected QSOs in the near future. Radio SED curvature and spectral analysis (Fawcett et al., in prep.; Sargent et al., in prep.), as well as high-resolution sub-arcsecond imaging of these sources (e.g. LOFAR LBA, VLBI observations) will furthermore inform us on the origin of the radio emission by estimating the time scales of the emission and resolving the scales at which it is produced.
We note that to obtain these spectral properties in Rakshit et al. (2020), a double Gaussian model was used to represent the [OIII] emission line; one for the core narrow component and another for the wing component, to characterise potential winds. In this paper we use the widths of the wing component to characterise the wind velocities. In the case of CIV the total profile was used without the subtraction of a narrow component, because of the ambiguity in the presence of narrow components in these lines. A detailed description of the spectral fitting can be found in Rakshit et al. (2020).
Acknowledgments
We would like to thank the anonymous referee for their insightful comments and suggestions which have considerably improved the manuscript. GCR acknowledges the ESO Fellowship Program and a Gruber Foundation Fellowship grant sponsored by the Gruber Foundation and the International Astronomical Union. DMA thanks the Science Technology Facilities Council (STFC) for support from the Durham consolidated grant (ST/T000244/1). CMH and VAF acknowledge funding from an United Kingdom Research and Innovation grant (code: MR/V022830/1). PNB, RK and BY are grateful for support from the UK STFC via grant ST/V000594/1. DJBS acknowledges support from the UK Science and Technology Facilities Council (STFC) under grant ST/V000624/1. MIA acknowledges support from the UK Science and Technology Facilities Council (STFC) studentship under the grant ST/C005460/1. LKM is grateful for support from UKRI [MR/T042842/1]. IP acknowledges support from INAF under the Large Grant 2022 funding scheme (project “MeerKAT and LOFAR Team up: a Unique Radio Window on Galaxy/AGN co-Evolution”).
References
- Alexander, D. M., & Hickox, R. C. 2012, New Astron. Rev., 56, 93 [Google Scholar]
- An, T., & Baan, W. A. 2012, ApJ, 760, 77 [Google Scholar]
- Andonie, C., Alexander, D. M., Greenwell, C., et al. 2024, MNRAS, 527, L144 [Google Scholar]
- Antonucci, R. 1993, ARA&A, 31, 473 [Google Scholar]
- Arnaudova, M. I., Smith, D. J. B., Hardcastle, M. J., et al. 2024, MNRAS, 528, 4547 [NASA ADS] [CrossRef] [Google Scholar]
- Baldi, R. D., Williams, D. R. A., Beswick, R. J., et al. 2021, MNRAS, 508, 2019 [NASA ADS] [CrossRef] [Google Scholar]
- Banerji, M., Alaghband-Zadeh, S., Hewett, P. C., & McMahon, R. G. 2015, MNRAS, 447, 3368 [Google Scholar]
- Barthel, P. D., & Arnaud, K. A. 1996, MNRAS, 283, L45 [NASA ADS] [CrossRef] [Google Scholar]
- Bell, E. F. 2003, ApJ, 586, 794 [Google Scholar]
- Best, P. N., Kondapally, R., Williams, W. L., et al. 2023, MNRAS, 523, 1729 [NASA ADS] [CrossRef] [Google Scholar]
- Bicknell, G. V., Mukherjee, D., Wagner, A. Y., Sutherland, R. S., & Nesvadba, N. P. H. 2018, MNRAS, 475, 3493 [NASA ADS] [CrossRef] [Google Scholar]
- Bischetti, M., Piconcelli, E., Vietri, G., et al. 2017, A&A, 598, A122 [NASA ADS] [CrossRef] [EDP Sciences] [Google Scholar]
- Bonzini, M., Mainieri, V., Padovani, P., et al. 2015, MNRAS, 453, 1079 [Google Scholar]
- Bruzual, G., & Charlot, S. 2003, MNRAS, 344, 1000 [NASA ADS] [CrossRef] [Google Scholar]
- Calistro Rivera, G., Lusso, E., Hennawi, J. F., & Hogg, D. W. 2016, ApJ, 833, 98 [Google Scholar]
- Calistro Rivera, G., Williams, W. L., Hardcastle, M. J., et al. 2017, MNRAS, 469, 3468 [Google Scholar]
- Calistro Rivera, G., Alexander, D. M., Rosario, D. J., et al. 2021, A&A, 649, A102 [NASA ADS] [CrossRef] [EDP Sciences] [Google Scholar]
- Cameron, E. 2011, PASA, 28, 128 [Google Scholar]
- Chen, S., Laor, A., Behar, E., Baldi, R. D., & Gelfand, J. D. 2023, MNRAS, 525, 164 [Google Scholar]
- Cielo, S., Bieri, R., Volonteri, M., Wagner, A. Y., & Dubois, Y. 2018, MNRAS, 477, 1336 [NASA ADS] [CrossRef] [Google Scholar]
- Circosta, C., Vignali, C., Gilli, R., et al. 2019, A&A, 623, A172 [NASA ADS] [CrossRef] [EDP Sciences] [Google Scholar]
- Costa, T., Rosdahl, J., Sijacki, D., & Haehnelt, M. G. 2018, MNRAS, 473, 4197 [Google Scholar]
- Croton, D. J., Springel, V., White, S. D. M., et al. 2006, MNRAS, 365, 11 [Google Scholar]
- Das, S., Smith, D. J. B., Haskell, P., et al. 2024, MNRAS, 531, 977 [NASA ADS] [CrossRef] [Google Scholar]
- DiPompeo, M. A., Hickox, R. C., Carroll, C. M., et al. 2018, ApJ, 856, 76 [Google Scholar]
- Driver, S. P., Hill, D. T., Kelvin, L. S., et al. 2011, MNRAS, 413, 971 [Google Scholar]
- Fabian, A. C. 2012, ARA&A, 50, 455 [Google Scholar]
- Fawcett, V. A., Alexander, D. M., Rosario, D. J., et al. 2020, MNRAS, 494, 4802 [Google Scholar]
- Fawcett, V. A., Alexander, D. M., Rosario, D. J., & Klindt, L. 2021, Galaxies, 9, 107 [NASA ADS] [CrossRef] [Google Scholar]
- Fawcett, V. A., Alexander, D. M., Rosario, D. J., et al. 2022, MNRAS, 513, 1254 [NASA ADS] [CrossRef] [Google Scholar]
- Fawcett, V. A., Alexander, D. M., Brodzeller, A., et al. 2023, MNRAS, 525, 5575 [CrossRef] [Google Scholar]
- Girdhar, A., Harrison, C. M., Mainieri, V., et al. 2022, MNRAS, 512, 1608 [NASA ADS] [CrossRef] [Google Scholar]
- Glikman, E., Urrutia, T., Lacy, M., et al. 2012, ApJ, 757, 51 [Google Scholar]
- Glikman, E., Urrutia, T., Lacy, M., et al. 2013, ApJ, 778, 127 [Google Scholar]
- Glikman, E., Lacy, M., LaMassa, S., et al. 2022, ApJ, 934, 119 [NASA ADS] [CrossRef] [Google Scholar]
- Gürkan, G., Hardcastle, M. J., Smith, D. J. B., et al. 2018, MNRAS, 475, 3010 [Google Scholar]
- Gürkan, G., Hardcastle, M. J., Best, P. N., et al. 2019, A&A, 622, A11 [NASA ADS] [CrossRef] [EDP Sciences] [Google Scholar]
- Hamann, F., Zakamska, N. L., Ross, N., et al. 2017, MNRAS, 464, 3431 [Google Scholar]
- Hardcastle, M. J., & Croston, J. H. 2020, New Astron. Rev., 88, 101539 [Google Scholar]
- Harrison, C. M., Costa, T., Tadhunter, C. N., et al. 2018, Nat. Astron., 2, 198 [Google Scholar]
- Hartley, P., Jackson, N., Sluse, D., Stacey, H. R., & Vives-Arias, H. 2019, MNRAS, 485, 3009 [Google Scholar]
- Helou, G., Soifer, B., & Rowan-Robinson, M. 1985, ApJ, 298, L7 [NASA ADS] [CrossRef] [Google Scholar]
- Hönig, S. F., & Kishimoto, M. 2017, ApJ, 838, L20 [Google Scholar]
- Hopkins, P. F., Strauss, M. A., Hall, P. B., et al. 2004, AJ, 128, 1112 [Google Scholar]
- Hopkins, P. F., Hernquist, L., Cox, T. J., & Kereš, D. 2008, ApJS, 175, 356 [Google Scholar]
- Hwang, H.-C., Zakamska, N. L., Alexandroff, R. M., et al. 2018, MNRAS, 477, 830 [CrossRef] [Google Scholar]
- Jarvis, M. E., Harrison, C. M., Thomson, A. P., et al. 2019, MNRAS, 485, 2710 [Google Scholar]
- Jarvis, M. E., Harrison, C. M., Mainieri, V., et al. 2021, MNRAS, 503, 1780 [NASA ADS] [CrossRef] [Google Scholar]
- Kellermann, K. I., Sramek, R., Schmidt, M., Shaffer, D. B., & Green, R. 1989, AJ, 98, 1195 [Google Scholar]
- Klindt, L., Alexander, D. M., Rosario, D. J., Lusso, E., & Fotopoulou, S. 2019, MNRAS, 488, 3109 [Google Scholar]
- Kondapally, R., Best, P. N., Hardcastle, M. J., et al. 2021, A&A, 648, A3 [EDP Sciences] [Google Scholar]
- Kukreti, P., Morganti, R., Tadhunter, C., & Santoro, F. 2023, A&A, 674, A198 [NASA ADS] [CrossRef] [EDP Sciences] [Google Scholar]
- Laor, A., & Behar, E. 2008, MNRAS, 390, 847 [NASA ADS] [CrossRef] [Google Scholar]
- Lyu, J., & Rieke, G. H. 2018, ApJ, 866, 92 [Google Scholar]
- Macfarlane, C., Best, P. N., Sabater, J., et al. 2021, MNRAS, 506, 5888 [NASA ADS] [CrossRef] [Google Scholar]
- Martínez-Ramírez, L. N., Calistro Rivera, G., Lusso, E., et al. 2024, A&A, 688, A46 [NASA ADS] [CrossRef] [EDP Sciences] [Google Scholar]
- McCheyne, I., Oliver, S., Sargent, M., et al. 2022, A&A, 662, A100 [NASA ADS] [CrossRef] [EDP Sciences] [Google Scholar]
- Mehdipour, M., & Costantini, E. 2018, A&A, 619, A20 [NASA ADS] [CrossRef] [EDP Sciences] [Google Scholar]
- Mizumoto, M., Sameshima, H., Kobayashi, N., et al. 2023, ArXiv e-prints [arXiv:2311.13085] [Google Scholar]
- Mohan, N., & Rafferty, D. 2015, Astrophysics Source Code Library [record ascl:1502.007] [Google Scholar]
- Molyneux, S. J., Harrison, C. M., & Jarvis, M. E. 2019, A&A, 631, A132 [NASA ADS] [CrossRef] [EDP Sciences] [Google Scholar]
- Mukherjee, D., Bicknell, G. V., Wagner, A. Y., Sutherland, R. S., & Silk, J. 2018, MNRAS, 479, 5544 [NASA ADS] [CrossRef] [Google Scholar]
- Mullaney, J. R., Alexander, D. M., Fine, S., et al. 2013, MNRAS, 433, 622 [Google Scholar]
- Nims, J., Quataert, E., & Faucher-Giguère, C.-A. 2015, MNRAS, 447, 3612 [NASA ADS] [CrossRef] [Google Scholar]
- Norris, R. P., Afonso, J., Bacon, D., et al. 2013, PASA, 30, e020 [NASA ADS] [CrossRef] [Google Scholar]
- Oei, M. S. S. L., Hardcastle, M. J., Timmerman, R., et al. 2024, Nature, 633, 537 [NASA ADS] [CrossRef] [Google Scholar]
- Padovani, P. 2016, A&ARv, 24, 13 [Google Scholar]
- Panessa, F., Baldi, R. D., Laor, A., et al. 2019, Nat. Astron., 3, 387 [Google Scholar]
- Pâris, I., Petitjean, P., Aubourg, É., et al. 2018, A&A, 613, A51 [Google Scholar]
- Perrotta, S., Hamann, F., Zakamska, N. L., et al. 2019, MNRAS, 488, 4126 [Google Scholar]
- Petley, J. W., Morabito, L. K., Rankine, A. L., et al. 2024, MNRAS, 529, 1995 [NASA ADS] [CrossRef] [Google Scholar]
- Prevot, M. L., Lequeux, J., Prevot, L., Maurice, E., & Rocca-Volmerange, B. 1984, A&A, 132, 389 [Google Scholar]
- Rakshit, S., Stalin, C. S., & Kotilainen, J. 2020, ApJS, 249, 17 [Google Scholar]
- Rankine, A. L., Matthews, J. H., Hewett, P. C., et al. 2021, MNRAS, 502, 4154 [CrossRef] [Google Scholar]
- Ricci, C., Trakhtenbrot, B., Koss, M. J., et al. 2017, Nature, 549, 488 [NASA ADS] [CrossRef] [Google Scholar]
- Richards, G. T., Lacy, M., Storrie-Lombardi, L. J., et al. 2006, ApJS, 166, 470 [Google Scholar]
- Rojas, A. F., Sani, E., Gavignaud, I., et al. 2020, MNRAS, 491, 5867 [Google Scholar]
- Rosario, D. J., Fawcett, V. A., Klindt, L., et al. 2020, MNRAS, 494, 3061 [Google Scholar]
- Rosario, D. J., Alexander, D. M., Moldon, J., et al. 2021, MNRAS, 505, 5283 [NASA ADS] [CrossRef] [Google Scholar]
- Sabater, J., Best, P. N., Tasse, C., et al. 2021, A&A, 648, A2 [EDP Sciences] [Google Scholar]
- Sandage, A. 1965, ApJ, 141, 1560 [NASA ADS] [CrossRef] [Google Scholar]
- Sanders, D. B., Soifer, B. T., Elias, J. H., et al. 1988, ApJ, 325, 74 [Google Scholar]
- Santoro, F., Tadhunter, C., Baron, D., Morganti, R., & Holt, J. 2020, A&A, 644, A54 [NASA ADS] [CrossRef] [EDP Sciences] [Google Scholar]
- Schmidt, M. 1963, Nature, 197, 1040 [Google Scholar]
- Schreiber, C., Elbaz, D., Pannella, M., et al. 2018, A&A, 609, A30 [NASA ADS] [CrossRef] [EDP Sciences] [Google Scholar]
- Shirley, R., Roehlly, Y., Hurley, P. D., et al. 2019, MNRAS, 490, 634 [Google Scholar]
- Silva, L., Maiolino, R., & Granato, G. L. 2004, MNRAS, 355, 973 [Google Scholar]
- Smith, D. J. B., Best, P. N., Duncan, K. J., et al. 2016, in SF2A-2016: Proceedings of the Annual meeting of the French Society of Astronomy and Astrophysics, eds. C. Reylé, J. Richard, L. Cambrésy, et al., 271 [Google Scholar]
- Smith, D. J. B., Haskell, P., Gürkan, G., et al. 2021, A&A, 648, A6 [EDP Sciences] [Google Scholar]
- Soliman, N. H., & Hopkins, P. F. 2023, MNRAS, 525, 2668 [NASA ADS] [CrossRef] [Google Scholar]
- Stacey, H. R., Costa, T., McKean, J. P., et al. 2022, MNRAS, 517, 3377 [NASA ADS] [CrossRef] [Google Scholar]
- Stalevski, M., Tristram, K. R. W., & Asmus, D. 2019, MNRAS, 484, 3334 [NASA ADS] [CrossRef] [Google Scholar]
- Tasse, C., Shimwell, T., Hardcastle, M. J., et al. 2021, A&A, 648, A1 [EDP Sciences] [Google Scholar]
- Temple, M. J., Banerji, M., Hewett, P. C., et al. 2019, MNRAS, 487, 2594 [Google Scholar]
- Thomas, N., Davé, R., Jarvis, M. J., & Anglés-Alcázar, D. 2021, MNRAS, 503, 3492 [NASA ADS] [CrossRef] [Google Scholar]
- Urrutia, T., Lacy, M., Gregg, M. D., & Becker, R. H. 2005, ApJ, 627, 75 [Google Scholar]
- van Haarlem, M. P., Wise, M. W., Gunst, A. W., et al. 2013, A&A, 556, A2 [NASA ADS] [CrossRef] [EDP Sciences] [Google Scholar]
- Villar Martín, M., Perna, M., Humphrey, A., et al. 2020, A&A, 634, A116 [NASA ADS] [CrossRef] [EDP Sciences] [Google Scholar]
- Wang, Y., Shang, Z., & Brotherton, M. S. 2022, MNRAS, 514, 1595 [NASA ADS] [CrossRef] [Google Scholar]
- Woo, J.-H., Son, D., & Bae, H.-J. 2017, ApJ, 839, 120 [Google Scholar]
- Wright, E. L., Eisenhardt, P. R. M., Mainzer, A. K., et al. 2010, AJ, 140, 1868 [Google Scholar]
- Yue, B. H., Best, P. N., Duncan, K. J., et al. 2024, MNRAS, 529, 3939 [NASA ADS] [CrossRef] [Google Scholar]
- Zakamska, N. L., & Greene, J. E. 2014, MNRAS, 442, 784 [Google Scholar]
- Zakamska, N. L., Lampayan, K., Petric, A., et al. 2016, MNRAS, 455, 4191 [Google Scholar]
All Tables
All Figures
|
Fig. 1. Radio and multiwavelength data used in this paper. The upper panel shows the sky coverage of the LOFAR pointings (cyan area) in the 3 LoTSS Deep Fields DR1 (upper sub-panel) and the GAMA survey fields (lower sub-panel). The sky areas with deep multiwavelength coverage are overplotted (grey stars). The lower panel show the rms sensitivities and sky coverage of the LOFAR data used in this work, i.e. the LoTSS Deep Fields and the LOFAR GAMA Fields, compared to other past and future radio surveys. To enable the comparison, all survey depths are converted to a 1.4 GHz equivalent rms assuming a spectral index of α = 0.7. |
| In the text | |
|
Fig. 2. Distributions of 6 μm luminosities (L6 μm, left panel) and radio loudness R150 (right panel), for all SDSS QSOs from the ALLQSO sample. The parent sample of red and control QSOs are shown as red and blue shaded areas, respectively, whereas the subsample of control QSOs matched in z and L6 μm to the red QSOs are shown by the dark blue unfilled histogram. |
| In the text | |
|
Fig. 3. Luminosities at 150 MHz as a function of redshift for SDSS QSOs detected at 3σ by LOFAR (ALLQSOs sample). LOFAR detections in the total SDSS sample are represented in the central panel as red and blue markers, for red QSOs and control QSOs, respectively. The thick grey line shows the radio luminosity expected from a SFR of 100 M⊙ year−1 and the thin grey lines represent the sensitivity levels for the different fields as described in the legend. The upper and side panels show the one-dimensional distributions for the redshifts and 150 MHz luminosities, respectively. The red and blue filled histograms represent the red QSOs and control QSOs respectively, and the dark blue unfilled histogram shows the Lz-matched sample of control QSOs. The distribution of the luminosities at 6 μm for this sample is shown in a similar manner in Figure 2. |
| In the text | |
|
Fig. 4. Radio detection fraction at 3σ of the ALLQSOSs sample in the combined LOFAR fields, as a function of radio loudness. Red QSOs and control samples are matched in L6 μm and z. Radio loudness was estimated for the sources without detections using measured radio fluxes at the QSO position. These upper limits are included in this plots and dominate the lower bins of the radio faint regime. Consistent with previous studies, the detection fraction of red QSOs (red line), is significantly higher than the control sample (blue) in particular in the regime of intermediate radio loudness (−5.5 < R150 < −4.5). The shaded areas represent 1σ binomial uncertainties for each bin following Cameron (2011). |
| In the text | |
|
Fig. 5. Fraction of sources of a given radio morphology (faint, compact, medium, and extended) within each bin of radio loudness. Thumbnails of the LOFAR images are shown in the upper panel to exemplify the morphological classes used here, where two circles are depicted at 3″ (dashed line) and 10″ (solid line). The bars in the lower panel include all morphology classes (each denoted by a single letter). Only ALLQSOs from the LoTSS Deep Fields catalogue (northern fields) were used here due to their depth and better resolution (6″). Error bars represent 1σ binomial uncertainties. |
| In the text | |
|
Fig. 6. Radio loudness R150 for the MWQSO sample, as a function of the qIRC-value, which parametrises the IR-radio correlation. The central panel shows the posterior median values for red QSOs and the control sample. The upper panel shows the combined distribution of the qIRC posteriors (100 realizations per source) for the two samples, obtained from the Bayesian SED fitting. The grey shaded area represents the value of qIRC found by Calistro Rivera et al. (2017) for star forming galaxies at 150 MHz qIRC − 150 MHz = 1.54 with a scatter of 0.5. The right panel shows the combined distribution of the R150 values for the two samples. |
| In the text | |
|
Fig. 7. AGN contribution fraction to the radio emission of QSOs at 150 MHz, as a function of radio luminosity L150 (for the MWQSO sample). The grey dots show the AGN fraction of the L150 for each source, i.e. the fraction which is in excess from the SF relation accounting for the scatter. The dark cyan line and shaded area represent the percentage of the overall population which have AGN fractions larger than 50%, i.e. are dominated by the AGN. The shaded dark area around the line shows 1-σ binning uncertainties. |
| In the text | |
|
Fig. 8. Radio detection fraction of QSOs at 150 MHz as a function of the accretion-disc reddening in the MWQSO sample. The accretion-disc reddening is estimated from the SED fitting for each source and is parametrised by the E(B − V)BBB parameter. The solid line shows the trend considering only catalogued sources (≳5σ), whereas the dashed line considers all QSOs detected down to ∼3σ. The shaded area represent 1σ binomial uncertainties for each bin. A clear positive relation is apparent, where the radio detection fraction increments with increasing dust-reddening, in agreement with QSOs detected in the DESI survey (black circles). |
| In the text | |
|
Fig. 9. Cumulative distributions of the [O III] and C IV velocities (upper and lower panel, respectively). The [O III] velocities are parametrised by the FWHMs for the wing component of the [O III] emission line, and the C IV velocities are paremetrised by the velocity blueshifts of the C IV emission lines. Red and blue lines represent the distributions for the red and control QSOs, respectively. The left to right panels show the distributions for radio-faint, radio-intermediate and radio-loud subsamples. Solid lines are the distributions of radio detected QSOs within each bin of radio-loudness, while the distributions of undetected sources are shown as dotted lines for reference. Here we use the ALLQSOs sample at the redshifts required to cover the respective emission line within the SDSS spectral window (z < 1 for the [O III] line, and 1.4 < z < 2.5 for C IV). Additionally, a luminosity threshold from our parent sample was applied to avoid contamination from the host galaxy, as well as a S/N criterion to ensure high quality detections of the [O III] wing components. |
| In the text | |
Current usage metrics show cumulative count of Article Views (full-text article views including HTML views, PDF and ePub downloads, according to the available data) and Abstracts Views on Vision4Press platform.
Data correspond to usage on the plateform after 2015. The current usage metrics is available 48-96 hours after online publication and is updated daily on week days.
Initial download of the metrics may take a while.