Fig. 7.
Download original image
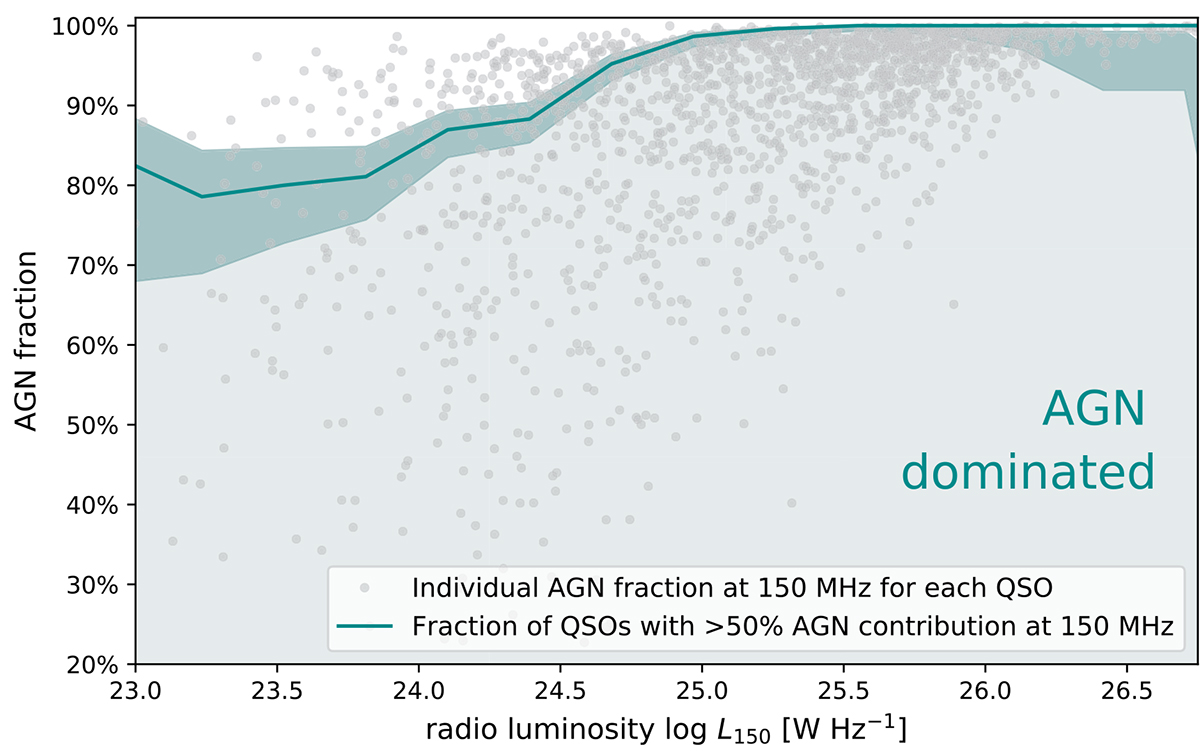
AGN contribution fraction to the radio emission of QSOs at 150 MHz, as a function of radio luminosity L150 (for the MWQSO sample). The grey dots show the AGN fraction of the L150 for each source, i.e. the fraction which is in excess from the SF relation accounting for the scatter. The dark cyan line and shaded area represent the percentage of the overall population which have AGN fractions larger than 50%, i.e. are dominated by the AGN. The shaded dark area around the line shows 1-σ binning uncertainties.
Current usage metrics show cumulative count of Article Views (full-text article views including HTML views, PDF and ePub downloads, according to the available data) and Abstracts Views on Vision4Press platform.
Data correspond to usage on the plateform after 2015. The current usage metrics is available 48-96 hours after online publication and is updated daily on week days.
Initial download of the metrics may take a while.