Fig. 8.
Download original image
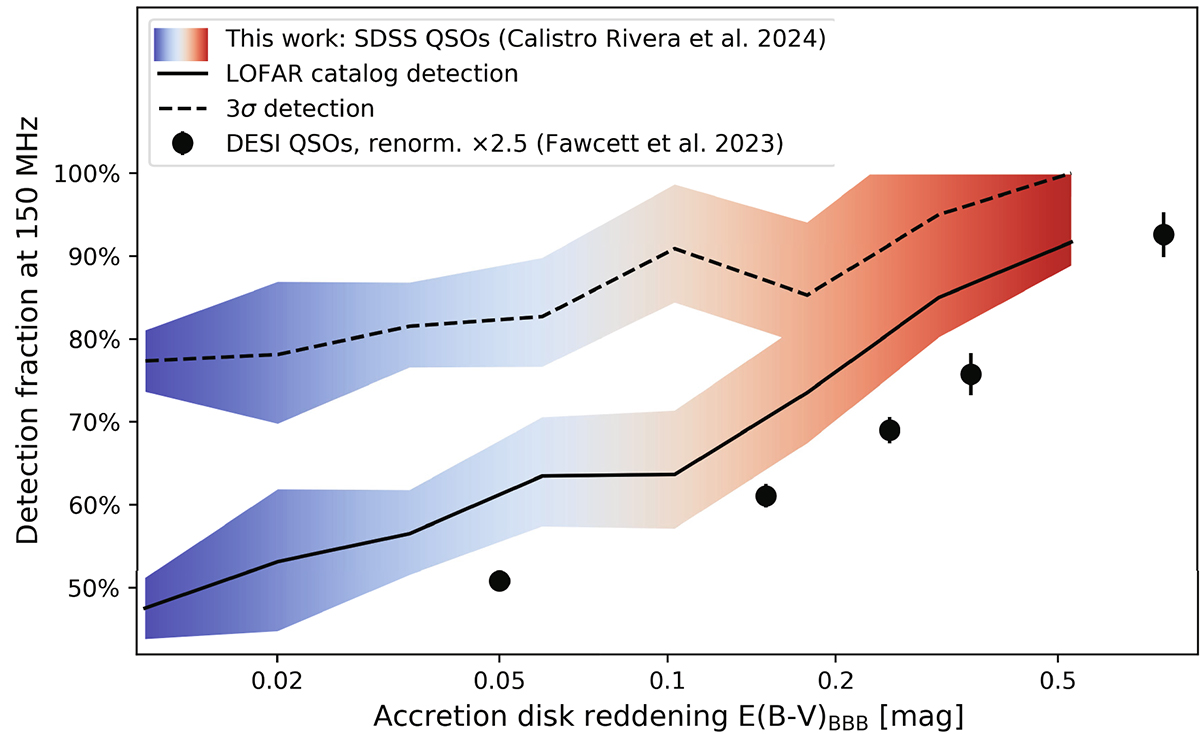
Radio detection fraction of QSOs at 150 MHz as a function of the accretion-disc reddening in the MWQSO sample. The accretion-disc reddening is estimated from the SED fitting for each source and is parametrised by the E(B − V)BBB parameter. The solid line shows the trend considering only catalogued sources (≳5σ), whereas the dashed line considers all QSOs detected down to ∼3σ. The shaded area represent 1σ binomial uncertainties for each bin. A clear positive relation is apparent, where the radio detection fraction increments with increasing dust-reddening, in agreement with QSOs detected in the DESI survey (black circles).
Current usage metrics show cumulative count of Article Views (full-text article views including HTML views, PDF and ePub downloads, according to the available data) and Abstracts Views on Vision4Press platform.
Data correspond to usage on the plateform after 2015. The current usage metrics is available 48-96 hours after online publication and is updated daily on week days.
Initial download of the metrics may take a while.