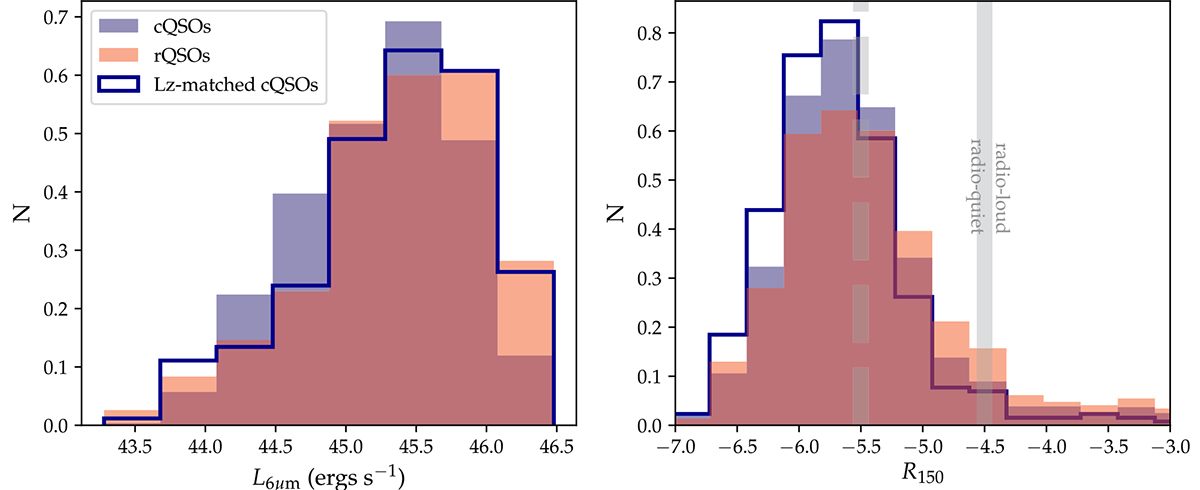
Fig. 2.
Download original image
Distributions of 6 μm luminosities (L6 μm, left panel) and radio loudness R150 (right panel), for all SDSS QSOs from the ALLQSO sample. The parent sample of red and control QSOs are shown as red and blue shaded areas, respectively, whereas the subsample of control QSOs matched in z and L6 μm to the red QSOs are shown by the dark blue unfilled histogram.
Current usage metrics show cumulative count of Article Views (full-text article views including HTML views, PDF and ePub downloads, according to the available data) and Abstracts Views on Vision4Press platform.
Data correspond to usage on the plateform after 2015. The current usage metrics is available 48-96 hours after online publication and is updated daily on week days.
Initial download of the metrics may take a while.