Fig. 4.
Download original image
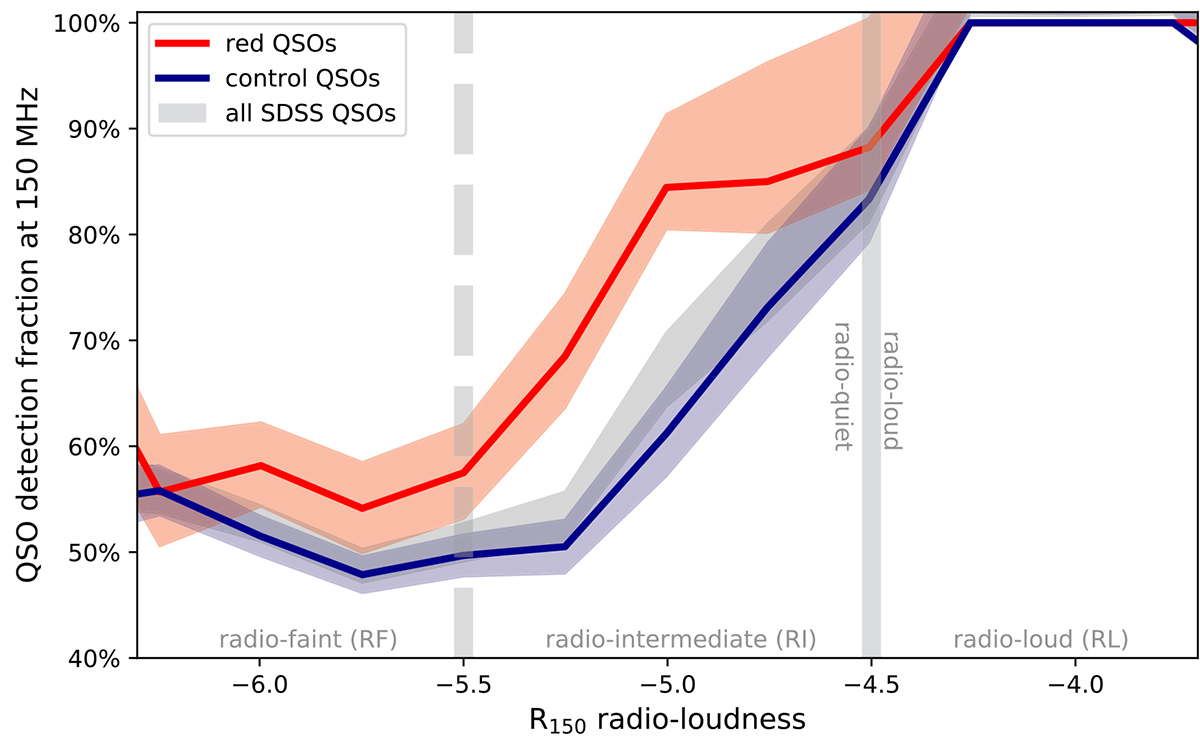
Radio detection fraction at 3σ of the ALLQSOSs sample in the combined LOFAR fields, as a function of radio loudness. Red QSOs and control samples are matched in L6 μm and z. Radio loudness was estimated for the sources without detections using measured radio fluxes at the QSO position. These upper limits are included in this plots and dominate the lower bins of the radio faint regime. Consistent with previous studies, the detection fraction of red QSOs (red line), is significantly higher than the control sample (blue) in particular in the regime of intermediate radio loudness (−5.5 < R150 < −4.5). The shaded areas represent 1σ binomial uncertainties for each bin following Cameron (2011).
Current usage metrics show cumulative count of Article Views (full-text article views including HTML views, PDF and ePub downloads, according to the available data) and Abstracts Views on Vision4Press platform.
Data correspond to usage on the plateform after 2015. The current usage metrics is available 48-96 hours after online publication and is updated daily on week days.
Initial download of the metrics may take a while.