Fig. 3.
Download original image
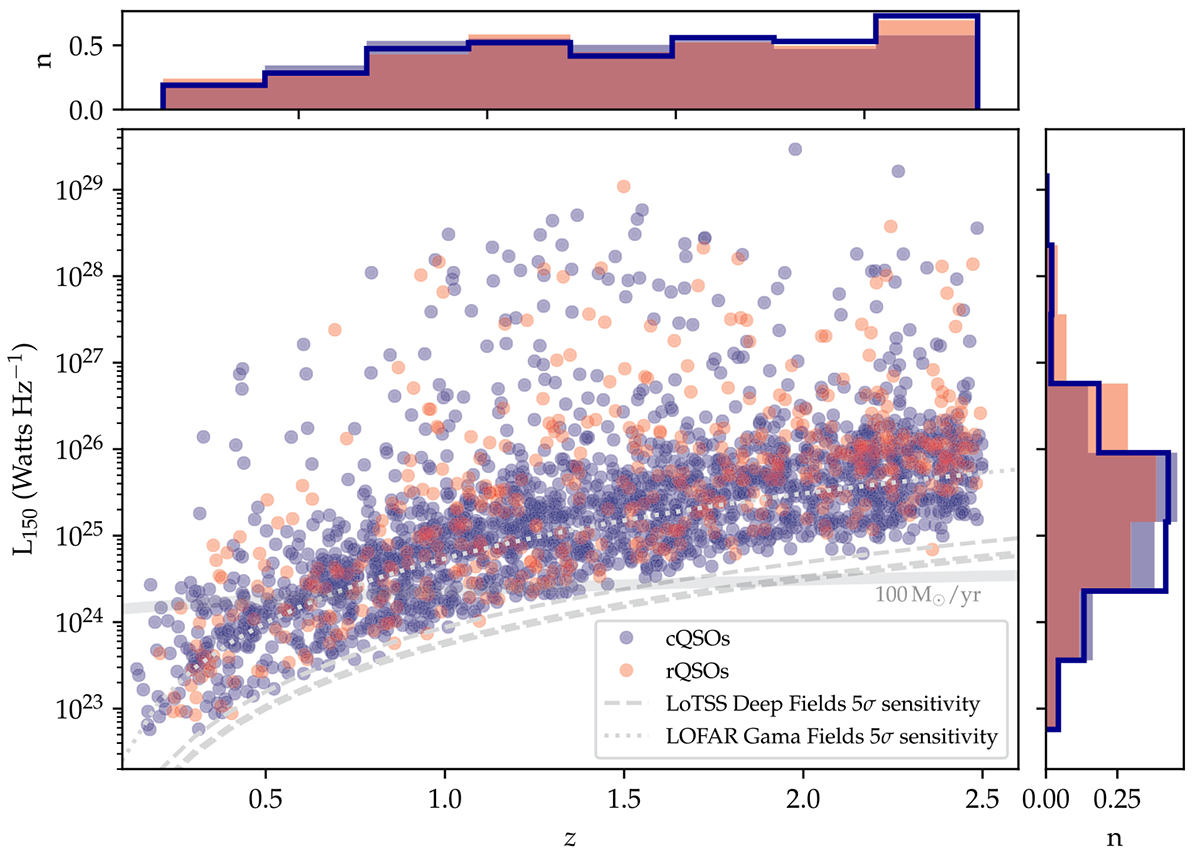
Luminosities at 150 MHz as a function of redshift for SDSS QSOs detected at 3σ by LOFAR (ALLQSOs sample). LOFAR detections in the total SDSS sample are represented in the central panel as red and blue markers, for red QSOs and control QSOs, respectively. The thick grey line shows the radio luminosity expected from a SFR of 100 M⊙ year−1 and the thin grey lines represent the sensitivity levels for the different fields as described in the legend. The upper and side panels show the one-dimensional distributions for the redshifts and 150 MHz luminosities, respectively. The red and blue filled histograms represent the red QSOs and control QSOs respectively, and the dark blue unfilled histogram shows the Lz-matched sample of control QSOs. The distribution of the luminosities at 6 μm for this sample is shown in a similar manner in Figure 2.
Current usage metrics show cumulative count of Article Views (full-text article views including HTML views, PDF and ePub downloads, according to the available data) and Abstracts Views on Vision4Press platform.
Data correspond to usage on the plateform after 2015. The current usage metrics is available 48-96 hours after online publication and is updated daily on week days.
Initial download of the metrics may take a while.