Fig. 6.
Download original image
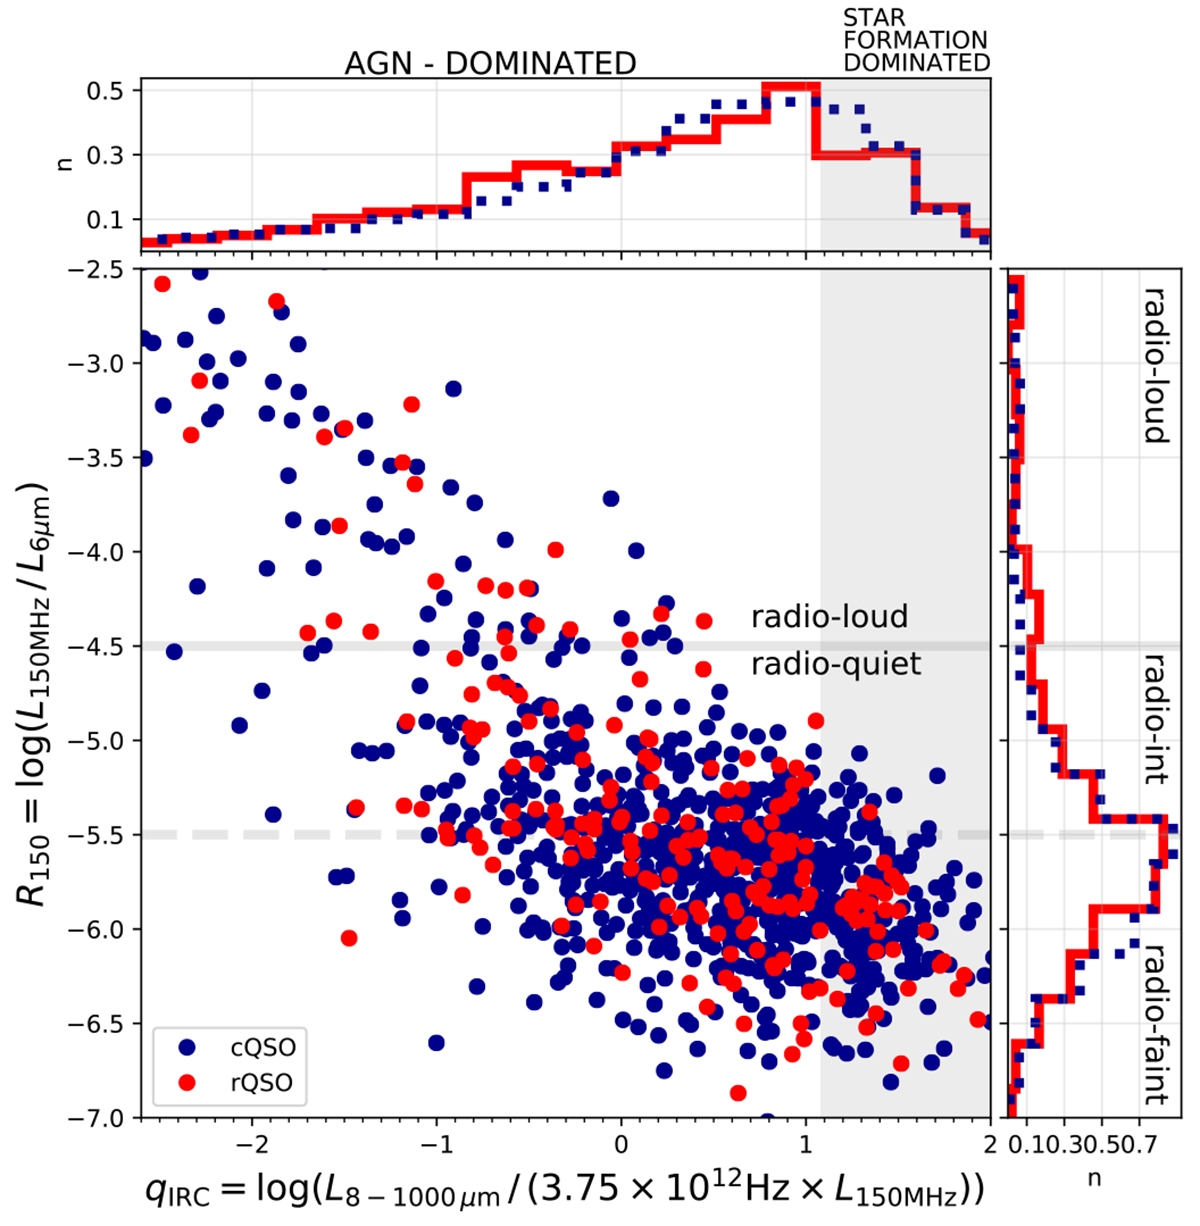
Radio loudness R150 for the MWQSO sample, as a function of the qIRC-value, which parametrises the IR-radio correlation. The central panel shows the posterior median values for red QSOs and the control sample. The upper panel shows the combined distribution of the qIRC posteriors (100 realizations per source) for the two samples, obtained from the Bayesian SED fitting. The grey shaded area represents the value of qIRC found by Calistro Rivera et al. (2017) for star forming galaxies at 150 MHz qIRC − 150 MHz = 1.54 with a scatter of 0.5. The right panel shows the combined distribution of the R150 values for the two samples.
Current usage metrics show cumulative count of Article Views (full-text article views including HTML views, PDF and ePub downloads, according to the available data) and Abstracts Views on Vision4Press platform.
Data correspond to usage on the plateform after 2015. The current usage metrics is available 48-96 hours after online publication and is updated daily on week days.
Initial download of the metrics may take a while.