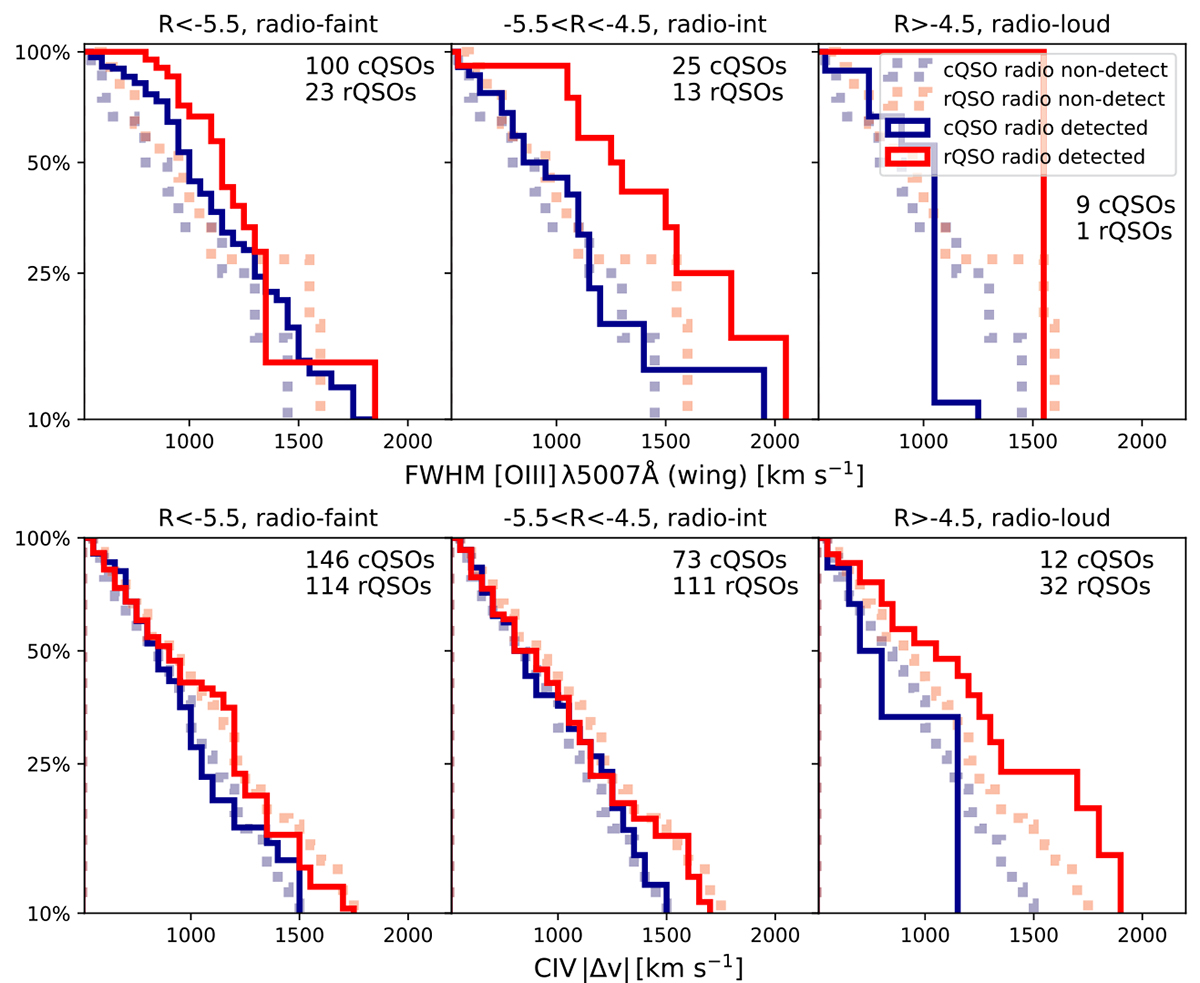
Fig. 9.
Download original image
Cumulative distributions of the [O III] and C IV velocities (upper and lower panel, respectively). The [O III] velocities are parametrised by the FWHMs for the wing component of the [O III] emission line, and the C IV velocities are paremetrised by the velocity blueshifts of the C IV emission lines. Red and blue lines represent the distributions for the red and control QSOs, respectively. The left to right panels show the distributions for radio-faint, radio-intermediate and radio-loud subsamples. Solid lines are the distributions of radio detected QSOs within each bin of radio-loudness, while the distributions of undetected sources are shown as dotted lines for reference. Here we use the ALLQSOs sample at the redshifts required to cover the respective emission line within the SDSS spectral window (z < 1 for the [O III] line, and 1.4 < z < 2.5 for C IV). Additionally, a luminosity threshold from our parent sample was applied to avoid contamination from the host galaxy, as well as a S/N criterion to ensure high quality detections of the [O III] wing components.
Current usage metrics show cumulative count of Article Views (full-text article views including HTML views, PDF and ePub downloads, according to the available data) and Abstracts Views on Vision4Press platform.
Data correspond to usage on the plateform after 2015. The current usage metrics is available 48-96 hours after online publication and is updated daily on week days.
Initial download of the metrics may take a while.