| Issue |
A&A
Volume 690, October 2024
|
|
|---|---|---|
| Article Number | A208 | |
| Number of page(s) | 15 | |
| Section | Galactic structure, stellar clusters and populations | |
| DOI | https://doi.org/10.1051/0004-6361/202450754 | |
| Published online | 08 October 2024 | |
(Re)mind the gap: A hiatus in star formation history unveiled by APOGEE DR17
1
I.N.A.F. Osservatorio Astronomico di Trieste,
via G.B. Tiepolo 11,
34131
Trieste,
Italy
2
Dipartimento di Fisica, Sezione di Astronomia, Università di Trieste,
Via G. B. Tiepolo 11,
34143
Trieste,
Italy
3
I.N.F.N. Sezione di Trieste,
via Valerio 2,
34134
Trieste,
Italy
4
I.N.A.F. Osservatorio Astronomico di Padova,
Vicolo dell’Osservatorio 5,
35122
Padova,
Italy
5
Leibniz-Institut für Astrophysik Potsdam,
An der Sternwarte 16,
14482
Potsdam,
Germany
★ Corresponding author; This email address is being protected from spambots. You need JavaScript enabled to view it.
Received:
17
May
2024
Accepted:
27
August
2024
Abstract
Context. Analysis of several spectroscopic surveys indicates the presence of a bimodality between the disc stars in the abundance ratio space of [α/Fe] versus [Fe/H]. The two stellar groups are commonly referred to as the high-α and low-α sequences. Some models capable of reproducing such a bimodality invoke the presence of a hiatus in the star formation history in our Galaxy, whereas other models explain the two sequences by means of stellar migration.
Aims. Our aim is to show that the existence of the gap in the star formation rate between high-α and low-α is evident in the stars of APOGEE DR17, if one plots [Fe/α] versus [α/H], confirming previous suggestions. We then try to interpret the data by means of detailed chemical models.
Methods. We compare the APOGEE DR17 red giant stars with the predictions of a detailed chemical evolution model based on the two-infall paradigm, taking into account also the possible accretion of dwarf satellites.
Results. The APOGEE DR17 abundance ratios [Fe/α] versus [α/H] exhibit a sharp increase in [Fe/α] at a nearly constant [α/H] (where α elements considered are Mg, Si, O) during the transition between the two disc phases. This observation strongly supports the hypothesis that a hiatus in star formation occurred during this evolutionary phase. Notably, the most pronounced growth in the [Fe/α] versus [α/H] relation is observed for oxygen, as this element is exclusively synthesised in core-collapse supernovae. The revised version of the two-infall chemical evolution model proposed in this study reproduces the APOGEE DR17 abundance ratios better than before. Particularly noteworthy is the model’s ability to predict the hiatus in the star formation between the two infalls of gas, which form the thick and thin disc, respectively, and thus generate abundance ratios compatible with APOGEE DR17 data.
Conclusions. We show that the signature of a hiatus in the star formation is imprinted in the APOGEE DR17 abundance ratios. A chemical model predicting a pause in the star formation of a duration of roughly 3.5 Gyr, and in which the high-α disc starts forming from pre-enriched gas by a previous encounter with a dwarf galaxy, could well explain the observations
Key words: ISM: abundances / Galaxy: abundances / Galaxy: disk / Galaxy: evolution / Galaxy: formation
© The Authors 2024
 Open Access article, published by EDP Sciences, under the terms of the Creative Commons Attribution License (https://creativecommons.org/licenses/by/4.0), which permits unrestricted use, distribution, and reproduction in any medium, provided the original work is properly cited.
This article is published in open access under the Subscribe to Open model. This email address is being protected from spambots. You need JavaScript enabled to view it. to support open access publication.
1 Introduction
Analysis of ground-based spectroscopic surveys, including the Galactic Archaeology with HERMES survey (GALAH; (Buder et al. 2021)), the Apache Point Observatory Galactic Evolution Experiment project (APOGEE, Nidever et al. 2015; Majewski et al. 2017; Ahumada et al. 2020; Abdurro’uf et al. 2022; Imig et al. 2023), the Gaia-ESO project (e.g. Recio-Blanco et al. 2014; Kordopatis et al. 2015; Rojas-Arriagada et al. 2016, 2017), and the AMBRE project (Mikolaitis et al. 2017; de Laverny et al. 2013) indicates the presence of two distinct sequences of disc stars in the abundance ratio space of [α/Fe] versus [Fe/H]. These sequences are commonly referred to as high-α and low-α. Recent confirmation of this separation has come from the space-based Gaia DR3 mission (Gaia Collaboration 2023) with the General Stellar – spectroscopy (GSP-Spec, Recio-Blanco et al. 2023) and with Gaia XP spectra (Chandra et al. 2024).
In our comprehension of the Milky Way (MW)’s evolutionary journey, our Galaxy does not exist in isolation, undergoing significant events of gas accretion from the intergalactic medium. Various theoretical models describing the evolution of Galactic discs propose a tight connection between bimodality and a delayed accretion episode involving pristine or metal-poor gas. Spitoni et al. (2019b, 2020, 2022) have demonstrated that a substantial delay of approximately 4 Gyr between two consecutive gas accretion episodes is necessary to account for the dichotomy observed in the local APOKASC sample (APOGEE+ Kepler Asteroseismology Science Consortium, Pinsonneault et al. 2014) within the solar neighbourhood (Silva Aguirre et al. 2018) and APOGEE DR16 stars.
Specifically, their predictions indicate that the star formation rate (SFR) reaches a minimum at an age of around 8 billion years after the beginning of star formation. A comparable suppression of star formation at the age of 8 Gyr was also identified by Snaith et al. (2015), utilising chemical abundances from Adibekyan et al. (2012) and isochrone ages from Haywood et al. (2013) for solar-type stars. Katz et al. (2021) conclude that APOGEE data exhibits a dilution of the interstellar medium from 6 kpc to the outskirts of the disc, occurring prior to the beginning of low-α formation. In the context of the two-infall model and the shock-heating theory, Noguchi (2018) also proposed a significant time gap between the two accretion phases. According to their model, an initial infall event leads to the formation of the high-α sequence, succeeded by a pause until the shock-heated gas in the Galactic dark matter halo undergoes radiative cooling and becomes available for accretion by the Galaxy. Within this framework, Noguchi (2018) determined that the SFR of the Galactic disc exhibits two distinct peaks with an approximate separation of 5 billion years.
Through the analysis of ESO/HARPS spectra from local solar twin stars, Nissen et al. (2020) identified a distinct age-metallicity distribution with two populations, suggesting evidence for two episodes of gas accretion onto the Galactic disc with an interceding quenching of star formation, similar to the scenario proposed by Spitoni et al. (2019b, 2020) but also taking into account enriched infalling gas. Also, the recent AMBRE:HARPS data were reproduced by Palla et al. (2022) using a chemical evolution model characterised by a two-infall scenario with a significant delay (3.25 Gyr) between the accretion episodes.
Subgiant stars analysed by Xiang & Rix (2022) with the Large Sky Area Multi-Object Fibre Spectroscopic Telescope (LAMOST; Yu et al. 2021) confirmed a stellar age-metallicity distribution that bifurcates into two almost distinct parts, separated at an age of approximately 8 Gyr. In Sahlholdt et al. (2022), the authors highlight an age-metallicity relation characterised by several disconnected sequences, potentially associated with different star formation regimes throughout the MW disc evolution.
Spitoni et al. (2022) demonstrate that the signature of a delayed gas infall episode, leading to a hiatus in the star formation history of the Galaxy, is evident both in the [Mg/Fe] versus [Fe/H] relation and in the vertical distribution of [Mg/Fe] abundances in the solar vicinity. The works of Lian et al. (2020b,a) presented an alternative version of the two-infall model, whereby a continuous episode of gas accretion is interrupted by two rapidly quenched starbursts. The first starburst contributes to the formation of the high-α thick disc, followed by the second.
In Recio-Blanco et al. (2024), an analysis of the Kiel diagram for GSP Spec Gaia DR3 giant stars revealed a disc bimodality for the first time, eliminating concerns related to interstellar absorption. This bimodality gives rise to dual red giant branch sequences and red clump characteristics in monometallicity populations, providing support for modelling the chemical evolution of the disc through distinct infall episodes.
The presence of a phase of (very) low stellar formation between the high- and low-α sequences is also found in Chandra et al. (2024). In order to explain the orbital circularity and the metallicity of stars analysed with Gaia by Chandra et al. (2024), a star formation that peaked at early times and with a progressive exhaustion of the gas is required. This is consistent with what is shown by Figure 3 of Xiang & Rix (2022). This shape of the star-forming history of the early disc explains some of low-populated regions in the [Fe/H]-circularity plane and resembles the hiatus in star formation proposed in the two-infalls model by Chiappini et al. (1997) (long before Gaia data were available) and also the one by Spitoni et al. (2019b).
More recently, Dubay et al. (2024) confirmed that the star formation history plays a crucial role in generating a bimodal [α/Fe] distribution visible in APOGEE DR17 data. Testing the effects of different delay time distributions (DTDs) for type Ia SNe, they conclude that the DTD alone cannot produce a bimodal [α/Fe] distribution, confirming the findings of Matteucci et al. (2009) and Palla (2021). Finally, Dubay et al. (2024) claimed that radial migration does not reproduce the [α/Fe] bimodality of APOGEE data, in agreement with Johnson et al. (2021) results, but in tension with findings from Sharma et al. (2021) and Chen et al. (2023).
The existence of a double sequence has been discussed in a cosmological framework in recent years. Grand et al. (2018) clearly point out that a bimodal distribution in the [Fe/H]- [α/Fe] plane may be a consequence of a significantly lowered gas accretion rate at ages between 6 and 9 Gyr. On the other hand, Buck (2020) suggests that a dichotomy in the α-sequence is a generic consequence of a gas-rich merger that occurred at a certain epoch in the evolution of the Galaxy, which destabilised the gaseous disc at high redshift. Finally, in the cosmological simulations presented by Agertz et al. (2021), the authors conclude that the low-α sequence in outer Galactic regions (R > 6 kpc) was assembled after the last major merger by the accretion of a metal-poor gas filament that is inclined with respect to the main Galactic plane.
As was previously mentioned, the star formation history projected by the two-infall model by Spitoni et al. (2019b) predicts an extended phase with a hiatus. Gratton et al. (1996, 2000) and Fuhrmann (1998) proposed that the abundance ratios [Fe/α] versus [α/H], where α = O, Mg, serve as a better diagnostic tool for revealing gaps in the star formation process using spectroscopic data. In their examination of O and Fe abundances in a sample of stars within the solar neighbourhood, Gratton et al. (1996, 2000) observed a rise in the [Fe/O] ratio by approximately 0.2 dex, while the [O/H] ratio remained constant during the transition from thick to thin disc phases. This suggested a sudden decline in star formation in the solar neighbourhood during that period. In fact, elements synthesised exclusively by core-collapse supernovae (CC-SNe), such as oxygen, should stop being produced during the hiatus, whereas elements such as Fe, which originates mainly from type Ia SNe on long timescales, continue to be produced and ejected. As a consequence of that, we should observe an increase in [Fe/α] at a fixed [α/H]. These authors also proposed that if the increase in [Fe/O], while maintaining a constant [O/H], is linked to a sudden reduction in star formation during the transition from thick to thin disc phases, a corresponding void should be observable in the distribution of stars with [Fe/O]. Fuhrmann (1998) confirmed the existence of a gap in the SFR by analysing the [Fe/Mg] ratio in solar vicinity stars.
The primary objective of the present article is to re-examine the abundance ratios [Fe/α] versus [α/H], where α = O, Mg, and Si, in APOGEE DR17 stars. A comparative analysis with a revised version of the two-infall model presented by Spitoni et al. (2019b) will be conducted. We aim to discuss similarities and differences that emerge between data and model regarding the signatures of a cessation in star formation, as is suggested by the abundance ratios.
While the existence of radial stellar migration is well established (see, e.g. Roškar et al. 2008; Schönrich & Binney 2009; Loebman et al. 2011; Minchev et al. 2012; Kubryk et al. 2013), its magnitude remains a subject of ongoing debate. Some works (i.e. Nidever et al. 2014; Sharma et al. 2021) have suggested that the dichotomy observed in the [α/Fe] ratios in the thick and thin discs can be explained through the stellar migration. In their view, the thick disc is formed purely of stars that have migrated from the innermost regions of the disc. Ratcliffe et al. (2023) propose that high-α formed in the inner disc before a steepening of the [Fe/H] gradient (maybe due to a merger) and then migrated out, which is why we can see the high-α stars in the solar vicinity. It is worth noting that in the chemo-dynamical model of Minchev et al. (2013), which incorporates star formation history and chemical enrichment based on a classical one-infall chemical evolution scenario, the radial migration cannot produce a gap in the [α/Fe] versus [Fe/H] abundance plane. This has been confirmed by Khoperskov et al. (2021), who suggest that the α-dichotomy is strictly linked to different star formation regimes over the Galaxy’s evolution.
To summarise, many Galactic formation scenarios have been proposed to explain the disc bimodality in the chemical space. One hypothesis suggests that this dichotomy emerged due to a temporary halt in star formation (Spitoni et al. 2019b; Noguchi 2018; Khoperskov et al. 2021). Alternatively, efficient stellar migration could have redistributed stars, leading to the observed bimodality in the solar vicinity (Sharma et al. 2021; Chen et al. 2023). In this paper, we explore the first possibility in detail, bearing in mind that some of the high-α sequence stars observed today in the solar vicinity may have migrated from the innermost regions of the Galaxy.
Our paper is organised as follows. In Section 2, we present the APOGEE DR17 sample used in this work. In Section 3, the adopted chemical evolution models are described. In Section 4, we present our results. Finally, our conclusions are drawn in Section 5.
2 The APOGEE DR17 data sample
We utilised the high-resolution spectroscopic survey APOGEE DR17 (Abdurro’uf et al. 2022). APOGEE is part of the Sloan Digital Sky Surveys (SDSS) and uses the du Pont Telescope and the Sloan Foundation 2.5 m Telescope (Gunn et al. 2006) at Apache Point Observatory. Stellar parameters and abundances were determined using the APOGEE Stellar Parameters and Chemical Abundance Pipeline (ASPCAP; García Pérez et al. 2016). The primary objective of APOGEE is to create a comprehensive chemo-dynamical map of all the structural components of the MW via near-twin, multiplexed, near-infrared, high-resolution spectrographs operating simultaneously in both hemispheres (the APOGEE-N and APOGEE-S spectrographs, respectively; both are described in Wilson et al. 2019). Extensive descriptions of the target selection and strategy are found in Zasowski et al. (2017). The model atmosphere used in APOGEE DR17 is the MARCS atmospheres one of Gustafsson et al. (2008) (see Jönsson et al. 2020). The line list is described in Smith et al. (2021).
We considered stars with a signal-to-noise ratio (S/N) > 80, a logarithm of surface gravity of log g < 3.5, Galactocentric distances enclosed between 7 and 9 kpc, and vertical heights of |z| < 2 kpc. The Galactocentric distances were determined according to Leung & Bovy (2019), available in the astroNN catalogue for APOGEE DR17 stars1.
The accurate distances for distant stars were obtained using a deep neural network developed by Leung & Bovy (2019), trained with parallax measurements of nearby stars shared between Gaia and APOGEE. This network enables the determination of spectro-photometric distances for APOGEE stars. The total number of considered stars is 47105. In Fig. 1, the observed [α/Fe] versus [Fe/H] and [Fe/α] versus [α/H] abundance ratios from APOGEE DR17, where α = Mg, Si, and O, depict a clear bimodality. Figure 2 shows [Fe/Mg] versus [Mg/H], colour-coded with guiding radii computed by the astroNN catalogue. In agreement with previous findings, a fraction of the stars on the high-α sequence are likely to have migrated from the inner Galactic regions, indicated by small guiding radii. In Fig. 3, the abundance ratio for stars with guiding radii enclosed between 7 and 9 kpc (without imposing any condition on the Galactocentric distances) and a vertical height of |z| < 2 kpc is presented, revealing a clear bimodality in this case as well. The total number of stars in the considered sample is 36484. Although the number of stars in the high-α sequence is smaller than in Fig. 1, the position of the two peaks (high-α and low-α) does not change.
It is important to stress that in the present paper we compare the above-mentioned abundance ratios with predictions of a model designed for the solar neighbourhood, where the thick and thin discs are formed sequentially. However, as is highlighted by the results of the multi-zone chemical evolution model of Spitoni et al. (2021), the chemical enrichment of the high-α is similar at different Galactocentric distances, and the results we present will still be valid if stellar migration is included (Palla et al. 2022).
2.1 The star formation hiatus from observed abundance ratios
In Fig. 1, the left panels depict the [α/Fe] versus [Fe/H] abundance ratios (for α = Mg, Si, O), while the right panels illustrate [Fe/α] versus [α/H], showcasing the abundance ratios of APOGEE DR17 stars under the selection criteria outlined in the previous section. A distinct bimodality is evident for all considered elements across the panels.
We define Δ[Fe/H]peak as the difference between the [Fe/H] values corresponding to the highest stellar density in the low-α and high-α sequences. The left panels of Fig. 1 yield:
![Mathematical equation: $\[\Delta[\mathrm{Fe} / \mathrm{H}]_{\text {peak }}=[\mathrm{Fe} / \mathrm{H}]_{\text {peak,low }}-[\mathrm{Fe} / \mathrm{H}]_{\text {peak,high }} \simeq 0.42 \text { dex. }\]$](/articles/aa/full_html/2024/10/aa50754-24/aa50754-24-eq1.png) (1)
(1)
If the reason for α-bimodality is the star formation hiatus, the abundance ratios [Fe/α] versus [α/H] (right panels in Fig. 1) should exhibit a sharp increase in [Fe/α] at nearly constant [α/H] during the transition between the two disc phases, as was discussed in Gratton et al. (1996). Therefore, it is expected that Δ[Fe/H]peak » Δ[α/H]peak.
Moreover, different α elements should display slightly different trends based on the nucleosynthesis progenitors. Elements exclusively synthesised by CC-SNe, such as oxygen, should precisely trace the SFR of the Galaxy, and a hiatus would lead to a sudden halt in the production of this chemical element. In the right panels of Fig. 1, we highlight the region spanned by revealing that Δ[Mg/H]peak = 0.18 dex, Δ[Si/H]peak = 0.22 dex, and = Δ[O/H]peak = 0.13 dex. The smallest variation is observed for oxygen, consistent with the discussion above, while silicon exhibits the largest Δ[α/H]peak, given its substantial synthesis in type Ia SNe (about 1/3, as is indicated by Johnson et al. 2020).
2.2 The APOGEE abundance distribution with birth radii
In Figs. 1 and 2, we have shown that the high- and low-α sequences made of stars, currently located in the solar neighborhood, are separated in the [Fe/α]-[α/H] plane, with a large difference in [Fe/α] for only a small change in [α/H]. However, the solar neighborhood is made of stars that were formed throughout the disc and have migrated there over time, as has been shown in simulations (e.g. Minchev et al. 2013; Agertz et al. 2021; Carrillo et al. 2023). Chemical abundance trends have been shown to drastically change when using the stars’ guiding or current radii instead of their birth location (Ratcliffe et al. 2023, 2024b). Thus, to better understand the [Fe/a]-[α/H] plane, we additionally show it using disc stars that were born in the solar neighborhood.
Ratcliffe et al. (2023, 2024b) estimated the birth radii of MW disc stars based on stellar ages and metallicities, assuming that the gradient of metallicity, at birth, remains linear. Consequently, for any given lookback time (τ), the birth radius, Rb, can be expressed as
![Mathematical equation: $\[R_b(\text { age },[\mathrm{Fe} / \mathrm{H}])=\frac{[\mathrm{Fe} / \mathrm{H}]\left(R_b, \tau\right)-[\mathrm{Fe} / \mathrm{H}](R=0, \tau)}{\nabla[\mathrm{Fe} / \mathrm{H}]},\]$](/articles/aa/full_html/2024/10/aa50754-24/aa50754-24-eq2.png) (2)
(2)
where [Fe/H](Rb, τ) is the metallicity at the lookback time, τ, ∇[Fe/H] the metallicity gradient at that time, and [Fe/H](R = 0, τ) the metallicity at the Galactic center. The time evolution of the metallicity gradient in the MW disc can be recovered directly from the data, as is illustrated in Ratcliffe et al. (2024a) for stronger-barred MW/M31-type galaxies from the TNG50 simulation (see also Lu et al. 2022). This fact allows us to investigate the [Fe/α]-[α/H] relationship for stars that have formed at a specific location in the galaxy with minimal modelling, giving us a better insight into the evolution of these elements.
In Fig. 4, the left panels show the [α/Fe] versus [Fe/H] ratios (for α = Mg, Si, O), while the right panels illustrate [Fe/α] versus [α/H], for APOGEE DR17 red giant disc stars with birth radii enclosed between 7 and 9 kpc. In the low-α sequence, two well-defined over-density clumps are visible; Ratcliffe et al. (2023) suggest that they could correlate with the triggered star formation due to the pericentric passages of the Sagittarius galaxy (Ruiz-Lara et al. 2020).
The primary focus of our study lies in the clear absence of stars between the high-α and the initial clump within the low-α sequence (low metallicity). As is detailed in Fig. 4, our analysis concentrates on exploring various abundance ratios to discern potential signatures of a star formation hiatus. In agreement with Figs. 1 and 2, the plots depicting [Fe/α] versus [α/H] ratios (right panels in Fig. 4) reveal a pronounced rise in [Fe/α] at nearly constant [α/H], for the considered α elements. In particular, for oxygen this bump is more pronounced. As is discussed in Section 2.1, this is a clear signature of a hiatus in the star formation history, which is more pronounced when accounting for where stars were born.
It is worth noting that the chemical enrichment in the solar vicinity, as inferred from the birth radii analysis presented in Fig. 4, seems slightly different from the trends observed in Figs. 1 and 3. However, in the present paper, we do not show chemical evolution models tailored to reproduce the abundance ratios constrained by birth radii, because such a study is reserved for future work.
In the upper panels of Fig. 4, we include the chemical evolution track of the fiducial model for the chemical evolution at 8 kpc predicted by Chen et al. (2023). This model proposes that the APOGEE data in the solar vicinity can be explained by the various contributions to chemical enrichment from different radii. The chemical evolution track computed at 8 kpc appears to trace the abundance data adequately. Moreover, in their Figure 9, Chen et al. (2023) show a clear bimodal distribution in the predicted [α/Fe] stellar distribution. However, it is worth mentioning that the distribution for stars with higher [α/Fe] abundance ratios shows an offset when compared to APOGEE DR17 data. In addition, their age-metallicity relation for individual birth radii is inconsistent with Ratcliffe et al. (2023, 2024b) in that it is mostly flat for all radii at a lookback time <8 Gyr.
New multi-zone chemical evolution models need to be developed to accurately reproduce the abundance ratio distributions constrained by the birth radii of Ratcliffe et al. (2023, 2024b). In particular, the temporal evolution of the abundance gradients should be considered as a fundamental constraint.
Finally, in Fig. 5, we compare the [Fe/O] versus [O/H] abundance ratios for the three different selections of APOGEE DR17 stars analyzed in this study: Galactocentric distances, guiding radii, and birth radii. We observe that the narrowest Δ[O/H]peak occurs in the birth radii case. As was expected, the guiding radius selection accounts for only a portion of stellar migration (Minchev et al. 2018), resulting in an intermediate Δ[O/H]peak value compared to the two other cases analysed.
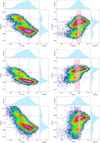 |
Fig. 1 Signatures of the hiatus in star formation unveiled by APOGEE DR17 red giant stars. Density distribution of the observed [α/Fe] vs. [Fe/H] (left panels) and [Fe/α] vs. [α/H] (right panels) abundance ratios (see text for data selection details), where α = Mg (first row), α = Si (second row), and α = O (last row) are reported. On the sides of each panel, the normalised kernel density estimation (KDE) calculated with a Gaussian kernel of the abundance ratio distributions is also reported. The coordinates of the densest regions for the high-α and low-α stars are pinpointed with red and blue lines, respectively. In the right panels, the shaded pink area spans the region of the quantity, Δ[α/H]peak, defined in Eq. (1). The contour density lines correspond to the number of stars within bins in the specified abundance spaces, while the colour-coding is presented on a logarithmic scale. |
 |
Fig. 2 Observed stellar [Fe/Mg] versus [Mg/H] abundance ratios from APOGEE DR17 colour-coded, as in the upper right panel of Fig. 1, with the median values of the guiding radii computed by the value-added astroNN catalogue. |
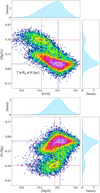 |
Fig. 3 Same as the upper panels of Fig. 1, but for APOGEE DR17 stars with guiding radii, Rg, between 7 and 9 kpc (we did not impose a condition on the Galactocentric distance as we did for Fig. 1) and a vertical height of |z| < 2 kpc. |
3 Chemical evolution models
In this section, we present the chemical evolution models adopted in this work. In particular, we have developed a model for the MW and a model for dwarf galaxies, which could have been accreted by the MW in different phases of its evolution. This particular choice is also motivated by the fact that previous chemical evolution models, in which only gas infall with primordial chemical composition was taken into account (i.e. Spitoni et al. 2021, left panel of their Figure 16), were not able to reproduce the APOGEE DR16 distribution of [Mg/Fe] in the high-α sequence. In Sections 3.1 and 3.2, we report the main properties of MW discs and dwarf models, respectively. In Section 3.3, the nucleosynthesis prescriptions will be discussed.
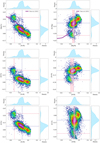 |
Fig. 4 As in Fig. 1, but for APOGEE DR17 stars with birth radii between 7 and 9 kpc. The birth radii were derived in Ratcliffe et al. (2023), following the methodology given in Section 2.2. In the two upper panels we also show with purple lines the predictions of the fiducial chemical evolution model of Chen et al. (2023) computed at 8 kpc. |
3.1 The two-infall model for the Milky Way’s disc components
In this paper, we use a similar two-infall chemical evolution model to the one presented in Nissen et al. (2020), to reproduce the abundance ratios and the age metallicity relation observed in stellar HARPS spectra. The functional form of the adopted gas infall rate is
![Mathematical equation: $\[\mathcal{I}_i(t)=X_i(\overbrace{A e^{-t / \mathrm{T}_{\text {high }}}}^{\text {1st infall, high }-\alpha}+\overbrace{\theta\left(t-\mathrm{T}_{\max }\right) B e^{-\left(t-\mathrm{T}_{\max }\right) / \mathrm{T}_{\text {low }}}}^{\text {2nd infall, low }-\alpha}),\]$](/articles/aa/full_html/2024/10/aa50754-24/aa50754-24-eq3.png) (3)
(3)
where Thigh, Tlow, are the timescales of the two distinct gas infall episodes. The Heaviside step function is represented by θ. Xi is the abundance by mass unit of the element, i, in the infalling gas. Finally, the coefficients, A and B, were obtained by imposing a fit on the observed current total surface mass density in the solar neighbourhood. Following Spitoni et al. (2020), we used the value of total surface mass density in the solar neighbourhood of 47.1 ± 3.4 M⊙pc−2 provided by McKee et al. (2015). We adopted the Scalo (1986) initial stellar mass function (IMF), constant in time and space.
Following the model in Nissen et al. (2020), we assumed that the high-α phase starts at [Fe/H]=−0.8 dex, as a level of preenrichment (see Section 3.2). The quantity Tmax is the time of the maximum infall rate in the second accretion episode; that is, it indicates the delay between the two peaks in the infall rates. The SFR is expressed as the Kennicutt (1998) law,
![Mathematical equation: $\[\psi(t) \propto \nu_{\text {high,low }} \cdot \sigma_g(t)^k,\]$](/articles/aa/full_html/2024/10/aa50754-24/aa50754-24-eq4.png) (4)
(4)
where σg is the gas surface density and k = 1.5 is the exponent. The quantity νhigh,low is the star formation efficiency (SFE), which can be different in different Galactic evolutionary phases. In Table 1, the values adopted for the parameters introduced above are reported. We stress that we assume the same values as Nissen et al. (2020) for the Thigh, Tlow, Tmax, νhigh, and νlow parameters. To reproduce the distribution between high- and low-α stars (see Section 4.4), we imposed that the ratio of the total surface mass densities of the thick (high-α) and thin (low-α) discs is σlow/σhigh = 2.5, a smaller value compared to previous works of Spitoni et al. (2020, 2021). However, it is still compatible with the work of Fuhrmann et al. (2017), in which the author derived a local mass ratio as low as 1.73 after correcting for the difference in the scale height.
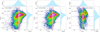 |
Fig. 5 [Fe/O] vs. [O/H] ratios for APOGEE DR17 are shown for the three different samples presented in this work, selected using: Galactocentric distances (left panel), guiding radii (middle panel), and birth radii (right panel). Each panel indicates the number of stars in the sample. The colour maps and lines are consistent with those in Fig. 1. |
Summary of the main parameters of the two-infall model presented in this study (see Section 3.1).
3.2 The chemical evolution model for a massive dwarf galaxy
As was mentioned in Section 3.1, we assume that the Galactic disc has been built up by already chemically enriched gas and that the high-α phase starts at [Fe/H]=−0.8 dex. The chemical enrichment in the [α/Fe] versus [Fe/H] (where for α we mean Si+Mg) required to reproduce the main properties of the high-α sequence APOGEE DR17 red giant stars (i.e. the [α/Fe] distribution, see Section 4) is reported with an empty circle in Fig. 6. This level of chemical enrichment can be reached by a ‘typical’ dwarf galaxy that can be accreted after an evolutionary time of 1.3 Gyr (12.5 Gyr ago). We considered for such a galaxy a 1-infall model with an infall time-scale of 0.24 Gyr and the SFE fixed to 0.42 Gyr−1 (Vincenzo et al. 2019). We assume the presence of a galactic wind (common in dwarf galaxies) proportional to the SFR:
![Mathematical equation: $\[W(t)=\omega \psi(t),\]$](/articles/aa/full_html/2024/10/aa50754-24/aa50754-24-eq5.png) (5)
(5)
where ω is the loading factor fixed to the value of 1.5. The SFR is defined by the Kennicutt (1998) law. In Fig. 6, we report the chemical evolution in the [α/Fe] versus [Fe/H] (where for α we mean Si+Mg) abundance ratio space predicted by the dwarf model compared with Helmi et al. (2018) data for the Enceladus system. Our objective in this paper is not to precisely reproduce the data of Enceladus, but rather to closely approximate the metallicity distribution function (MDF). In Fig. 6, we highlight the chemical composition of the single stellar population formed after 1.3 Gyr of evolution, corresponding to a Galactic age of 12.5 Gyr. At this time, our dwarf galaxy exhibits a surface mass density of 1.50 M⊙ pc−2, a lower value than the 2 M⊙ pc−2 value predicted by Cescutti et al. (2020).
In conclusion, in this study, we assume that the chemical composition, Xi, of the element i-th in Eq. (3) of the infalling gas is enriched with the chemical composition of a typical massive dwarf galaxy that can be accreted after an evolutionary time of 1.3 Gyr (12.5 Gyr ago). It is important to stress that we are not implying that the disc has been formed out of the accreted gas and stars by a single dwarf galaxy, but trying to justify the required level of pre-enrichment for the infalling gas. This accreted gas, which likely originated from filaments of the intergalactic medium, should be contaminated by various dwarf galaxies. Therefore, the chemical pre-enrichment level of the infalling gas assumed in this study should be viewed as an upper limit, as some degree of dilution is expected to have indeed occurred. It is worth noting that in the VINTERGATAN chemodynamical simulation of an MW-like Galaxy in the cosmological context (Agertz et al. 2021; Renaud et al. 2021), the thick disc – a kinematically hot disc populated by high-[α/Fe] stars – is formed both in situ and in accreted satellite galaxies (see Figure 8 in Renaud et al. 2021). Throughout the remainder of this article, we assume that the infalling gas during the thick and thin disc phases has the chemical composition predicted for the accreted dwarf galaxy after 1.3 Gyr of evolution.
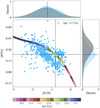 |
Fig. 6 [α/Fe] versus [Fe/H] predicted by the accreted dwarf satellite presented in Section 3.2. The colour-coding stands for the galactic ages at different evolutionary phases. With the empty circle, the chemical abundance ratio at an age of 12.5 Gyr is reported. With light blue points, we have labelled Enceladus stars, as was suggested by Helmi et al. (2018). On the sides of each panel, the observed (light blue shaded area) and predicted (dark grey shaded area) normalised KDEs of the abundance ratio distributions calculated with a Gaussian kernel are also reported. |
3.3 Nucleosynthesis prescriptions
As for the models of Spitoni et al. (2019b) and Nissen et al. (2020), we employed the nucleosynthesis prescriptions introduced by François et al. (2004) for Fe, Mg, Si, and O. Specifically, the Mg yields for massive stars from Woosley & Weaver (1995) were artificially increased to match the solar Mg abundance. Yields for stars in the mass range of 11–20 M⊙ were augmented by a factor of seven, while those for stars with a mass larger than 20 M⊙ were, on average, twice as large. No adjustments were necessary for the yields of Fe computed for solar chemical composition. For Si, only the yields of extremely massive stars (M > 40 M⊙) were amplified by a factor of two.
In the case of O, adopting the original Woosley & Weaver (1995) yields from massive stars as functions of metallicity yielded the best agreement with the [O/Fe] versus [Fe/H] relation and the solar O abundance, determined by Asplund et al. (2005). To maintain the observed [Mg/Fe] versus [Fe/H] pattern, the yields of Iwamoto et al. (1999) for Mg were increased by a factor of five. This set of yields has been widely utilised in the literature, acknowledging the inherent uncertainty in stellar yields as a component of chemical evolution models (e.g. François et al. 2004; Romano et al. 2010; Côté et al. 2017; Prantzos et al. 2018). The aforementioned set of yields, extensively employed in the literature (Cescutti et al. 2007, 2022; Spitoni et al. 2017, 2019a, 2023a; Mott et al. 2013; Vincenzo et al. 2019; Palla et al. 2022), has proven capable of replicating the key characteristics of the solar neighbourhood.
4 Results
In this section, we present model results for the disc components using the chemical evolution model presented in Section 3.1. In particular, in Section 4.1, the comparison with APOGEE data is presented. In Section 4.2, we discuss if signatures of the hiatus in the SFR in the predicted abundance ratios are consistent with APOGEE observations. In Section 4.4, we show the distributions of predicted stars in different regions of the [Mg/Fe] versus [Fe/H] plane. Finally, in Section 4.5, we prove that our model is capable of reproducing other Galactic disc observables.
4.1 Comparison with APOGEE DR17 data
In Fig. 7, we compare model predictions for [α/Fe] versus [Fe/H] (left panels) and [Fe/α] versus [α/H] (right panels) where α = Mg, Si, O with the APOGEE DR17 stars of Fig. 1, adopting the solar abundances of Grevesse et al. (2007) to be consistent with the data. The distribution of the stars as a function of the considered abundance ratios is also compared on the sides of each panel. It is worth noting that the inclusion of enriched gas inflow, as is detailed in Section 3.2, enables the model to accurately reproduce the distribution in [α/Fe] during the high-α phase. This improvement highlights the limitations that were present in previous chemical evolution models (e.g. Spitoni et al. 2021, 2019b), in which the APOGEE DR16 distribution of [Mg/Fe] was not reproduced as well as it is in the present paper.
For example, in Spitoni et al. (2019b) the late accretion of pristine gas produced a dilution of the chemical abundances of the metals, and thus produced an almost constant [α/Fe] ratio and a decreasing [Fe/H], leading to a horizontal evolution of that ratio. On the other hand, in the current model, the accretion of chemically enriched gas has the effect of slightly increasing the slope during the aforementioned horizontal dilution phase. When star formation resumes, the CC-SNe induce a sharp increase in the [α/Fe] ratio, subsequently followed by a decrease and a shift towards higher metallicities due to the strong contamination in Fe from type Ia SNe. This sequential pattern results in a distinctive loop in the [α/Fe] versus [Fe/H] plane within the chemical evolution track, exhibiting a ribbon-like shape.
In conclusion, we note that for the analysed elements the bimodality in the [α/Fe] ratios and the MDFs for the different elements are well reproduced. However, the peak of the distribution of the [α/Fe] ratios in the low-α sequences is slightly shifted towards higher values compared to APOGEE data. In Section 4.2, we shall show that the inclusion of observational errors in the predicted abundance ratios improves the distribution of the [α/Fe] ratios for low-α stars, especially for Mg. In this study, we have chosen not to conduct a detailed analysis of the model parameter space for the delayed infall model scenario, as this has already been extensively discussed in Spitoni et al. (2019b). Instead, we retain most of the model parameter values from the study by Nissen et al. (2020), in which we employed a Bayesian approach based on MCMC methods. Notably, these parameter values are also consistent with those used in Spitoni et al. (2021), in which APOGEE DR16 was used as data constraint again in a Bayesian approach.
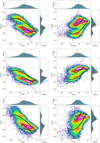 |
Fig. 7 Comparison between predicted (solid black lines, see Section 3.1 for the two-infall model description) and observed APOGEE DR17 (density maps on a logarithmic scale) stellar distribution of stars in the [α/Fe] vs. [Fe/H] (left panels) and [Fe/α] vs. [α/H] (right panels) planes for α = Mg (upper panels), α = Si (middle panels), and α = O (lower panels). Model predictions of the massive dwarf galaxy (see Section 3.2 for model details) are reported with dashed pink lines. On the sides of each panel, the observed (light blue shaded area) and predicted (dark grey shaded area) normalised KDEs of the abundance ratio distributions calculated with a Gaussian kernel are also reported. Finally, with vertical lines the median values of the respective distributions are reported. |
4.2 Signatures of the star formation hiatus in the predicted abundance ratios by the synthetic model
In Fig. 8, we show the predicted distributions in [α/Fe] versus [Fe/H] and [Fe/α] versus [α/H] spaces separating the high-α (evolutionary time t < Tmax) and low-α (evolutionary time t > Tmax) phases, to analyse in more detail the signature of the star formation hiatus. To be consistent with the definition of Δ[α/H]peak introduced in Section 2.1 for APOGEE DR17 abundance ratios, we created a synthetic model considering observed chemical abundance errors, following the same methodology presented in Section 5 of Spitoni et al. (2019b). We introduced a random error to the chemical abundances [X/H] (where X=Mg, Si, O, and Fe) of stellar populations formed at each Galactic time, t. These random errors are uniformly distributed within the range defined by the average errors σ[X/H] = 0.1 dex (Spitoni et al. 2019b) and the new predicted abundances can be expressed as follows:
![Mathematical equation: $\[[\mathrm{X} / \mathrm{H}]_{new}(t)=[\mathrm{X} / \mathrm{H}](t)+U\left(\left[-\sigma_{[X / H]}, \sigma_{[X / H]}\right]\right) .\]$](/articles/aa/full_html/2024/10/aa50754-24/aa50754-24-eq6.png) (6)
(6)
The same procedure has been applied to [X/Fe] abundance ratios imposing σ[X/Fe] = 0.05 dex (Spitoni et al. 2020). In Fig. 8, it is evident that the predicted stellar distribution in the [Fe/α] versus [α/H] plane by the synthetic model is in nice agreement with the APOGEE DR17 data showing the characteristic mushroom-shaped stellar distribution of Fig. 1.
From the left panels of Fig. 8, we find that Δ[Fe/H]peak ~ 0.33 dex. Examining the right panels for the studied α elements, we observe the following variations: Δ[Mg/H]peak = 0.15 dex, Δ[Si/H]peak = 0.25 dex, and Δ[O/H]peak = 0.11 dex. Hence, we find that Δ[α/H]peak « Δ[Fe/H]peak. Moreover, the smallest variation occurs for oxygen, while silicon exhibits the largest Δ[α/H] value. This fact is explained by the fact that Si is produced in a non-negligible way by type Ia SNe, as has already been pointed out. In conclusion, these values are in very good agreement with the findings from APOGEE DR17 data presented in Section 2.1.
Finally, in Fig. 9, we show the effect of the inclusion of observational errors on the abundance ratio distributions without distinguishing between high- and low-α sequences, similarly to what is presented in Figure 8 of Spitoni et al. (2019b). We note that, from the upper panels, the agreement of the [Mg/Fe] distributions between model predictions and APOGEE DR17 has improved compared to Fig. 7.
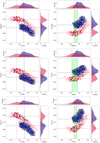 |
Fig. 8 ‘Synthetic model’ predictions. Stellar distributions in the [α/Fe] vs. [Fe/H] (left panels) and [Fe/α] vs. [α/H] (right panels) spaces for α = Mg (upper panels), α = Si (middle panels), and α = O (lower panels) predicted by the two-infall model, taking into account the average observational errors on abundance ratios (see Section 4.2) for the high-α phases (red points and distributions, spanning an evolutionary time of t < Tmax) and for the low-α ones (blue lines and distributions, for t ≥ Tmax). The point sizes are proportional to the number of stars formed at each Galactic time, t. Moreover, each distribution is normalised in order that its area is 1. In the right panels, the shaded light green area spans the region of the quantity Δ[α/H]peak defined in Eq. (1). |
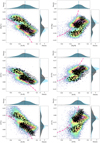 |
Fig. 9 As in Fig. 7, but model predictions are indicated with black points and are referred to the synthetic model introduced in Section 4.2. The point sizes are proportional to the number of stars formed at different Galactic times. Model predictions of the massive dwarf galaxy (see Section 3.2 for model details) are reported with dashed pink lines. |
4.3 Comparison with Anders et al. (2023) stellar ages
In this section, we also compare our model predictions with the recent stellar ages presented by Anders et al. (2023). Applying a supervised machine learning technique trained on a high-quality dataset of 3060 red giant and red clump stars with asteroseismic ages observed by both APOGEE and Kepler, they estimated spectroscopic stellar ages for 178825 red giants.
In particular, in our analysis, we have considered the calibrated spectroscopic age reported in their Figure 4. In the left panel of Fig. 10, APOGEE DR17 stars selected in Section 2 are colour-coded with the median values of the above-mentioned stellar ages. To properly compare the synthetic model introduced in the previous section with APOGEE DR17 stellar ages, we have also included age errors in our model. Following the same methodology introduced in Section 4.2, we find that
![Mathematical equation: $\[[\text { Age }]_{new}(t)=[\text { Age }](t)+U\left(\left[-\sigma_{\text {Age }}, \sigma_{\text {Age }}\right]\right),\]$](/articles/aa/full_html/2024/10/aa50754-24/aa50754-24-eq7.png) (7)
(7)
where for the σAge quantity we assume 20%, a value consistent with the median statistical uncertainty of 17% claimed by Anders et al. (2023).
From Fig. 10, it is possible to appreciate that our model is capable of capturing the main features of the stellar age distributions in both the [Mg/Fe] versus [Fe/H] and [Fe/Mg] versus [Mg/H] spaces. For clarity, after accounting for age errors, ages greater than 12.5 Gyr were assigned to a small number of predicted stars. Excluding these few objects, the age range predicted by our model closely matches the observed range.
In Figure 15 of Chen et al. (2023), the authors present their model’s age distribution in the [Mg/Fe] versus [Fe/H] space. Their results show that the youngest stars are uniformly distributed across a wide range of metallicities [Fe/H], approximately between −0.5 and 0.4 dex. However, in the APOGEE DR17 data, as is shown in Fig. 10, the youngest objects are more concentrated in a narrow region between 0 and 0.3 dex, in agreement with our findings.
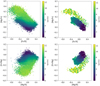 |
Fig. 10 Synthetic model predictions compared to Anders et al. (2023) stellar ages. Upper panels: in the left panel, APOGEE DR17 stars in the [Mg/Fe] vs. [Fe/H] space selected as in Fig. 1 are colour-coded with the stellar ages computed by Anders et al. (2023, see Section 4.3 for details). Synthetic model predictions also including age errors (see Section 4.3) are reported on the right panel. Lower panels: same as the upper panel, but for the [Fe/Mg] vs. [Mg/H] ratios. Concerning model predictions, point sizes are proportional to the number of stars formed at different evolutionary times and points are colour-coded with the predicted stellar age (only stars with ages <12.5 Gyr are reported). |
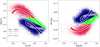 |
Fig. 11 Counting of the stars throughout the high-α and low-α sequences. Comparison between predicted and observed distributions of stars in three regions of the [Mg/Fe] vs. [Fe/H] (left panel) and [Fe/Mg] vs. [Mg/H] (right panel) abundance ratios highlighted in red, green, and blue. The respective percentages of stars are reported in the legend in the left-most plot. For the model prediction, we also indicate the percentage of stars that lie in the dilution phase of the low-α in the chemical evolution tracks highlighted with pink lines. |
4.4 Counting of the stars throughout the high- and low-α sequences
In Fig. 11, we separate the APOGEE DR17 stars in the solar neighbourhood into three zones in the [Mg/Fe] versus [Fe/H] plane. Stars most likely belonging to the hiatus region are highlighted in green, while the bulk of the high- and low-α sequence stars are denoted in red and blue, respectively. Notably, our chemical evolution model reproduces remarkably well this chemical dissection of the disc. Specifically, the percentages of stars in the red, green, and blue zones are 23.8, 7.9, and 68.3% for the data, and 25.0, 5.8, and 69.2% for the models, respectively.
Moreover, in Fig. 11, we emphasise the percentages of stars predicted in the dilution phase of the low-α. It is worth noting that the almost-horizontal phase in the [Mg/Fe] versus [Fe/H] relation is characterised by a negligible number of stars (i.e. ~ 1% of the total) because the effect of dilution by gas infall occurs mainly in the period of strongly depressed star formation. Therefore, we do not reproduce the thin disc APOGEE data, only because of stars formed in the dilution phase, as is claimed by Agertz et al. (2021). Actually, our model results are similar to those of the VINTERGATAN simulations of Agertz et al. (2021) and do not differ from those of Chiappini et al. (1997) except for the length of the star formation gap (~1 Gyr in Chiappini et al. 1997 model). Hence, the proposed model would still be valid even if the bulk of the high-α stars (and some of the low-α sequence stars) were migrators (Sharma et al. 2021; Ratcliffe et al. 2023) from the innermost disc. In Spitoni et al. (2021), we have shown that the high-α sequence is similar at different Galactocentric distances, due to the fast formation of the thick disc.
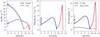 |
Fig. 12 Comparison with Galactic disc present-day observables. In each panel, model predictions are drawn with solid lines and the red and blue colours indicate the high-α (low-α) phases, respectively. Left panel: evolution of the surface mass density of stars (σ*, solid line) and gas (σgas, dashed line) predicted by the two-infall chemical evolution model presented in this study with model parameters reported in Table 1. The purple star indicates the observed present-day σ* value given by McKee et al. (2015). The magenta star represents the present-day σgas value averaging between the Dame (1993) and Nakanishi & Sofue (2003, 2006) datasets presented by Palla et al. (2020) (here shown only at 8 kpc). The 1σ errors are reported in grey. Middle panel: predicted time evolution of the SFR. The shaded grey area indicates the measured range in the solar annulus suggested by Prantzos et al. (2018). Right panel: Evolution of the type Ia SN rate (dashed line) and CC-SN rate (solid line) predicted by the model for the whole Galactic disc. The orange star represents the observed type Ia SN rate reported by Cappellaro & Turatto (1997), while the green one represents the observed CC-SN rates from Li et al. (2011). The 1σ and 2σ errors are reported with grey and black bars, respectively. |
Theoretical and observed solar abundances.
4.5 Comparison with other Galactic disc observables
Gaia In Table 2, the solar abundances of Fe, Mg, Si, and O predicted by our two-infall model are compared to Grevesse et al. (2007) solar values. The model solar abundances are derived from the composition of the ISM at the time of the formation of the Sun (4.6 Gyr ago). It is worth noting that our model reproduces the solar abundances for the elements considered in this work. As is outlined in Section 3.1, we have imposed the condition that the present-day (at evolutionary time tg=13.8 Gyr) total surface mass density in the local disc, including contributions from both high- and low- α sequences, agrees with the value proposed by McKee et al. (2015); specifically, 47.1 ± 3.4 M⊙ pc−2. This study also provides the present-day total local surface density of stars, denoted as σ*(tg), which is reported as 33.4 ± 3 M⊙ pc−2.
The left panel of Fig. 12 illustrates the temporal evolution of the surface mass density of stars predicted by our chemical evolution model. Our model yields σ*(tg) = 32.9 M⊙ pc−2, closely matching the value proposed by McKee et al. (2015). Additionally, the panel displays the predicted temporal evolution of the surface gas density, with the present-day value of σg(tg) calculated as 8.77 M⊙ pc−2, confirming the value proposed by Palla et al. (2020) of ![Mathematical equation: $\[8.4_{-4.2}^{+4.0}\]$](/articles/aa/full_html/2024/10/aa50754-24/aa50754-24-eq8.png) M⊙ pc−2, obtained by averaging between the Dame (1993) and Nakanishi & Sofue (2003, 2006) data sets at 8 kpc. The middle panel of Fig. 12 illustrates the time evolution of the SFR in our model. The present-day value of 2.27 M⊙ pc−2 Gyr−1 lies in the range of 2–5 M⊙ pc−2 Gyr−1 used as a constraint in chemical evolution models for the solar vicinity (Matteucci 2012; Prantzos et al. 2018). In the right panel of Fig. 12, we present the time evolution of type Ia and CC-SN rates. The proposed model for the Galactic components predicts a present-day CC-SN rate for the entire Galactic disc as 0.93 /[100 yr], lower (but within a 2σ error) than the observations of Li et al. (2011) (1.54 ±0.32 /[100 yr]). The predicted present-day type Ia SN rate for the entire Galactic disc is 0.29 /[100 yr], in perfect agreement with the value provided by Cappellaro & Turatto (1997) (0.30±0.20 /[100 yr]). Furthermore, the calculated present-day infalling gas rate is 0.68 M⊙ pc−2 Gyr−1, which is consistent with the 0.3–1.5 M⊙ pc−2 Gyr−1 range suggested in Matteucci (2012) for the solar vicinity.
M⊙ pc−2, obtained by averaging between the Dame (1993) and Nakanishi & Sofue (2003, 2006) data sets at 8 kpc. The middle panel of Fig. 12 illustrates the time evolution of the SFR in our model. The present-day value of 2.27 M⊙ pc−2 Gyr−1 lies in the range of 2–5 M⊙ pc−2 Gyr−1 used as a constraint in chemical evolution models for the solar vicinity (Matteucci 2012; Prantzos et al. 2018). In the right panel of Fig. 12, we present the time evolution of type Ia and CC-SN rates. The proposed model for the Galactic components predicts a present-day CC-SN rate for the entire Galactic disc as 0.93 /[100 yr], lower (but within a 2σ error) than the observations of Li et al. (2011) (1.54 ±0.32 /[100 yr]). The predicted present-day type Ia SN rate for the entire Galactic disc is 0.29 /[100 yr], in perfect agreement with the value provided by Cappellaro & Turatto (1997) (0.30±0.20 /[100 yr]). Furthermore, the calculated present-day infalling gas rate is 0.68 M⊙ pc−2 Gyr−1, which is consistent with the 0.3–1.5 M⊙ pc−2 Gyr−1 range suggested in Matteucci (2012) for the solar vicinity.
Finally, in Fig. 13 we compare the predicted star formation history by the two-infall model with the one reconstructed by Ruiz-Lara et al. (2020) using Gaia DR2 data (for the thin and thick disc stars), and we note a general agreement with our proposed star formation history. In Ruiz-Lara et al. (2020), the observed peaks in the star formation are attributed to encounters with the Sagittarius galaxy. It is worth mentioning that to reproduce the observed recent peaks of SF in the thin disc, Spitoni et al. (2023b) assume two infall episodes occurring in the thin disc. However, the most recent accretion event affects only the chemical properties of stars younger than 2.7 Gyr and does not alter the conclusions of this paper. Finally, it is worth noting that the predicted SFR aligns well with the results obtained by Gallart et al. (2024) using the colour–magnitude diagram fitting technique. Both our model and their findings indicate a peak in star formation approximately 12 billion years ago, as is illustrated in Fig. 13.
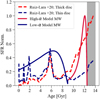 |
Fig. 13 Temporal evolution of the SFR normalised to the maximum value predicted by our model is drawn with a solid line. The red and blue colours indicate the high-α (low-α) phases, respectively, based on chemical selection. The observed estimate obtained with DR2 by Ruiz-Lara et al. (2020) for the thick (thin) disc stars based on kinematic selection is represented by the dashed red (blue) line. The dashed grey area indicates the Galactic ages that fall outside the evolutionary times of the disc components considered in this study. |
5 Conclusions
In this study, we have re-highlighted the gap in star formation proposed by Gratton et al. (1996, 2000) and Fuhrmann (1998), based on old stellar samples, specifically focusing on the [Fe/α] versus [α/H] relation, where α = Mg, Si, O. Our aim is to investigate if signatures of hiatus in the SFR are imprinted in the recent spectroscopic data of APOGEE DR17. We have compared data and predictions derived from a modified version of the two-infall chemical evolution model by Spitoni et al. (2019b), which takes into account the possible merger of the MW with a massive dwarf galaxy, such as Enceladus, which occurred at an early time.
Our key results can be summarised as follows:
The APOGEE DR17 [Fe/α] versus [α/H] relation exhibits a sharp increase in [Fe/α] at nearly constant [α/H] during the transition between the two disc phases. This observation supports the hypothesis that a hiatus in star formation occurred during this evolutionary phase. Notably, the most pronounced growth in the [Fe/α] versus [α/H] relation is observed for oxygen, as this element is exclusively synthesised in CC-SNe. In fact, if star formation steadily decreases or stops, oxygen is no longer produced, whereas iron continues to be ejected by type Ia SNe, even in the absence of star formation. In this situation, [Fe/O] is increasing at constant [O/H]. This confirms the previous suggestions by Gratton et al. (1996, 2000) and Fuhrmann (1998).
Our present two-infall chemical evolution model successfully reproduces the APOGEE DR17 [Fe/α] versus [α/H] abundance ratio. Particularly noteworthy is the model’s ability to predict the hiatus in the SFR between the two infalls of gas, generating abundance ratios compatible with APOGEE DR17 data.
The present chemical evolution model reproduces well the fractions of APOGEE DR17 stars situated in various regions of the [Mg/Fe] versus [Fe/H] abundance ratio plane. The adopted model predicts two main gas infall episodes forming the thick and thin disc, respectively, separated by a gap lasting ~3.5 Gyr. The infalling gas is assumed to be pre-enriched with [Fe/H]=−0.8 dex, in order to account for a merging event with a dwarf galaxy, such as Enceladus, which occurred ~1.3 Gyr after the beginning of evolution.
It is important to highlight that the almost-horizontal evolution in the [Mg/Fe] versus [Fe/H] relation predicted by the present two-infall model is characterised by a negligible number of stars, accounting for only 1% of the total population, since it represents the phase in which the star formation is strongly depressed. Therefore, the gas infall dilution does not play an important role in the formation of the majority of low-α stars in our model, at variance with what was claimed by Agertz et al. (2021) when commenting the Spitoni et al. (2019b) model.
Acknowledgements
The authors thank the anonymous referee for the valuable suggestions that improved the paper. E. Spitoni and G. Cescutti thank I.N.A.F. for the 1.05.23.01.09 Large Grant – Beyond metallicity: Exploiting the full POtential of CHemical elements (EPOCH) (ref. Laura Magrini). F. Matteucci thanks I.N.A.F. for the 1.05.12.06.05 Theory Grant – Galactic archaeology with radioactive and stable nuclei. This research was supported by the Munich Institute for Astro-, Particle and BioPhysics (MIAPbP) which is funded by the Deutsche Forschungsgemeinschaft (DFG, German Research Foundation) under Germany’s Excellence Strategy – EXC-2094 – 390783311. F.M. thanks also support from Project PRIN MUR 2022 (code 2022ARWP9C) “Early Formation and Evolution of Bulge and HalO (EFEBHO)” (PI: M. Marconi), funded by the European Union – Next Generation EU. B.R. and I.M. acknowledge support by the Deutsche Forschungsgemeinschaft under the grant MI 2009/2-1. This work was also partially supported by the European Union (ChETEC-INFRA, project number 101008324). In this work, we have made use of SDSS-IV APOGEE-2 DR17 data. Funding for the Sloan Digital Sky Survey IV has been provided by the Alfred P. Sloan Foundation, the U.S. Department of Energy Office of Science, and the Participating Institutions. SDSS-IV acknowledges support and resources from the Center for High-Performance Computing at the University of Utah. The SDSS web site is www.sdss.org. SDSS is managed by the Astrophysical Research Consortium for the Participating Institutions of the SDSS Collaboration which are listed at www.sdss.org/collaboration/affiliations/.
References
- Abdurro’uf, Accetta, K., Aerts, C., et al. 2022, ApJS, 259, 35 [NASA ADS] [CrossRef] [Google Scholar]
- Adibekyan, V. Z., Sousa, S. G., Santos, N. C., et al. 2012, A&A, 545, A32 [NASA ADS] [CrossRef] [EDP Sciences] [Google Scholar]
- Agertz, O., Renaud, F., Feltzing, S., et al. 2021, MNRAS, 503, 5826 [NASA ADS] [CrossRef] [Google Scholar]
- Ahumada, R., Allende Prieto, C., Almeida, A., et al. 2020, ApJS, 249, 3 [NASA ADS] [CrossRef] [Google Scholar]
- Anders, F., Gispert, P., Ratcliffe, B., et al. 2023, A&A, 678, A158 [NASA ADS] [CrossRef] [EDP Sciences] [Google Scholar]
- Asplund, M., Grevesse, N., & Sauval, A. J. 2005, ASP Conf. Ser., 336, 25 [Google Scholar]
- Buck, T. 2020, MNRAS, 491, 5435 [NASA ADS] [CrossRef] [Google Scholar]
- Buder, S., Sharma, S., Kos, J., et al. 2021, MNRAS, 506, 150 [NASA ADS] [CrossRef] [Google Scholar]
- Cappellaro, E., & Turatto, M. 1997, ASI Ser. C, 486, 77 [NASA ADS] [Google Scholar]
- Carrillo, A., Ness, M. K., Hawkins, K., et al. 2023, ApJ, 942, 35 [NASA ADS] [CrossRef] [Google Scholar]
- Cescutti, G., Matteucci, F., François, P., & Chiappini, C. 2007, A&A, 462, 943 [NASA ADS] [CrossRef] [EDP Sciences] [Google Scholar]
- Cescutti, G., Molaro, P., & Fu, X. 2020, Mem. Soc. Astron. Italiana, 91, 153 [NASA ADS] [Google Scholar]
- Cescutti, G., Bonifacio, P., Caffau, E., et al. 2022, A&A, 668, A168 [NASA ADS] [CrossRef] [EDP Sciences] [Google Scholar]
- Chandra, V., Semenov, V. A., Rix, H.-W., et al. 2024, ApJ, 972, 112 [Google Scholar]
- Chen, B., Hayden, M. R., Sharma, S., et al. 2023, MNRAS, 523, 3791 [NASA ADS] [CrossRef] [Google Scholar]
- Chiappini, C., Matteucci, F., & Gratton, R. 1997, ApJ, 477, 765 [Google Scholar]
- Côté, B., O’Shea, B. W., Ritter, C., Herwig, F., & Venn, K. A. 2017, ApJ, 835, 128 [Google Scholar]
- Dame, T. M. 1993, AIP Conf. Ser., 278, 267 [Google Scholar]
- de Laverny, P., Recio-Blanco, A., Worley, C. C., et al. 2013, The Messenger, 153, 18 [NASA ADS] [Google Scholar]
- Dubay, L. O., Johnson, J. A., & Johnson, J. W. 2024, ApJ, 973, 55 [Google Scholar]
- François, P., Matteucci, F., Cayrel, R., et al. 2004, A&A, 421, 613 [NASA ADS] [CrossRef] [EDP Sciences] [Google Scholar]
- Fuhrmann, K. 1998, A&A, 338, 161 [NASA ADS] [Google Scholar]
- Fuhrmann, K., Chini, R., Kaderhandt, L., & Chen, Z. 2017, MNRAS, 464, 2610 [Google Scholar]
- Gaia Collaboration (Recio-Blanco, A., et al.) 2023, A&A, 674, A38 [CrossRef] [EDP Sciences] [Google Scholar]
- Gallart, C., Surot, F., Cassisi, S., et al. 2024, A&A, 687, A168 [NASA ADS] [CrossRef] [EDP Sciences] [Google Scholar]
- García Pérez, A. E., Allende Prieto, C., Holtzman, J. A., et al. 2016, AJ, 151, 144 [Google Scholar]
- Grand, R. J. J., Bustamante, S., Gómez, F. A., et al. 2018, MNRAS, 474, 3629 [NASA ADS] [CrossRef] [Google Scholar]
- Gratton, R., Carretta, E., Matteucci, F., & Sneden, C. 1996, ASP Conf. Ser., 92, 307 [NASA ADS] [Google Scholar]
- Gratton, R. G., Carretta, E., Matteucci, F., & Sneden, C. 2000, A&A, 358, 671 [NASA ADS] [Google Scholar]
- Grevesse, N., Asplund, M., & Sauval, A. J. 2007, Space Sci. Rev., 130, 105 [Google Scholar]
- Gunn, J. E., Siegmund, W. A., Mannery, E. J., et al. 2006, AJ, 131, 2332 [NASA ADS] [CrossRef] [Google Scholar]
- Gustafsson, B., Edvardsson, B., Eriksson, K., et al. 2008, A&A, 486, 951 [NASA ADS] [CrossRef] [EDP Sciences] [Google Scholar]
- Haywood, M., Di Matteo, P., Lehnert, M. D., Katz, D., & Gómez, A. 2013, A&A, 560, A109 [NASA ADS] [CrossRef] [EDP Sciences] [Google Scholar]
- Helmi, A., Babusiaux, C., Koppelman, H. H., et al. 2018, Nature, 563, 85 [Google Scholar]
- Imig, J., Price, C., Holtzman, J. A., et al. 2023, ApJ, 954, 124 [CrossRef] [Google Scholar]
- Iwamoto, K., Brachwitz, F., Nomoto, K., et al. 1999, ApJS, 125, 439 [NASA ADS] [CrossRef] [Google Scholar]
- Johnson, J. A., Fields, B. D., & Thompson, T. A. 2020, Phil. Trans. R. Soc. London Ser. A, 378, 20190301 [Google Scholar]
- Johnson, J. W., Weinberg, D. H., Vincenzo, F., et al. 2021, MNRAS, 508, 4484 [NASA ADS] [CrossRef] [Google Scholar]
- Jönsson, H., Holtzman, J. A., Allende Prieto, C., et al. 2020, AJ, 160, 120 [Google Scholar]
- Katz, D., Gómez, A., Haywood, M., Snaith, O., & Di Matteo, P. 2021, A&A, 655, A111 [NASA ADS] [CrossRef] [EDP Sciences] [Google Scholar]
- Kennicutt, Jr., R. C. 1998, ApJ, 498, 541 [Google Scholar]
- Khoperskov, S., Haywood, M., Snaith, O., et al. 2021, MNRAS, 501, 5176 [NASA ADS] [CrossRef] [Google Scholar]
- Kordopatis, G., Wyse, R. F. G., Gilmore, G., et al. 2015, A&A, 582, A122 [NASA ADS] [CrossRef] [EDP Sciences] [Google Scholar]
- Kubryk, M., Prantzos, N., & Athanassoula, E. 2013, MNRAS, 436, 1479 [NASA ADS] [CrossRef] [Google Scholar]
- Leung, H. W., & Bovy, J. 2019, MNRAS, 489, 2079 [CrossRef] [Google Scholar]
- Li, W., Chornock, R., Leaman, J., et al. 2011, MNRAS, 412, 1473 [NASA ADS] [CrossRef] [Google Scholar]
- Lian, J., Thomas, D., Maraston, C., et al. 2020a, MNRAS, 497, 2371 [Google Scholar]
- Lian, J., Thomas, D., Maraston, C., et al. 2020b, MNRAS, 494, 2561 [NASA ADS] [CrossRef] [Google Scholar]
- Loebman, S. R., Roškar, R., Debattista, V. P., et al. 2011, ApJ, 737, 8 [Google Scholar]
- Lu, Y., Minchev, T., Khoperskov, S., et al. 2022, arXiv e-prints [arXiv:2212.04515] [Google Scholar]
- Majewski, S. R., Schiavon, R. P., Frinchaboy, P. M., et al. 2017, AJ, 154, 0 [Google Scholar]
- Matteucci, F. 2012, Chemical Evolution of Galaxies (Berlin: Springer) [Google Scholar]
- Matteucci, F., Spitoni, E., Recchi, S., & Valiante, R. 2009, A&A, 501, 531 [NASA ADS] [CrossRef] [EDP Sciences] [Google Scholar]
- McKee, C. F., Parravano, A., & Hollenbach, D. J. 2015, ApJ, 814, 13 [Google Scholar]
- Mikolaitis, S., de Laverny, P., Recio-Blanco, A., et al. 2017, A&A, 600, A22 [NASA ADS] [CrossRef] [EDP Sciences] [Google Scholar]
- Minchev, I., Famaey, B., Quillen, A. C., et al. 2012, A&A, 548, A126 [NASA ADS] [CrossRef] [EDP Sciences] [Google Scholar]
- Minchev, I., Chiappini, C., & Martig, M. 2013, A&A, 558, A9 [CrossRef] [EDP Sciences] [Google Scholar]
- Minchev, I., Anders, F., Recio-Blanco, A., et al. 2018, MNRAS, 481, 1645 [NASA ADS] [CrossRef] [Google Scholar]
- Mott, A., Spitoni, E., & Matteucci, F. 2013, MNRAS, 435, 2918 [Google Scholar]
- Nakanishi, H., & Sofue, Y. 2003, PASJ, 55, 191 [Google Scholar]
- Nakanishi, H., & Sofue, Y. 2006, PASJ, 58, 847 [NASA ADS] [Google Scholar]
- Nidever, D. L., Bovy, J., Bird, J. C., et al. 2014, ApJ, 796, 38 [Google Scholar]
- Nidever, D. L., Holtzman, J. A., Allende Prieto, C., et al. 2015, AJ, 150, 173 [NASA ADS] [CrossRef] [Google Scholar]
- Nissen, P. E., Christensen-Dalsgaard, J., Mosumgaard, J. R., et al. 2020, A&A, 640, A81 [NASA ADS] [CrossRef] [EDP Sciences] [Google Scholar]
- Noguchi, M. 2018, Nature, 559, 585 [Google Scholar]
- Palla, M. 2021, MNRAS, 503, 3216 [Google Scholar]
- Palla, M., Matteucci, F., Spitoni, E., Vincenzo, F., & Grisoni, V. 2020, MNRAS, 498, 1710 [Google Scholar]
- Palla, M., Santos-Peral, P., Recio-Blanco, A., & Matteucci, F. 2022, A&A, 663, A125 [NASA ADS] [CrossRef] [EDP Sciences] [Google Scholar]
- Pinsonneault, M. H., Elsworth, Y., Epstein, C., et al. 2014, ApJS, 215, 19 [Google Scholar]
- Prantzos, N., Abia, C., Limongi, M., Chieffi, A., & Cristallo, S. 2018, MNRAS, 476, 3432 [Google Scholar]
- Ratcliffe, B., Minchev, I., Anders, F., et al. 2023, MNRAS, 525, 2208 [NASA ADS] [CrossRef] [Google Scholar]
- Ratcliffe, B., Khoperskov, S., Minchev, I., et al. 2024a, https://doi.org/10.1051/0004-6361/202449268 [Google Scholar]
- Ratcliffe, B., Minchev, I., Cescutti, G., et al. 2024b, MNRAS, 528, 3464 [NASA ADS] [CrossRef] [Google Scholar]
- Recio-Blanco, A., de Laverny, P., Kordopatis, G., et al. 2014, A&A, 567, A5 [NASA ADS] [CrossRef] [EDP Sciences] [Google Scholar]
- Recio-Blanco, A., de Laverny, P., Palicio, P. A., et al. 2023, A&A, 674, A29 [NASA ADS] [CrossRef] [EDP Sciences] [Google Scholar]
- Recio-Blanco, A., de Laverny, P., Palicio, P. A., et al. 2024, A&A, submitted [Google Scholar]
- Renaud, F., Agertz, O., Read, J. I., et al. 2021, MNRAS, 503, 5846 [NASA ADS] [CrossRef] [Google Scholar]
- Rojas-Arriagada, A., Recio-Blanco, A., de Laverny, P., et al. 2016, A&A, 586, A39 [NASA ADS] [CrossRef] [EDP Sciences] [Google Scholar]
- Rojas-Arriagada, A., Recio-Blanco, A., de Laverny, P., et al. 2017, A&A, 601, A140 [NASA ADS] [CrossRef] [EDP Sciences] [Google Scholar]
- Romano, D., Karakas, A. I., Tosi, M., & Matteucci, F. 2010, A&A, 522, A32 [NASA ADS] [CrossRef] [EDP Sciences] [Google Scholar]
- Roškar, R., Debattista, V. P., Stinson, G. S., et al. 2008, ApJ, 675, L65 [Google Scholar]
- Ruiz-Lara, T., Gallart, C., Bernard, E. J., & Cassisi, S. 2020, Nat. Astron., 4, 965 [NASA ADS] [CrossRef] [Google Scholar]
- Sahlholdt, C. L., Feltzing, S., & Feuillet, D. K. 2022, MNRAS, 510, 4669 [NASA ADS] [CrossRef] [Google Scholar]
- Scalo, J. M. 1986, Fund. Cosmic Phys., 11, 1 [NASA ADS] [EDP Sciences] [Google Scholar]
- Schönrich, R., & Binney, J. 2009, MNRAS, 396, 203 [Google Scholar]
- Sharma, S., Hayden, M. R., & Bland-Hawthorn, J. 2021, MNRAS, 507, 5882 [NASA ADS] [CrossRef] [Google Scholar]
- Silva Aguirre, V., Bojsen-Hansen, M., Slumstrup, D., et al. 2018, MNRAS, 475, 5487 [NASA ADS] [Google Scholar]
- Smith, V. V., Bizyaev, D., Cunha, K., et al. 2021, AJ, 161, 254 [NASA ADS] [CrossRef] [Google Scholar]
- Snaith, O., Haywood, M., Di Matteo, P., et al. 2015, A&A, 578, A87 [NASA ADS] [CrossRef] [EDP Sciences] [Google Scholar]
- Spitoni, E., Gioannini, L., & Matteucci, F. 2017, A&A, 605, A38 [NASA ADS] [CrossRef] [EDP Sciences] [Google Scholar]
- Spitoni, E., Cescutti, G., Minchev, I., et al. 2019a, A&A, 628, A38 [NASA ADS] [CrossRef] [EDP Sciences] [Google Scholar]
- Spitoni, E., Silva Aguirre, V., Matteucci, F., Calura, F., & Grisoni, V. 2019b, A&A, 623, A60 [NASA ADS] [CrossRef] [EDP Sciences] [Google Scholar]
- Spitoni, E., Verma, K., Silva Aguirre, V., & Calura, F. 2020, A&A, 635, A58 [NASA ADS] [CrossRef] [EDP Sciences] [Google Scholar]
- Spitoni, E., Verma, K., Silva Aguirre, V., et al. 2021, A&A, 647, A73 [EDP Sciences] [Google Scholar]
- Spitoni, E., Aguirre Børsen-Koch, V., Verma, K., & Stokholm, A. 2022, A&A, 663, A174 [NASA ADS] [CrossRef] [EDP Sciences] [Google Scholar]
- Spitoni, E., Cescutti, G., Recio-Blanco, A., et al. 2023a, A&A, 680, A85 [NASA ADS] [CrossRef] [EDP Sciences] [Google Scholar]
- Spitoni, E., Recio-Blanco, A., de Laverny, P., et al. 2023b, A&A, 670, A109 [NASA ADS] [CrossRef] [EDP Sciences] [Google Scholar]
- Vincenzo, F., Spitoni, E., Calura, F., et al. 2019, MNRAS, L74 [Google Scholar]
- Wilson, J. C., Hearty, F. R., Skrutskie, M. F., et al. 2019, PASP, 131, 055001 [NASA ADS] [CrossRef] [Google Scholar]
- Woosley, S. E., & Weaver, T. A. 1995, ApJS, 101, 181 [Google Scholar]
- Xiang, M., & Rix, H.-W. 2022, Nature, 603, 599 [NASA ADS] [CrossRef] [Google Scholar]
- Yu, Z., Li, J., Chen, B., et al. 2021, ApJ, 912, 106 [NASA ADS] [CrossRef] [Google Scholar]
- Zasowski, G., Cohen, R. E., Chojnowski, S. D., et al. 2017, AJ, 154, 198 [Google Scholar]
All Tables
Summary of the main parameters of the two-infall model presented in this study (see Section 3.1).
All Figures
|
Fig. 1 Signatures of the hiatus in star formation unveiled by APOGEE DR17 red giant stars. Density distribution of the observed [α/Fe] vs. [Fe/H] (left panels) and [Fe/α] vs. [α/H] (right panels) abundance ratios (see text for data selection details), where α = Mg (first row), α = Si (second row), and α = O (last row) are reported. On the sides of each panel, the normalised kernel density estimation (KDE) calculated with a Gaussian kernel of the abundance ratio distributions is also reported. The coordinates of the densest regions for the high-α and low-α stars are pinpointed with red and blue lines, respectively. In the right panels, the shaded pink area spans the region of the quantity, Δ[α/H]peak, defined in Eq. (1). The contour density lines correspond to the number of stars within bins in the specified abundance spaces, while the colour-coding is presented on a logarithmic scale. |
| In the text | |
|
Fig. 2 Observed stellar [Fe/Mg] versus [Mg/H] abundance ratios from APOGEE DR17 colour-coded, as in the upper right panel of Fig. 1, with the median values of the guiding radii computed by the value-added astroNN catalogue. |
| In the text | |
|
Fig. 3 Same as the upper panels of Fig. 1, but for APOGEE DR17 stars with guiding radii, Rg, between 7 and 9 kpc (we did not impose a condition on the Galactocentric distance as we did for Fig. 1) and a vertical height of |z| < 2 kpc. |
| In the text | |
|
Fig. 4 As in Fig. 1, but for APOGEE DR17 stars with birth radii between 7 and 9 kpc. The birth radii were derived in Ratcliffe et al. (2023), following the methodology given in Section 2.2. In the two upper panels we also show with purple lines the predictions of the fiducial chemical evolution model of Chen et al. (2023) computed at 8 kpc. |
| In the text | |
|
Fig. 5 [Fe/O] vs. [O/H] ratios for APOGEE DR17 are shown for the three different samples presented in this work, selected using: Galactocentric distances (left panel), guiding radii (middle panel), and birth radii (right panel). Each panel indicates the number of stars in the sample. The colour maps and lines are consistent with those in Fig. 1. |
| In the text | |
|
Fig. 6 [α/Fe] versus [Fe/H] predicted by the accreted dwarf satellite presented in Section 3.2. The colour-coding stands for the galactic ages at different evolutionary phases. With the empty circle, the chemical abundance ratio at an age of 12.5 Gyr is reported. With light blue points, we have labelled Enceladus stars, as was suggested by Helmi et al. (2018). On the sides of each panel, the observed (light blue shaded area) and predicted (dark grey shaded area) normalised KDEs of the abundance ratio distributions calculated with a Gaussian kernel are also reported. |
| In the text | |
|
Fig. 7 Comparison between predicted (solid black lines, see Section 3.1 for the two-infall model description) and observed APOGEE DR17 (density maps on a logarithmic scale) stellar distribution of stars in the [α/Fe] vs. [Fe/H] (left panels) and [Fe/α] vs. [α/H] (right panels) planes for α = Mg (upper panels), α = Si (middle panels), and α = O (lower panels). Model predictions of the massive dwarf galaxy (see Section 3.2 for model details) are reported with dashed pink lines. On the sides of each panel, the observed (light blue shaded area) and predicted (dark grey shaded area) normalised KDEs of the abundance ratio distributions calculated with a Gaussian kernel are also reported. Finally, with vertical lines the median values of the respective distributions are reported. |
| In the text | |
|
Fig. 8 ‘Synthetic model’ predictions. Stellar distributions in the [α/Fe] vs. [Fe/H] (left panels) and [Fe/α] vs. [α/H] (right panels) spaces for α = Mg (upper panels), α = Si (middle panels), and α = O (lower panels) predicted by the two-infall model, taking into account the average observational errors on abundance ratios (see Section 4.2) for the high-α phases (red points and distributions, spanning an evolutionary time of t < Tmax) and for the low-α ones (blue lines and distributions, for t ≥ Tmax). The point sizes are proportional to the number of stars formed at each Galactic time, t. Moreover, each distribution is normalised in order that its area is 1. In the right panels, the shaded light green area spans the region of the quantity Δ[α/H]peak defined in Eq. (1). |
| In the text | |
|
Fig. 9 As in Fig. 7, but model predictions are indicated with black points and are referred to the synthetic model introduced in Section 4.2. The point sizes are proportional to the number of stars formed at different Galactic times. Model predictions of the massive dwarf galaxy (see Section 3.2 for model details) are reported with dashed pink lines. |
| In the text | |
|
Fig. 10 Synthetic model predictions compared to Anders et al. (2023) stellar ages. Upper panels: in the left panel, APOGEE DR17 stars in the [Mg/Fe] vs. [Fe/H] space selected as in Fig. 1 are colour-coded with the stellar ages computed by Anders et al. (2023, see Section 4.3 for details). Synthetic model predictions also including age errors (see Section 4.3) are reported on the right panel. Lower panels: same as the upper panel, but for the [Fe/Mg] vs. [Mg/H] ratios. Concerning model predictions, point sizes are proportional to the number of stars formed at different evolutionary times and points are colour-coded with the predicted stellar age (only stars with ages <12.5 Gyr are reported). |
| In the text | |
|
Fig. 11 Counting of the stars throughout the high-α and low-α sequences. Comparison between predicted and observed distributions of stars in three regions of the [Mg/Fe] vs. [Fe/H] (left panel) and [Fe/Mg] vs. [Mg/H] (right panel) abundance ratios highlighted in red, green, and blue. The respective percentages of stars are reported in the legend in the left-most plot. For the model prediction, we also indicate the percentage of stars that lie in the dilution phase of the low-α in the chemical evolution tracks highlighted with pink lines. |
| In the text | |
|
Fig. 12 Comparison with Galactic disc present-day observables. In each panel, model predictions are drawn with solid lines and the red and blue colours indicate the high-α (low-α) phases, respectively. Left panel: evolution of the surface mass density of stars (σ*, solid line) and gas (σgas, dashed line) predicted by the two-infall chemical evolution model presented in this study with model parameters reported in Table 1. The purple star indicates the observed present-day σ* value given by McKee et al. (2015). The magenta star represents the present-day σgas value averaging between the Dame (1993) and Nakanishi & Sofue (2003, 2006) datasets presented by Palla et al. (2020) (here shown only at 8 kpc). The 1σ errors are reported in grey. Middle panel: predicted time evolution of the SFR. The shaded grey area indicates the measured range in the solar annulus suggested by Prantzos et al. (2018). Right panel: Evolution of the type Ia SN rate (dashed line) and CC-SN rate (solid line) predicted by the model for the whole Galactic disc. The orange star represents the observed type Ia SN rate reported by Cappellaro & Turatto (1997), while the green one represents the observed CC-SN rates from Li et al. (2011). The 1σ and 2σ errors are reported with grey and black bars, respectively. |
| In the text | |
|
Fig. 13 Temporal evolution of the SFR normalised to the maximum value predicted by our model is drawn with a solid line. The red and blue colours indicate the high-α (low-α) phases, respectively, based on chemical selection. The observed estimate obtained with DR2 by Ruiz-Lara et al. (2020) for the thick (thin) disc stars based on kinematic selection is represented by the dashed red (blue) line. The dashed grey area indicates the Galactic ages that fall outside the evolutionary times of the disc components considered in this study. |
| In the text | |
Current usage metrics show cumulative count of Article Views (full-text article views including HTML views, PDF and ePub downloads, according to the available data) and Abstracts Views on Vision4Press platform.
Data correspond to usage on the plateform after 2015. The current usage metrics is available 48-96 hours after online publication and is updated daily on week days.
Initial download of the metrics may take a while.