Fig. 1
Download original image
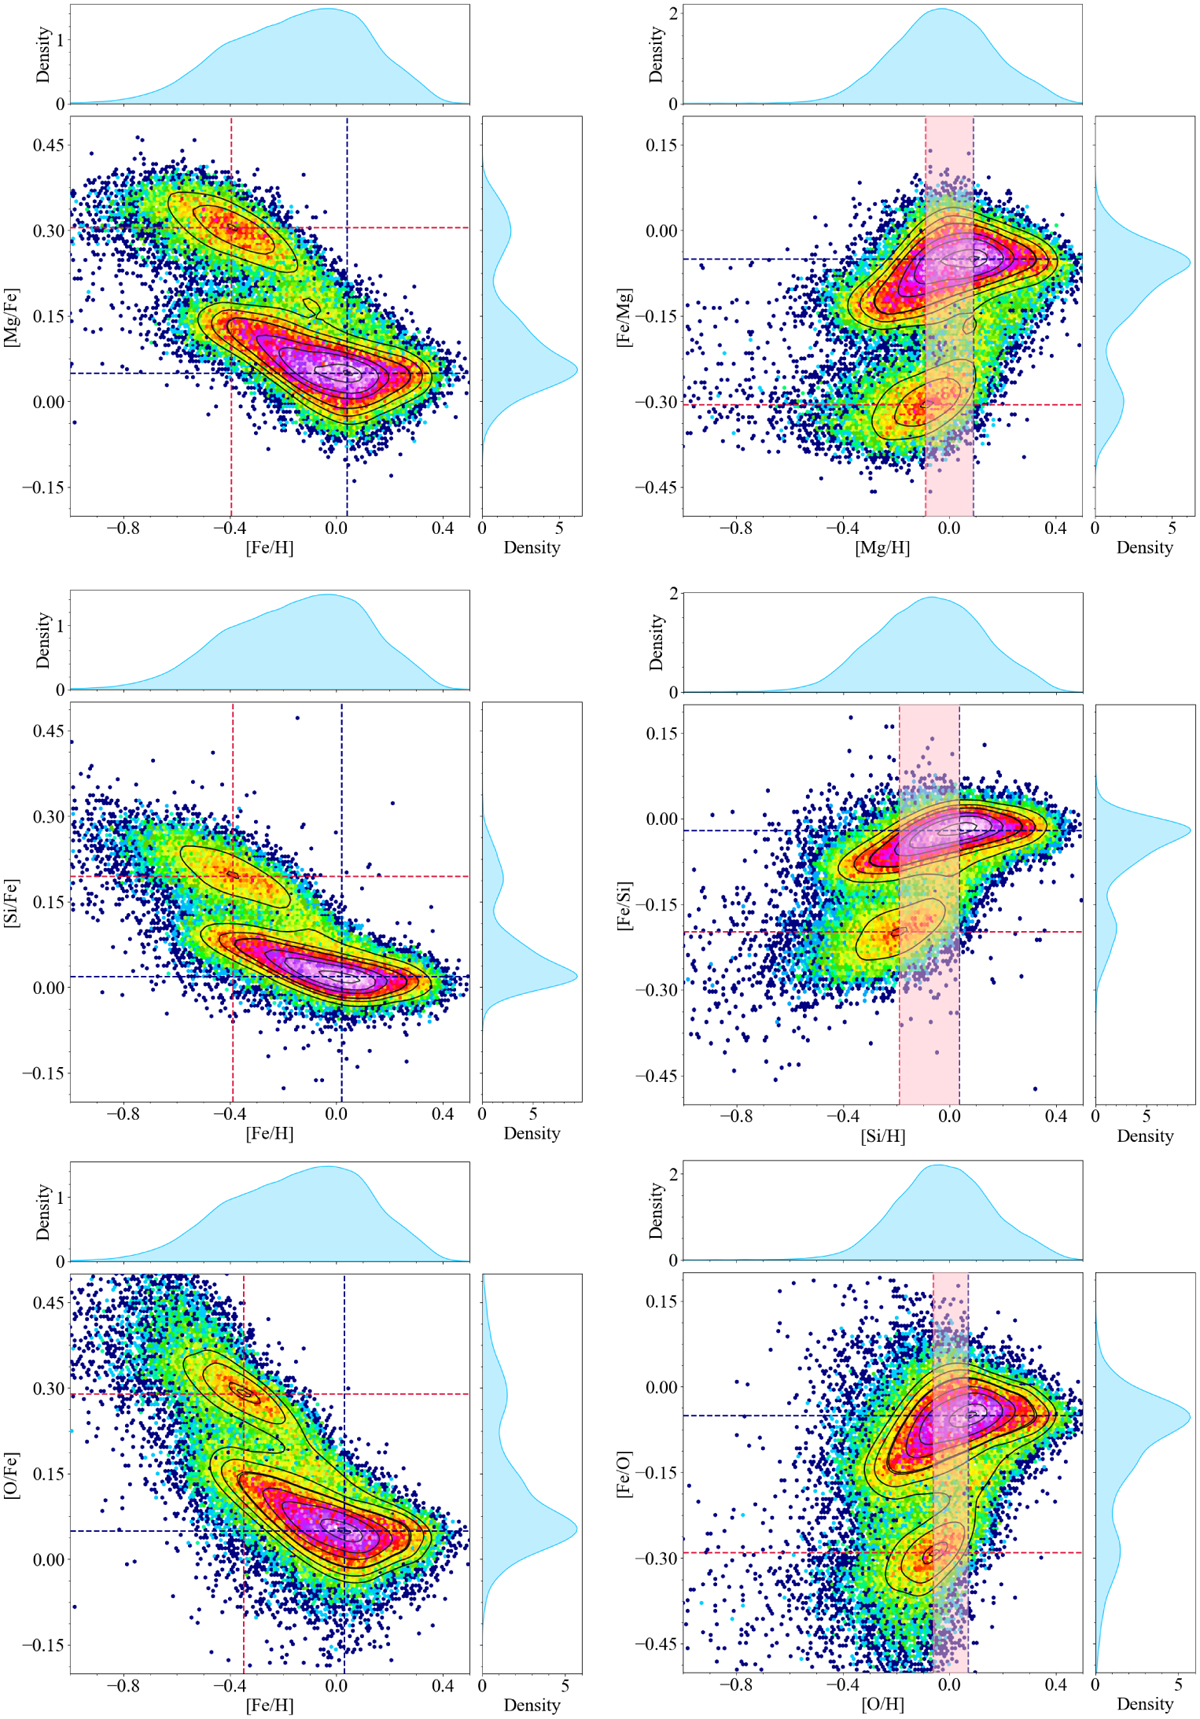
Signatures of the hiatus in star formation unveiled by APOGEE DR17 red giant stars. Density distribution of the observed [α/Fe] vs. [Fe/H] (left panels) and [Fe/α] vs. [α/H] (right panels) abundance ratios (see text for data selection details), where α = Mg (first row), α = Si (second row), and α = O (last row) are reported. On the sides of each panel, the normalised kernel density estimation (KDE) calculated with a Gaussian kernel of the abundance ratio distributions is also reported. The coordinates of the densest regions for the high-α and low-α stars are pinpointed with red and blue lines, respectively. In the right panels, the shaded pink area spans the region of the quantity, Δ[α/H]peak, defined in Eq. (1). The contour density lines correspond to the number of stars within bins in the specified abundance spaces, while the colour-coding is presented on a logarithmic scale.
Current usage metrics show cumulative count of Article Views (full-text article views including HTML views, PDF and ePub downloads, according to the available data) and Abstracts Views on Vision4Press platform.
Data correspond to usage on the plateform after 2015. The current usage metrics is available 48-96 hours after online publication and is updated daily on week days.
Initial download of the metrics may take a while.