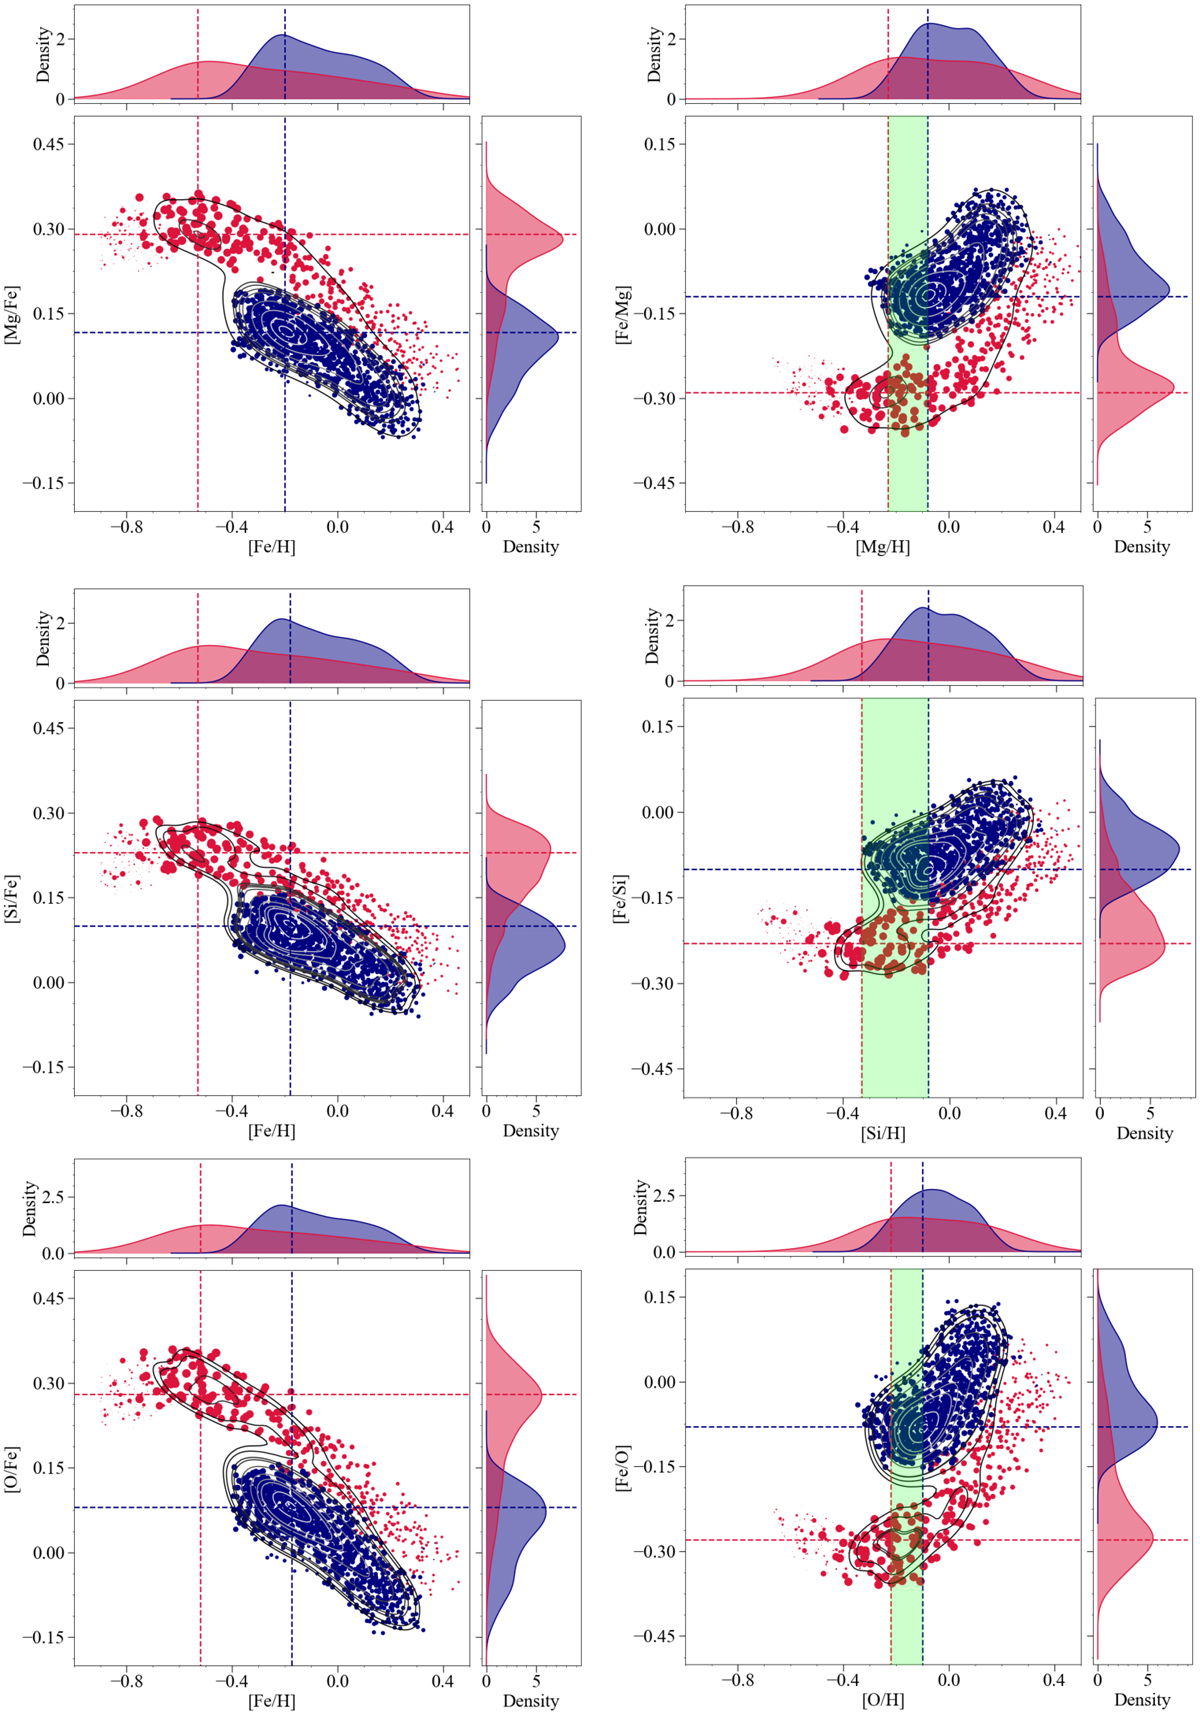
Fig. 8
Download original image
‘Synthetic model’ predictions. Stellar distributions in the [α/Fe] vs. [Fe/H] (left panels) and [Fe/α] vs. [α/H] (right panels) spaces for α = Mg (upper panels), α = Si (middle panels), and α = O (lower panels) predicted by the two-infall model, taking into account the average observational errors on abundance ratios (see Section 4.2) for the high-α phases (red points and distributions, spanning an evolutionary time of t < Tmax) and for the low-α ones (blue lines and distributions, for t ≥ Tmax). The point sizes are proportional to the number of stars formed at each Galactic time, t. Moreover, each distribution is normalised in order that its area is 1. In the right panels, the shaded light green area spans the region of the quantity Δ[α/H]peak defined in Eq. (1).
Current usage metrics show cumulative count of Article Views (full-text article views including HTML views, PDF and ePub downloads, according to the available data) and Abstracts Views on Vision4Press platform.
Data correspond to usage on the plateform after 2015. The current usage metrics is available 48-96 hours after online publication and is updated daily on week days.
Initial download of the metrics may take a while.