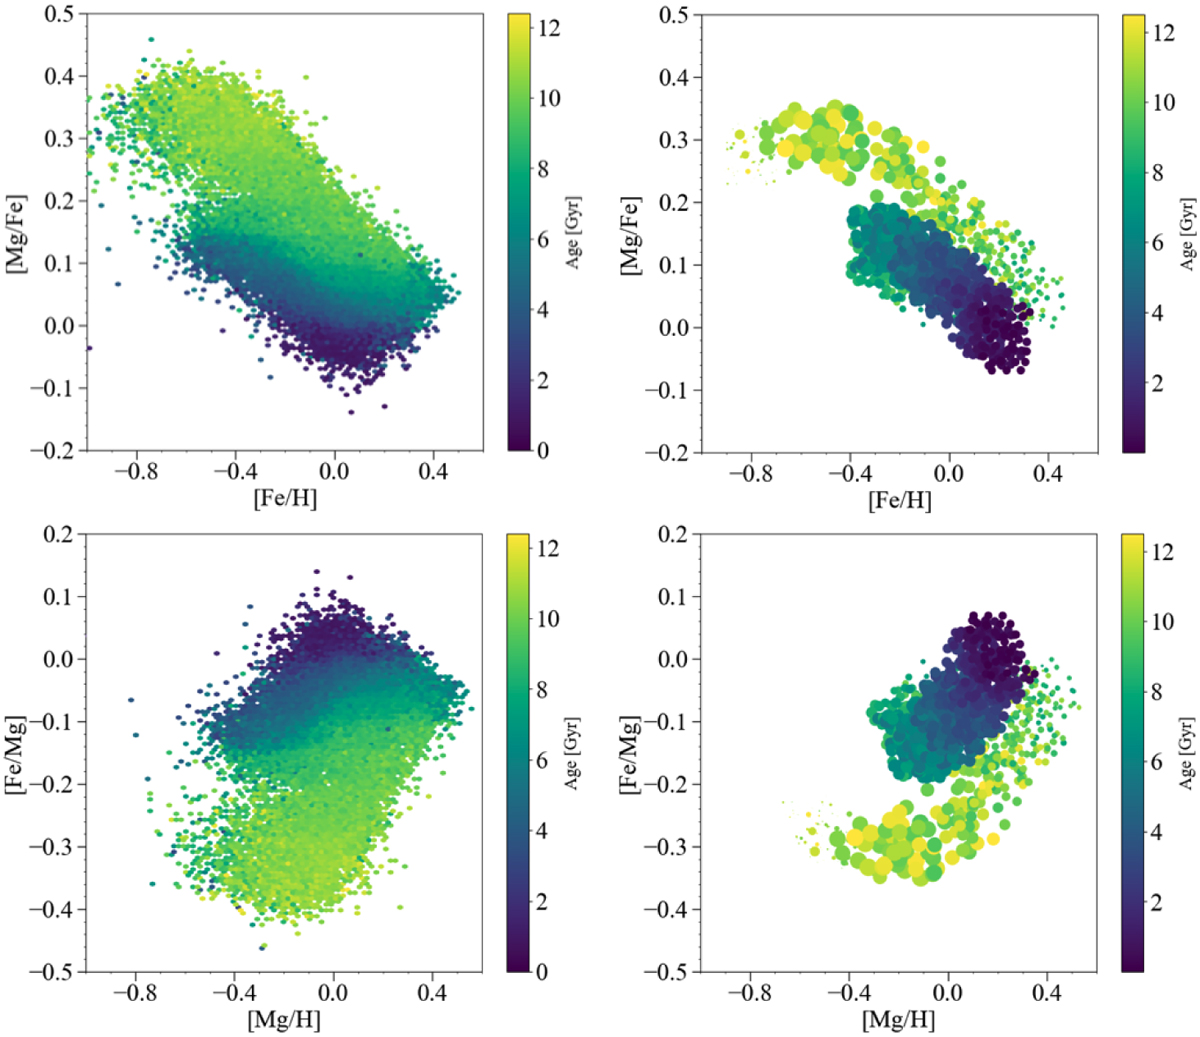
Fig. 10
Download original image
Synthetic model predictions compared to Anders et al. (2023) stellar ages. Upper panels: in the left panel, APOGEE DR17 stars in the [Mg/Fe] vs. [Fe/H] space selected as in Fig. 1 are colour-coded with the stellar ages computed by Anders et al. (2023, see Section 4.3 for details). Synthetic model predictions also including age errors (see Section 4.3) are reported on the right panel. Lower panels: same as the upper panel, but for the [Fe/Mg] vs. [Mg/H] ratios. Concerning model predictions, point sizes are proportional to the number of stars formed at different evolutionary times and points are colour-coded with the predicted stellar age (only stars with ages <12.5 Gyr are reported).
Current usage metrics show cumulative count of Article Views (full-text article views including HTML views, PDF and ePub downloads, according to the available data) and Abstracts Views on Vision4Press platform.
Data correspond to usage on the plateform after 2015. The current usage metrics is available 48-96 hours after online publication and is updated daily on week days.
Initial download of the metrics may take a while.