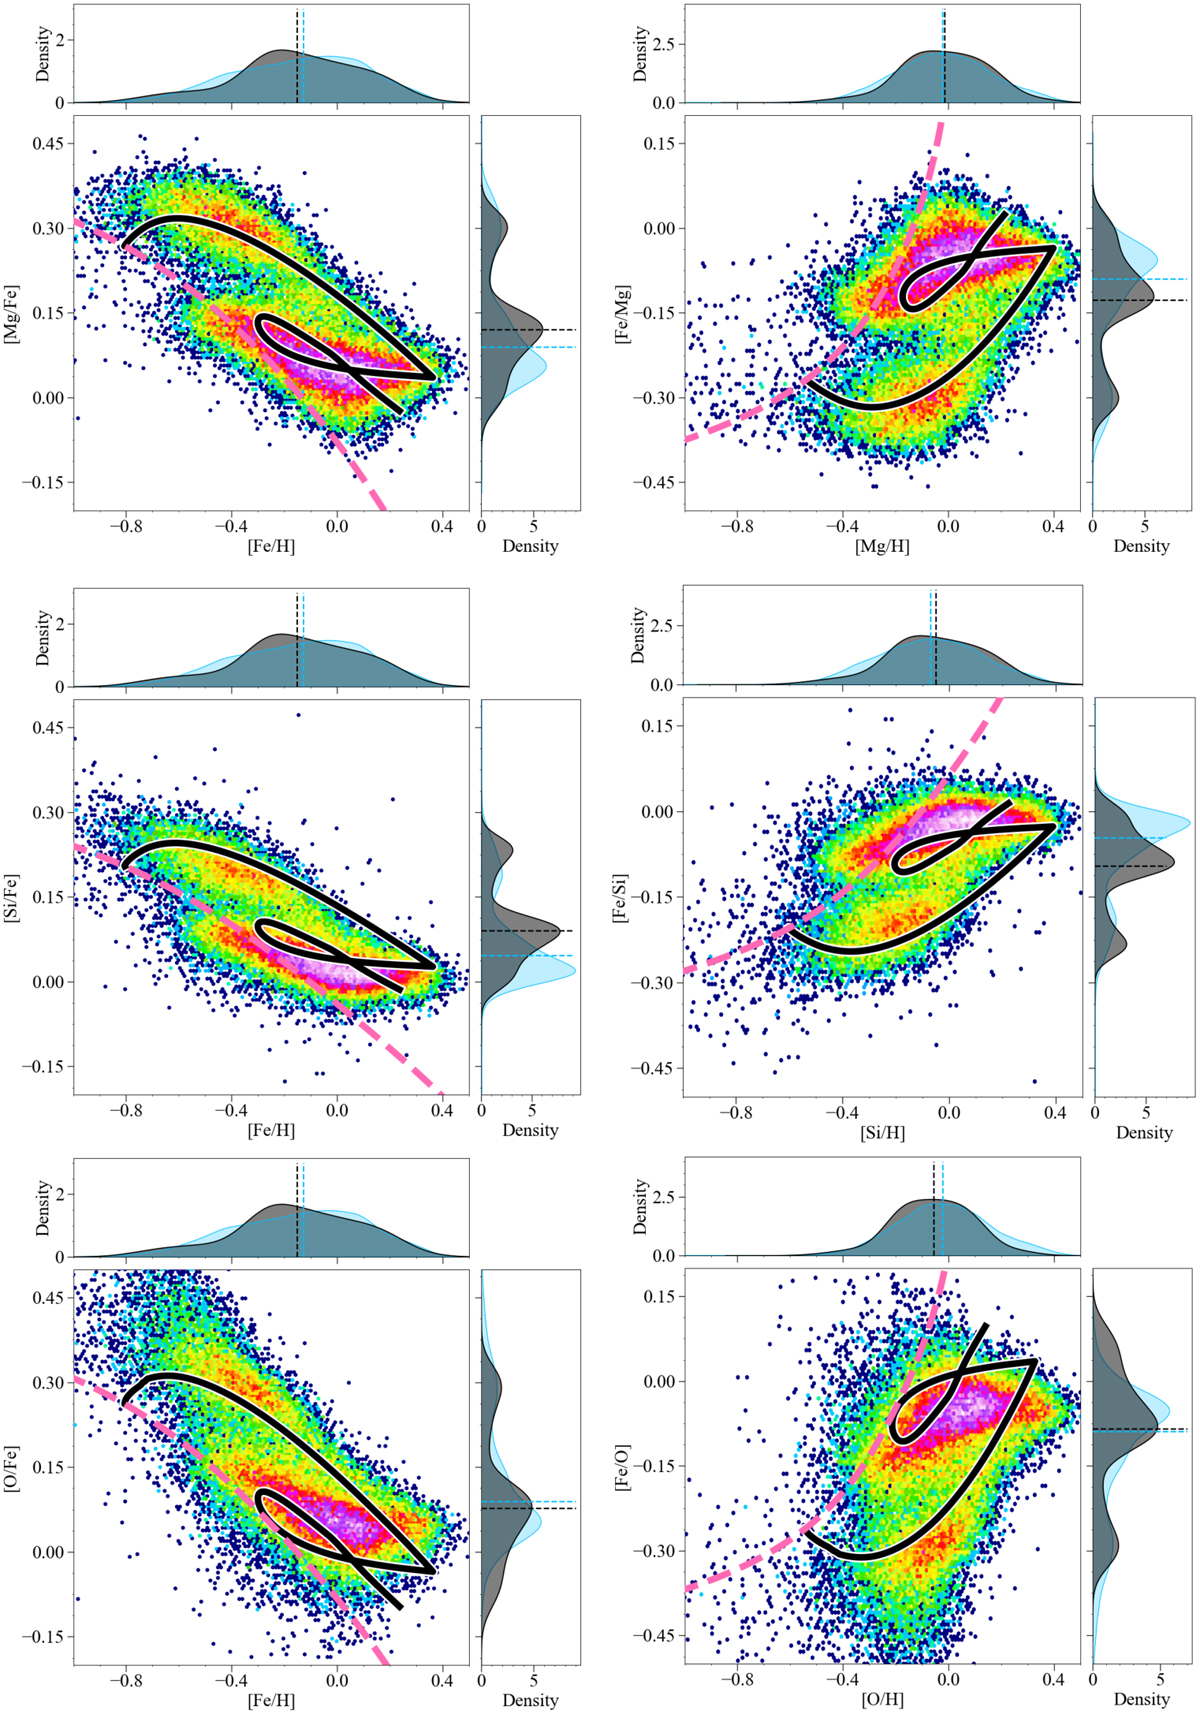
Fig. 7
Download original image
Comparison between predicted (solid black lines, see Section 3.1 for the two-infall model description) and observed APOGEE DR17 (density maps on a logarithmic scale) stellar distribution of stars in the [α/Fe] vs. [Fe/H] (left panels) and [Fe/α] vs. [α/H] (right panels) planes for α = Mg (upper panels), α = Si (middle panels), and α = O (lower panels). Model predictions of the massive dwarf galaxy (see Section 3.2 for model details) are reported with dashed pink lines. On the sides of each panel, the observed (light blue shaded area) and predicted (dark grey shaded area) normalised KDEs of the abundance ratio distributions calculated with a Gaussian kernel are also reported. Finally, with vertical lines the median values of the respective distributions are reported.
Current usage metrics show cumulative count of Article Views (full-text article views including HTML views, PDF and ePub downloads, according to the available data) and Abstracts Views on Vision4Press platform.
Data correspond to usage on the plateform after 2015. The current usage metrics is available 48-96 hours after online publication and is updated daily on week days.
Initial download of the metrics may take a while.