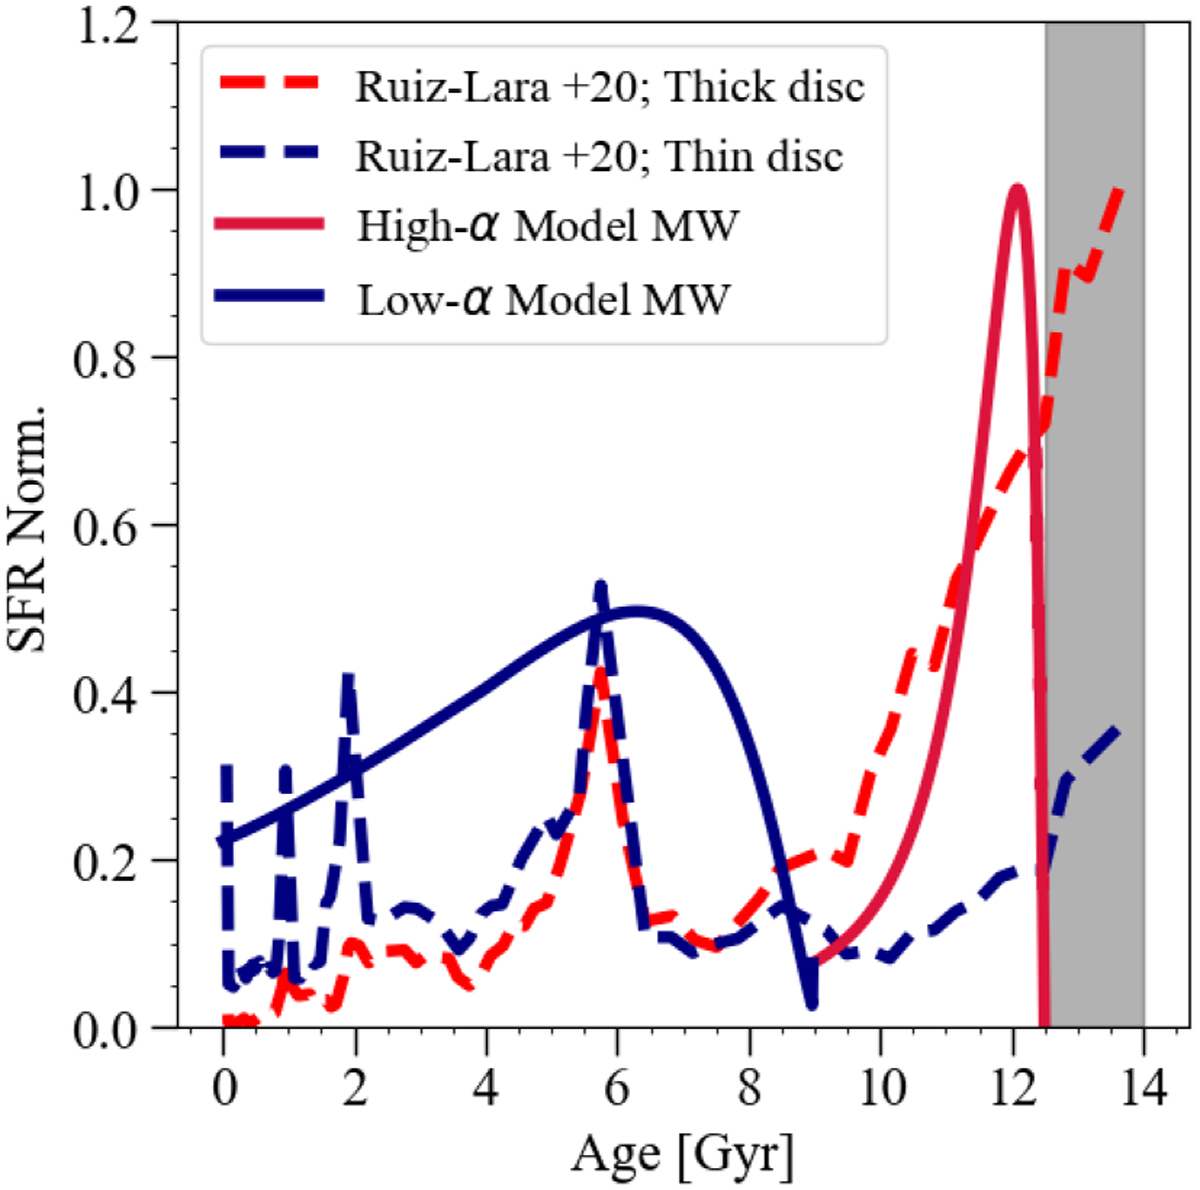
Fig. 13

Download original image
Temporal evolution of the SFR normalised to the maximum value predicted by our model is drawn with a solid line. The red and blue colours indicate the high-α (low-α) phases, respectively, based on chemical selection. The observed estimate obtained with DR2 by Ruiz-Lara et al. (2020) for the thick (thin) disc stars based on kinematic selection is represented by the dashed red (blue) line. The dashed grey area indicates the Galactic ages that fall outside the evolutionary times of the disc components considered in this study.
Current usage metrics show cumulative count of Article Views (full-text article views including HTML views, PDF and ePub downloads, according to the available data) and Abstracts Views on Vision4Press platform.
Data correspond to usage on the plateform after 2015. The current usage metrics is available 48-96 hours after online publication and is updated daily on week days.
Initial download of the metrics may take a while.


