Fig. 11
Download original image
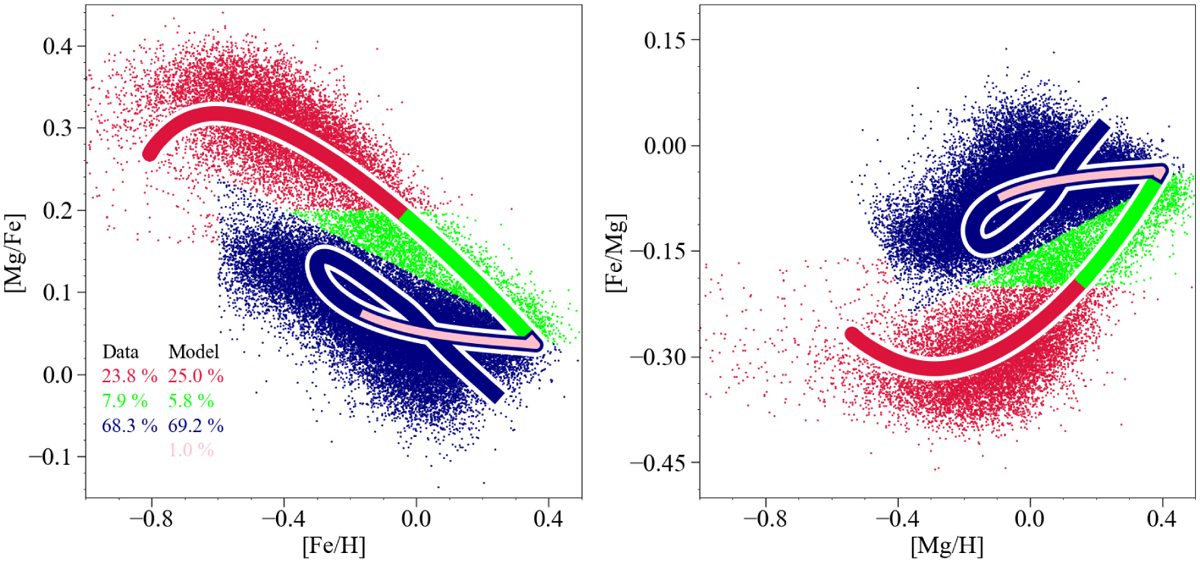
Counting of the stars throughout the high-α and low-α sequences. Comparison between predicted and observed distributions of stars in three regions of the [Mg/Fe] vs. [Fe/H] (left panel) and [Fe/Mg] vs. [Mg/H] (right panel) abundance ratios highlighted in red, green, and blue. The respective percentages of stars are reported in the legend in the left-most plot. For the model prediction, we also indicate the percentage of stars that lie in the dilution phase of the low-α in the chemical evolution tracks highlighted with pink lines.
Current usage metrics show cumulative count of Article Views (full-text article views including HTML views, PDF and ePub downloads, according to the available data) and Abstracts Views on Vision4Press platform.
Data correspond to usage on the plateform after 2015. The current usage metrics is available 48-96 hours after online publication and is updated daily on week days.
Initial download of the metrics may take a while.