| Issue |
A&A
Volume 686, June 2024
|
|
|---|---|---|
| Article Number | A120 | |
| Number of page(s) | 13 | |
| Section | Planets and planetary systems | |
| DOI | https://doi.org/10.1051/0004-6361/202348523 | |
| Published online | 04 June 2024 | |
Vertical and radial distribution of atomic carbon in HD 163296★
1
University of Chile, Astronomy Deparment,
Camino El Observatorio 1515,
Santiago,
Chile
e-mail: This email address is being protected from spambots. You need JavaScript enabled to view it.
2
Departamento de Física, Universidad de Santiago de Chile,
Av. Victor Jara 3659,
Santiago,
Chile
3
Millennium Nucleus on Young Exoplanets and their Moons (YEMS),
Santiago,
Chile
4
Center for Interdisciplinary Research in Astrophysics and Space Exploration (CIRAS), Universidad de Santiago,
Santiago,
Chile
5
Department of Physics and Astronomy, University College London,
Gower Street,
London,
WC1E 6BT,
UK
6
Tartu Observatory, University of Tartu,
Observatooriumi 1,
Tõravere
61602,
Estonia
Received:
9
November
2023
Accepted:
1
March
2024
Abstract
Context. In protoplanetary disks, atomic carbon is expected to originate from the photo dissociation region at the disk surface where CO is dissociated by ultraviolet (UV) photons coming from the stellar, or external interstellar, radiation field. Even though atomic carbon has been detected in several protoplanetary disks, there is a lack of spatially resolved observations of it.
Aims. For the HD 163296 protoplanetary disk, we aim to obtain both the radial and vertical structure of [CI] = 3P1 − 3P0 line emission and perform the first direct comparison of this tracer with the optically thick line emission 12CO J = 2 − 1.
Methods. We used archival ALMA data for [CI] = 3P1 − 3P0 and previously published12 CO J = 2 − 1 data in HD 163296. Through the disksurf software, we extracted the vertical structure; meanwhile, we obtained the radial profiles directly from imaging. Brand new DALI modeling was employed to perform a direct comparison with the data.
Results. We find that these tracers are colocated radially but not vertically, where the 12CO J = 2 − 1 emission is, on average, located at higher altitudes, as is also the case for other tracers in the same disk.
Conclusions. Due to this difference in the vertical height of the emission, the optically thick 12CO J = 2 − 1 emission line appears to trace the highest altitudes, despite the expected formation mechanism of [CI] in the disk. The latter phenomena may be due to efficient mixing of the upper layers of the disk, or UV photons penetrating deeper than we expected.
Key words: astrochemistry / protoplanetary disks / circumstellar matter
The reduced datacube is available at the CDS via anonymous ftp to cdsarc.cds.unistra.fr (130.79.128.5) or via https://cdsarc.cds.unistra.fr/viz-bin/cat/J/A+A/686/A120
© The Authors 2024
 Open Access article, published by EDP Sciences, under the terms of the Creative Commons Attribution License (https://creativecommons.org/licenses/by/4.0), which permits unrestricted use, distribution, and reproduction in any medium, provided the original work is properly cited.
This article is published in open access under the Subscribe to Open model. This email address is being protected from spambots. You need JavaScript enabled to view it. to support open access publication.
1 Introduction
Our knowledge of protoplanetary disk compositions and structure has been greatly expanded by high-resolution observations of the Atacama Large Millimeter and sub-millimeter Array (ALMA). For example, the DSHARP project (Andrews et al. 2018) unveiled disks’ dust substructures using high-resolution observations. Meanwhile, the MAPS large program investigated the gas in protoplanetary disks in order to study their chemical structure (Öberg et al. 2021). As well as investigating the radial structure of disks, we now have the instrumental capability to enable studies of the vertical structure, for which different approaches have been taken. For dust, observing nearly edge-on systems (Villenave et al. 2020) or analyzing scattered light observations (see Avenhaus et al. 2018 for an example) are both methods of assessing the vertical structure of disks. Meanwhile, for the gas, given sufficient spectral and spatial resolution, it is possible to infer the vertical structure from the displacement of the emission relative to the perfectly flat disk case (Izquierdo et al. 2021). One way is to fit velocity curves, as is done with ConeRot (Casassus & Pérez 2019), which places the emission in a conical surface and makes use of it to define average velocity curves that are then used to fit the geometry of such a conical surface, enabling vertical structure detection. A method that is non-model dependent and well suited for mid-inclination disks was first presented in Pinte et al. (2018a). In a similar fashion to in ConeRot, this method uses a geometrical approach by placing the channel maps emission in a conical surface, where the position of the emission is estimated by its local maximum, and has been successfully applied to constrain, for example, carbon monoxide vertical structure in several systems (Law et al. 2022).
Atomic carbon, [CI], is a useful tracer for studying the carbon content in protoplanetary disks. Typical models for [CI] in circumstellar disks consider it to be a product of the photo dissociation of carbon monoxide by ultraviolet (UV) photons; therefore, it is expected for atomic carbon to trace the upper layers of the disk, where the ionizing radiation is abundant (Kama et al. 2016a). As a consequence, [CI] should act as a reliable tracer for the vertical height in protoplanetary disks. Some observations toward debris disks suggest that [CI] has an important shielding effect on CO, protecting it from UV photons and forming a layer close to it in the photo dissociation region (PDR), sharing a similar phenomenology to the interstellar medium (Van Dishoeck & Black 1988). In spatially resolved observations of debris disks, [CI] appears to be colocated radially though not vertically (Higuchi et al. 2019; Kral et al. 2019).
[CI] has been detected toward protoplanetary disks in emission using single dish observations by APEX (Kama et al. 2016a). There, six out 12 disks showed [CI] = 3P1 − 3P0 line emission detection; meanwhile, the [CI] = 3P2 − 3P1 line turned out to be fainter as only one system out the 33 surveyed were detected at that frequency. For systems like TW Hya and HD 100546, it was suggested that carbon is underabundant (Bruderer et al. 2012; Du et al. 2015; Kama et al. 2016b), due to processes like freeze-out of molecules in the midplane of the formation of complex organic molecules in cold regions. Nevertheless, these unresolved observations were not able to precisely constrain the gas-phase [C]/[H] ratio due to a lack of sensitivity. To test the vertical structure, spatially resolved observations for [CI]= 3P1 − 3P0 are needed, but there is still a lack of them. To the authors’ knowledge, there are only two published examples of spatially resolved imaging of [CI] toward Class II protoplanetary disks. In Law et al. (2023), IM Lup [CI] emission was examined, finding this emission to be tracing the upper layers of the disk, even at higher altitudes relative to CO. Meanwhile, in Alarcón et al. (2022) a kinematic bipolar structure was detected in the [CI] emission of HD 163296, possibly associated with a planet candidate, but no further analysis to the radial and vertical structure of the emission was done.
HD 163296’s protoplanetary disk has been exhaustively studied. It has a rich dust structure showing gaps, rings, and a crescent (Isella et al. 2018). Its vertical structure has been studied for several tracers such as CO and its isotopologues and other molecules (Paneque-Carreño et al. 2023). To date, the most prominent vertical structure found is detected for 12CO J = 2 − 1 line emission, even when compared to its isotopologues and other different tracers, which is explained by the fact emission lines from molecules such as HCN, CN, or isotopologues of CO are optically thin.
In this work, we aim to test our current knowledge about the expected location of atomic carbon within protoplanetary disks by directly comparing the radial and vertical locations of [CI] and CO in HD 163296. The paper is organized as follows. In Sect. 2, we describe the procedure for reduction and imaging of the archival ALMA data used in this work. The analysis tools and results are presented in Sect. 3. In Sect. 4, we compare the observed structure indicated by [CI] and CO emission to modeling. Finally, Sect. 5 summarizes the important analyses and discussions from this work.
Summary of the noise root mean square (RMS) levels, peak S/N, and 3σ integrated flux from [CI] channel maps and a [CI] zeroth moment map.
2 Observations and data reduction
We used archival ALMA band 8 observations of HD 163296 from the project 2013.1.00527.S (PI: M. Kama). These observations were obtained in a single pointing on May 2, 2015, affected by an average precipitable water vapor of 0.536 mm. A configuration of 37 antennas of 12 m where the projected baselines’ 5th and 80th percentile are 9.92 and 127.36 m, respectively, was used, which resulted in a synthesizing beam for the continuum images of 0.675 × 0.296″ when constructing images with natural weighting. This weighting was chosen to compensate for the low sensitivity of the observations as the emission is expected to be faint and the total integration time on source was only 13.1 min. Dust continuum was observed in two spectral windows, each one with a bandwidth of 2 GHz, 128 channels, and central frequencies of 480.24 and 482.05 GHz, respectively. [CI] = 3P1 − 3P0 line emission was observed in a single spectral window of 3840 channels of spacing 488.28 KHz, with a central frequency of 492.22 GHz. Calibration sources were the quasars J1256-0547 (bandpass) and J1733-1304 (phase) and Titan (flux).
All of the datasets were calibrated and flagged using Common Astronomy Software Applications (CASA; McMullin et al. 2007) and the pipeline script delivered with the data. Self-calibration was carried out, reaching a final solution interval of 30 s for the phase calibration. Amplitude self-calibration was also applied, with the solutions applied to the line imaging, which increased the final signal-to-noise ratio (S/N) by 20% compared to non-self-calibrated products. Line imaging of [CI] was achieved after subtracting the continuum and averaging the spectral windows to a width of 0.3 km s−1. The synthesized beam of the CI cube is 0.78″ × 0.49″ with a position angle (PA) of 74.46°.
The data we present here is complemented by observations of 12CO J = 2 − 1 toward HD 163296, which were directly obtained from the publicly available DSHARP data release (Andrews et al. 2018; Isella et al. 2018).
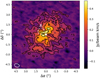 |
Fig. 1 HD 163296 ALMA band 8 zeroth moment map of [CI] line emission. The bottom left white ellipse shows the synthesized beam FWHM. The star position is indicated at (0, 0) by a white figure. Contours show 3σ, 6σ, 10σ, and 15σ (1σ = 2.63 × 10⁻² Jybeam−1 km s−1). Only the emission within the velocity range from 1.3 to 10.6 km s−1 and pixels with values higher than 2σ were used. The enclosed region, labeled by the letter A, highlights the position of an asymmetry feature detected in the channel maps (see Fig. A.1). |
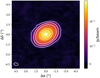 |
Fig. 2 HD 163296 ALMA band 8 dust continuum emission. The bottom left white ellipse shows the synthesized beam FWHM. The star position is indicated at (0,0) by a white figure. Contours show 5σ, 20σ, 50σ, and 250σ (1σ = 6.62 × 10⁻⁴ Jy beam−1). |
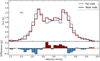 |
Fig. 3 Extracted spectrum from the near and far sides of the disk from the channel maps shown in Fig. A.1. A flux excess coming from the near side of the disk is observed from 5.2 to 7.3 km s−1. The top left black bar shows an estimate of the propagated error in both spectra. |
3 Analysis and results
3.1 Imaging
In Fig. A.1, atomic carbon line emission channel maps are shown following the typical wing shape for gas rotating in a Keplerian fashion. Figure 1 presents the results of using the software bettermoments (Teague & Foreman-Mackey 2018) to obtain the zeroth moment map of the emission by integrating from 1.3 to 10.6 km s−1 and masking all pixels with values lower than 2σ. In the moment 0 map, more emission is observed toward the northeast (NE) side of the disk, as is highlighted by the 15σ contours in the image. Figure 2 shows the dust continuum imaging achieved by combining both dedicated spectral windows, with achieved synthesized beam FWHM dimensions of 0.67″ × 0.40″ and a PA of 76.60°. Table 1 summarizes the noise levels and integrated fluxes.
The asymmetry in the zeroth moment map is also shown in Fig. A.1 where the northern side is brighter at channels around 5.5 km s−1 where we highlight region A showing an asymmetric peak. The NE of the disk is thought to be the near side of the disk, as scattered light imaging indicates (Rich et al. 2019). To further investigate, spectra from the near and far sides of the disk were extracted. This was achieved by dividing each channel along the major axis of the disk. Only emission above 3σ was used and Keplerian masking was applied by using the Teague (2020) implementation. The extracted spectra can be seen in Fig. 3, where an overall flux excess is observed from 5.2 to 7.3 km s−1. The maximum excess comes from the channel at 5.5 km s−1, which could be due to the previously mentioned region A.
An apparent flux surplus coming from the far side of the disk is also measured toward the channels at velocities of 4.0 and 7.6 km s−1. At those channels, the emissions wings are no longer spatially separated, and so distinguishing the near and far sides in images becomes more difficult for the achieved angular resolution. Close to the major axis, the area of one synthesized beam can easily include emission from both the near and far sides (and potentially the upper and lower sides; see Rosenfeld et al. 2013). We defer the interpretation of the asymmetry in these specific channels until in-depth modeling of CI emission processes applied to HD 163296 can be achieved. A well-defined vertical height will be crucial to enable these efforts.
3.2 Radial analysis
Figure 4 shows position-velocity (PV) diagrams for both CO and [CI] emissions in HD 163296 obtained along the major axis of the disk. For gas following Keplerian motion, a symmetric diagram around the origin is expected, as is the case for the CO emission. The PV diagram of [CI] shows a minor asymmetry in the emission along the major axis, in which channels at velocities of 7.6–7.9 km s−1 are brighter than their symmetric counterparts at 3.7–4.0 km s−1, as can be seen in Fig. (A.1). It should be noted that this is not the same asymmetry from the near-far side of the disk previously discussed and it is not related to region A, as the latter does not belong to the major axis of the disk.
The inner and outer radii can be constrained by assuming Keplerian rotation of the gas (see Matrà et al. 2017 for an example). The maximum radial velocity measured along the line of sight is
 (1)
(1)
where x is the distance measured along the major axis of the disk, i is the inclination of the disk, M* is the mass of the star, and G is the gravitational constant. Also, the radial velocity is
 (2)
(2)
where R is the radial distance from the star to the gas. With this method, we find an inner radius of 40 au for both tracers and an outer radius of 600 and 500 au for CO and [CI], respectively. The outer radius of CO is in good agreement with the value of 560 au reported in Isella et al. (2018). We note that the inner and outer radii of [CI] should be taken as an upper and lower limits of the actual values, respectively, as these measurements are affected by the low sensitivity of the observations and its effects cannot be ruled out with the currently available data.
To compare the radial extent of dust, atomic carbon, and carbon monoxide, an azimuthal average profile was obtained for the dust and line emission moment 0 maps, as is shown in Fig. 5. A radial cutoff (R90) is defined as the radius where 90% of the total integrated profile value is reached. R90 was measured for all three datasets studied. By sampling the radial profiles at each radius, several profiles were obtained, for which the calculation was repeated. Their respective 68% confidence interval was estimated. For [CI] and CO, it is found that  and
and  , and for the dust continuum,
  . Therefore, we obtain a ratio of
  and
and  , suggesting dust drift, as was expected for this system.
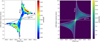 |
Fig. 4 Position-velocity diagrams for CO and [CI] emission in HD 163296. The diagram was made using the CASA task impv. The position axis is the apparent major axis of the gas disk. The starting position is (αJ2000, δJ2000) = (17h56m21s.548, −21°57′25″.902), while the end position is (αJ2000, δJ2000) = (17h56m21s.001, −21°57′19″.436). Only pixels with values higher than 3σ were used. The dashed horizontal line shows the system velocity, the curved dashed line shows the maximum radial velocity according to Eq. (1), and the straight solid black lines were obtained according to Eq. (2), enclosing where the emission is. |
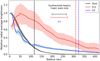 |
Fig. 5 [CI], CO, and dust continuum average radial profiles comparison for HD 163296. All of the profiles were normalized by its respective maximum value. Shaded regions represent ±1σ deviations from the average values. Color boxes show synthesized beam major axis for each dataset and dashed lines show R90 cutoff. |
3.3 Vertical analysis
As the [CI] observations are spatially resolved, we attempted to extract properties of the vertical structure by using disksurf (Teague et al. 2021) implementation of the method first presented in Pinte et al. (2018a). We used the disksurf iterative approach, which for each run updates a mask to better constrain the emission and better identify the peaks. In particular, we used five and ten iterations to obtain the CO and [CI] surface emission, respectively. Because of the low resolution of the [CI] observations, the bottom side of the disk was not resolved, and therefore this method was only applied to the upper surface of the disk. The same was done for carbon monoxide, in a similar fashion to in Paneque-Carreño et al. (2023).
Figure 6 left shows the obtained surface height for both [CI] and CO. [CI] has a ratio, ɀ/r ~ 0.2, up to 300 au; for greater radii, it shows a drastic fall. CO is located in the interval ɀ/r from 0.2 to 0.3, showing carbon monoxide tracing, on average, higher altitudes of the surface, which seems to contradict our assumption that [CI] should be found close to the PDR at the surface of the disk. The CO surface height shows a double-peaked shape, which was also recovered by Paneque-Carreño et al. (2023). The local minimum in the height of the CO emission is located at the same radial position as the maximum in the [CI] emission.
Given that this method depends on the spatial resolution (see Sect. 4.2), we repeated the vertical analysis in images produced using Brights weighting instead of natural. We were not able to recover the emission surface for values of robust parameters lower than one due to the low S/N. All the profiles obtained with robust parameters greater than one agreed with Fig. 6.
4 Discussions
Figure 3 shows an excess flux coming from the velocity channels from 5.2 to 7.3 km s−1, which is also observed in the emission enclosed by the 15σ contours in the zeroth moment map shown in Fig. 1, which extends up to approximately 100 au from the central star.
In Alarcón et al. (2022), a 2 km s−1 redshifted component was first detected in [CI] observations at a location of 0.5″ to the southwest (SW) of the central star and was proposed to be due to inflow of gas into the midplane. We were not able to measure the same asymmetry in the line, even though an excess toward the high-velocity channels is shown in Fig. 3, but we note that in Alarcón et al. (2022) they also included data from additional, shorter integration observations as part of project 2015.1.01137.S (PI: T. Tsukagoshi).
As is modeled in Kama et al. (2016a), atomic carbon is expected to be located in the upper layers of the disk, tracing the PDR. We expect carbon monoxide and atomic carbon to be colocated radially, though not necessarily vertically, where atomic carbon may be tracing higher layers in the PDR.
The results shown in Fig. 4 suggest a radial co-location of [CI] and CO from 40 to 500 au. CO is extended up to 600 au. The difference of 100 au may be explained by a lack of sensitivity to the weak [CI] emission in the outer disk in comparison to the deep CO observations. We note that Eq. (2) assumes a flat circular disk in Keplerian rotation, which is a good approximation at low (r < 50 au) and high radii (r > 400 au), as is shown in Fig. 6, making the method valid for the purposes of constraining gas radial extent.
Regarding the surfaces shown on the left panel of in Fig. 6, we fitted both surface emissions by using the exponentially tapered power law function defined by
![Mathematical equation: $z(r) = {z_0}{\left( {{r \over {{r_0}}}} \right)^\psi } \times \exp \left( { - {{\left[ {{r \over {{r_t}}}} \right]}^{{q_t}}}} \right),$](/articles/aa/full_html/2024/06/aa48523-23/aa48523-23-eq8.png) (3)
(3)
where r0 is just a constant fixed for units to match. For CO, given its double-peaked shape, we followed a similar approach to that in Law et al. (2021), but we considered a baseline model given by Eq. (3) and employed a Gaussian function to model the local minimum at ~270 au. Therefore, for CO, the parameter space consists of a total of seven parameters; four from the baseline model and three more for the Gaussian feature to model the local minimum. By using the emcee package (Foreman-Mackey et al. 2013), Markov chain Monte Carlo sampling was performed to explore the distribution of parameters, whose posterior distributions are shown in Figs. B.1 and B.2.
Figure 6 right shows the best-fitted models. In Fig. B.3 we show the results of this fit, relative to the data points, and the residuals of the model. The residuals range for [CI] goes from − 40 to 40 au, which is within the range of the synthesized beam major axis. Both the modeling and the data shown in Fig. 6 suggest that the atomic carbon is, on average, located at lower altitudes compared to CO optically thick emission line with a ratio, ɀ/r, similar to other optically thin tracers like CN or HCN (see Paneque-Carreño et al. 2023, Fig. 2), with the first also matching the [CI] maximum height at the same radius. This is consistent with CN being also an external UV exposed regions tracer (see Bergner et al. 2021 for a recent work about it). We note that HD 163296 is a Hearbig Ae star system, for which the disk’s [CI] line emission was predicted to be optically thin (see Kama et al. 2016a for a general analysis of Hearbig Ae/Be systems), which may be able to explain the difference.
Now, we set to explore this unexpected result by comparing it with physical-chemical models and proposing three different effects that could contribute to the apparent non-vertical colocation of CO and [CI] emissions.
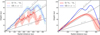 |
Fig. 6 Left: average surface emission height plotted against deprojected radial distance from the star of both CO and [CI] obtained with disksurf. The shaded region shows 1σ scatter of the original obtained points shown in Fig. B.3. Right: best fitted model for [CI] and CO surface emission. For the first, a simple exponentially tapered power law function (as is described in Eq. (3)) was used; meanwhile, for CO, a double exponentially tapered power law function is considered to get a better modeling of its double-peaked shape. The shaded region was obtained by sampling the posterior distribution of the parameters. |
4.1 DALI modeling of [CI] and CO in HD 163296
To compare our current understanding about the formation of [CI] and its relation to CO in HD 163296, we made use of the DALI physical-chemical modeling code (Bruderer et al. 2012; Bruderer 2013) to obtain CO and [CI] abundance vertical profiles as well as their expected emission layers. Starting with a parameterized gas and dust density distribution and an input stellar spectrum, the code utilizes Monte Carlo radiative transfer to calculate the UV radiation field and dust temperature. This establishes an initial guess for the gas temperature, which serves as the starting point for an iterative process to solve gas-grain chemistry (time-dependently or in equilibrium). Spectral datacubes, line profiles, and disk-integrated line fluxes are then obtained using the ray-tracing module. In Appendix D, we show how the datacubes emission surface, extracted with disksurf, compares to the DALI emission contours, to test how well this method is able the extract the vertical structure of the gas. The model was fit following the procedure outlined in Kama et al. (2016b) and Keyte et al. (2023); see those works for a full description of the fitting process. In short, the physical structure and total dust mass was first determined by fitting the continuum spectral energy distribution using a large grid of models. The parameters Rgap, ψ, hc, δdust, and ∆g/d were varied, while Σc was kept fixed at an arbitrary value such that changes in ∆g/d are equivalent to changes only in the total dust mass. Having determined Mdust, we adopted a gas-to-dust ratio of ∆g/d = 100, and fixed Σc such that the best-fit dust mass was maintained. The total elemental carbon and oxygen abundances were then constrained by fitting the spatially unresolved CO rotational ladder and resolved CO 3-2 observations. Final molecular abundances were obtained using a chemical network based on a subset of the UMIST 06 network (Woodall et al. 2007), which consists of 118 species and 1675 individual reactions. We ran the chemistry time-dependently to a chemical age of 1 Myr, which is typical of such systems. A summary of the derived parameters is reported in Table C.1.
From the datacubes, we were not able to reproduce the asymmetry in the emission that enhanced the near side of the disk, and therefore we can exclude radiative transfer effects from creating the profile showed in Fig. 3. We note that this phenomena can't be explained by geometry as we projected the emission with the same inclination and PA as the data.
Figure 7 shows the results of the modeling in HD 163296. There, the CO emission seems to follow the curve of τ = 1, as was expected. For [CI], we overlaid the curve of τ = 0.1 as higher optical depths are obtained only at the midplane, and therefore its line emission is optically thin, as previous modeling of Herbig Ae/Be systems suggested (Kama et al. 2016a).
Figure 8 shows the comparison of the 75% emission contour with our derived surface emission for CO and [CI]. The DALI model agrees with derived [CI] surface emission, but for CO it strongly disagrees as the predicted emission surface is located at much lower heights from radii higher than 100 au.
We would like to stress that the DALI model reflects our current understanding about the PDR in protoplanetary disks as it predicts [CI] as being in higher altitudes compared to CO, where we expected UV radiation to be the most efficient in protoplanetary disks.
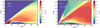 |
Fig. 7 Abundance maps for CO an [CI] in HD 163296 obtained with DALI modeling. The dashed white lines enclose areas with 75 and 50% of the emission expected for CO J = 2 − 1 and [CI]= 3P1 − 3P0. The solid white line shows the line emission, τ = 1, and τ = 0.1 surfaces of CO and [CI] line emission, respectively. |
4.2 Angular resolution effects
The method employed in the present work to derive the vertical height depends on the correct location of local maxima from each channel. When the angular resolution is not enough to resolve both the upper and lower parts of the disk, mixing of both emissions would be observed. This effect could shift the local maximum toward the major axis of the disk, which would result in a lower height measurement (see Rosenfeld et al. 2013, Fig. 4 for a visualization of this effect).
To test whether angular resolution can explain the observed discrepancy, the CO data was convolved with a 2D elliptical Gaussian with the same PA and minor and major axis as the synthesized beam of the [CI] observations in an attempt to mimic the low angular resolution of the latter. Then, the vertical analysis was repeated. The results are shown in the left panel of Fig. 9.
From the convolved data, we were not able to detect any point at radii minor than 100 au, which is also seen in the [CI] profile, indicating that it is not possible to resolve inner structure, as was expected from the low-angular-resolution case. The vertical profile of CO decreases on average by 10–15%, diminishing the difference between CO and [CI]. We employed a Welch’s t-test to examine the null hypothesis that the convolved CO and [CI] data have the same average height within the 100–300 au range. The analysis yields a p-value lower than 10−10, and therefore rejects the hypothesis with a certainty higher than 6σ, suggesting that resolution effects alone may not be sufficient to explain this difference.
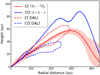 |
Fig. 8 Same as the right panel of Fig. 6 but with the addition of 75% line emission contours from HD 163296 DALI models. |
4.3 µm dust grains’ vertical non-colocation with CO
In gas- and dust-rich environments such as protoplanetary disks, the shielding from high-energy photons is usually provided by µm dust grains (Henning & Semenov 2013). If dust grains and CO are vertically co-located, we expect the PDR to be a thin structure tracing the surface of the disk. In this case, we also expect [CI] to trace the same surface as the optically thick CO line. This lead us to hypothesize that the discrepancy observed may be due to µm dust grains being vertically non-colocated with gaseous CO. This non-colocation would produce a wedge-like PDR region and the optically thin [CI] line would trace the transition from the shielded to the non-shielded part of the disk. In this UV-exposed region, we still need a high abundance of CO such that the J = 2 − 1 line remains optically thick or a high enough accumulation of [CI] such that CO gets shielded by the latter.
A recent work from Rich et al. (2021) tried to constrain the small vertical profile dust grains in three different protoplanetary disks, HD 163296, IM Lup, and CU Cha, finding that for the first two, small grains were located below the CO gas height, which may be produced by a large gas-to-dust ratio that lowers the scattering surface heights. For comparison purposes, in the right panel of Fig. 9, we added to our height profiles the power law fitting of dust grains as well as the data points from the same study. Even though the vertical profile for the dust grains in HD 163296 is constrained by only two data points, it matches the [CI] profile, providing direct observational evidence in favor of our hypothesized PDR wedge-like structure.
Furthermore, under the assumption that the PDR vertical structure depends primarily on the position of µm dust grains, systems like IM Lup and CU Cha offer a unique opportunity to test its diversity by using future high-angular-resolution [CI] observations. For CU Cha, as both the CO and dust grain profiles show a good agreement, we expect [CI] and CO to also agree in their vertical profile. From the work of Rich et al. (2021), IM Lup vertical profiles show an even more drastic difference between CO and small dust grains compared to HD 163296; therefore, if the main mechanism of UV shielding in IM Lup came from µm dust grains, we would have expected this system to show a similar vertical location of [CI] emission relative to CO as the one observed in this work for HD 163296, but in Law et al. (2023) it was observed exactly the opposite phenomena in which [CI] appears to trace upper layers with ɀ/r ≥ 0.5, higher than for CO with ɀ/r ≈ 0.3–0.4. This difference may come from the gas abundance and gas-to-dust ratio of both systems, as IM Lup was found to be a massive disk with a mass of ~0.1 M⊙ (Pinte et al. 2008); in contrast, HD 163296 has gaseous content with a mass of ~0.06 M⊙, as is reported in Table C.1.
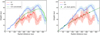 |
Fig. 9 Left: same as Fig. 6 but with the addition of the measured height in convolved CO data shown in green. Right: same as Fig. 6 but with the addition of a dashed green line and points showing µm-sized dust grain height power law fitting and data points from Rich et al. (2021), respectively. |
4.4 Mixing of upper layers
Finally, [CI] may be located at a lower altitude than CO due to an efficient mechanism of mixing in the upper layers of the disk, resulting in [CI] being located on average at a lower height and not exclusively at the surface of the disk. One way in which this may happen is through meridional flows, which are expected to arise in the early stages of planet formation (Morbidelli et al. 2014). This would be dependent on the mixing time and the destruction timescale of CO.
In Teague et al. (2019), high-precision velocity signatures, resembling meridional flows, were detected in HD 163296. These flows match the position of previously detected continuum ring gaps and a kinematic feature detected in CO observations, postulated to be due to the presence of a two-Jupiter-mass planet (Pinte et al. 2018b). As this phenomena seems to be localized at certain locations within the disk, its effects get diluted by the method employed in this work, which assumes an azimuthal symmetry of the disk. Therefore, we expect this effect to contribute less compared to the other two we explored before.
5 Conclusions
By using spatially resolved, archival ALMA observations of the [CI] = 3P1 − 3P0 emission line toward HD 163296, we have made the first analysis of both the radial and vertical location of atomic carbon in a Class II protoplanetary disk and performed the first direct comparison of this tracer with carbon monoxide by using observations of the 12CO J = 2 − 1 optically thick emission line. We find that [CI] shows an excess of flux toward the near side of the disk, with a radial extension of 100 au that may be related to planet candidates. CO and [CI] are colocated radially up to a radius of 500 au, with the first being more radially extended; this difference may be explained by the low sensitivity achieved in [CI] observations.
With radial average profiles of both dust continuum and the zeroth moment map of [CI], we were able to compare the radial extent of the [CI] emission with dust continuum, finding the first is 2.6 times more radially extended than the dust emission, in good agreement with the fact that HD 163296 is a gas-rich protoplanetary disk.
Regarding the vertical structure of the selected tracers, CO shows a double-peaked surface emission whose ratio, ɀ/r, lies in the interval 0.3–0.2 before decreasing toward the outer disk at a radius of 350 au. For [CI], despite only 13.1 min of integration time being used to obtain the data, a vertical structure with a ratio of ɀ/r ~ 0.2 is measured up to 300 au, comparable to tracers like CN or HCN, but located, on average, at a lower altitude than CO.
Brand new DALI models were obtained for HD 163296 and its CO and [CI] abundances and emission. The model shows that CO emission follows closely the τ = 1 curve, as was expected, in contrast to [CI], whose emission is optically thin. The derived surface emission of [CI] agrees with the model but the CO emission surface is heavily underestimated by it. Three different effects were explored in order to explain the unexpected low heights of [CI] emission compared to CO. First, the low angular resolution of [CI] data may have decreased the measured profile, but it is not able to completely explain the discrepancy as the CO convolved data profile still shows a significant difference. Second, a wedge-like PDR structure instead of a thin surface toward the outer part of the disk may be able to explain the difference, which is supported by observational evidence of µm dust grains being non-colocated vertically with CO as the latter account for most of the shielding in dust- and gas-rich environments. Finally, mixing of the upper layers may also contribute, which could be done by the meridional flows observed in HD 163296.
Future observations of [CI] toward protoplanetary disks will enable more detailed exploration of the PDR, where targets like IM Lup and CU Cha offer good starting points. New theoretical modeling of the PDR of protoplanetary disks will also be needed, ideally including the effects of dust distribution, mixing, and shielding.
Acknowledgements
F.U. acknowledges Subdirection of Human Capital ANID for providing fundings for his MSc program (national MSc 2023/22231861). F.U. and J.M. acknowledge the NRAO as this project started thanks to the REU Chile program organized by the aforementioned organization. M.K. gratefully acknowledges funding from the European Union’s Horizon Europe research and innovation programme under grant agreement No. 101079231 (EXOHOST), and from UK Research and Innovation (UKRI) under the UK government’s Horizon Europe funding guarantee (grant number 10051045). L.K. acknowledges funding via a Science and Technology Facilities Council (STFC) studentship. We thank the referee as the comments and questions during the revision process made the article significantly better. This paper makes use of the following ALMA data: ADS/JAO.ALMA#2013.1.00527. ALMA is a partnership of ESO (representing its member states), NSF (USA) and NINS (Japan), together with NRC (Canada), MOST and ASIAA (Taiwan), and KASI (Republic of Korea), in cooperation with the Republic of Chile. The Joint ALMA Observatory is operated by ESO, AUI/NRAO and NAOJ.
Appendix A Channel maps of the [CI] emission
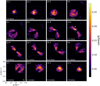 |
Fig. A.1 [CI] = 3P1 − 3P0 line emission channel maps observed in HD163296. Each panel has dimensions of 9.64” × 9.64” and, at the bottom left, is labeled by its velocity relative to the rest frequency of the [CI] line. At the top left, the peak S/N is shown. The panel of 7.0 km s−1 shows the synthesized beam FWHM with a white ellipse. The enclosed region in the panel of 5.5 km s−1, labeled by the letter A, highlights an asymmetry feature in the emission. |
Appendix B Exponential taper modeling of residuals and the posterior distribution of parameters
 |
Fig. B.1 Posterior distribution of parameters ψ, qt, rt, and ɀ0 described in eq. (3) and A, µ, and σ from the Gaussian depression for 12CO J = 2 − 1 data. Marginalized distributions are shown in the diagonal and their vertical dashed lines represent the 16th, 50th, and 84th percentiles. |
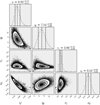 |
Fig. B.2 Posterior distribution of parameters ψ, qt, rt, and ɀ0 from eq. (3), for the fitting surface height in the [CI] data. Marginalized distributions are shown in the diagonal and their vertical dashed lines represent the 16th, 50th, and 84th percentiles. |
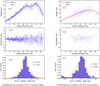 |
Fig. B.3 (a.1, b.1): Purple data points show the surface height obtained with disksurf, applied to the data presented in 2. Solid blue and red lines show the best-fitted model for CO and [CI], respectively. (a.2, b.2): Residuals as a function of radial distance. (a.3, b.3): Normalized histogram of the residuals. The solid orange line shows a normal distribution with mean and standard deviations measured from residuals. |
Appendix C DALI model parameters
Fiducial HD HD169296 disk model parameters.
Appendix D Simulated datacube surface emission
To test how well disksurf tool traces the surface emission of the gas, we repeated the vertical analysis in the simulated datacubes obtained with the DALI modeling. The results, compared to the DALI 75% emission contours, are shown in Fig. D.1 in the appendix. There, we notice that both the [CI] profiles are located at a higher altitude from radii > 100 au, but the difference is not as drastic as the DALI contours suggest. This is an effect of the emission being optically thin. The CO emission surface follows the DALI contours, which corresponds approximately to the τ = 1 surface of the line.
References
- Alarcón, F., Bergin, E., & Teague, R. 2022, ApJ, 941, L24 [CrossRef] [Google Scholar]
- Andrews, S. M., Huang, J., Pérez, L. M., et al. 2018, ApJ, 869, L41 [NASA ADS] [CrossRef] [Google Scholar]
- Avenhaus, H., Quanz, S. P., Garufi, A., et al. 2018, ApJ, 863, 44 [NASA ADS] [CrossRef] [Google Scholar]
- Bergner, J. B., Öberg, K. I., Guzmán, V. V., et al. 2021, ApJS, 257, 11 [NASA ADS] [CrossRef] [Google Scholar]
- Bruderer, S. 2013, A&A, 559, A46 [NASA ADS] [CrossRef] [EDP Sciences] [Google Scholar]
- Bruderer, S., van Dishoeck, E. F., Doty, S. D., & Herczeg, G. J. 2012, A&A, 541, A91 [NASA ADS] [CrossRef] [EDP Sciences] [Google Scholar]
- Casassus, S., & Pérez, S. 2019, ApJ, 883, L41 [Google Scholar]
- Du, F., Bergin, E. A., & Hogerheijde, M. R. 2015, ApJ, 807, L32 [NASA ADS] [CrossRef] [Google Scholar]
- Foreman-Mackey, D., Hogg, D. W., Lang, D., & Goodman, J. 2013, PASP, 125, 306 [Google Scholar]
- Henning, T., & Semenov, D. 2013, Chem. Rev., 113, 9016 [Google Scholar]
- Higuchi, A. E., Saigo, K., Kobayashi, H., et al. 2019, ApJ, 883, 180 [NASA ADS] [CrossRef] [Google Scholar]
- Isella, A., Huang, J., Andrews, S. M., et al. 2018, ApJ, 869, L49 [NASA ADS] [CrossRef] [Google Scholar]
- Izquierdo, A. F., Testi, L., Facchini, S., Rosotti, G. P., & van Dishoeck, E. F. 2021, A&A, 650, A179 [NASA ADS] [CrossRef] [EDP Sciences] [Google Scholar]
- Kama, M., Bruderer, S., Carney, M., et al. 2016a, A&A, 588, A108 [NASA ADS] [CrossRef] [EDP Sciences] [Google Scholar]
- Kama, M., Bruderer, S., Van Dishoeck, E., et al. 2016b, A&A, 592, A83 [NASA ADS] [CrossRef] [EDP Sciences] [Google Scholar]
- Keyte, L., Kama, M., Booth, A. S., et al. 2023, Nat. Astron., 7, 684 [NASA ADS] [CrossRef] [Google Scholar]
- Kral, Q., Marino, S., Wyatt, M. C., Kama, M., & Matra, L. 2019, MNRAS, 489, 3670 [NASA ADS] [Google Scholar]
- Law, C. J., Teague, R., Loomis, R. A., et al. 2021, ApJS, 257, 4 [NASA ADS] [CrossRef] [Google Scholar]
- Law, C. J., Crystian, S., Teague, R., et al. 2022, ApJ, 932, 114 [NASA ADS] [CrossRef] [Google Scholar]
- Law, C. J., Alarcón, F., Cleeves, L. I., Öberg, K. I., & Paneque-Carreño, T. 2023, ApJ, 959, L27 [NASA ADS] [CrossRef] [Google Scholar]
- Matrà, L., Dent, W., Wyatt, M., et al. 2017, MNRAS, 464, 1415 [CrossRef] [Google Scholar]
- McMullin, J. P., Waters, B., Schiebel, D., Young, W., & Golap, K. 2007, ASP Conf. Ser., 376, 127 [Google Scholar]
- Morbidelli, A., Szulágyi, J., Crida, A., et al. 2014, Icarus, 232, 266 [Google Scholar]
- Öberg, K. I., Guzmán, V. V., Walsh, C., et al. 2021, ApJS, 257, 1 [CrossRef] [Google Scholar]
- Paneque-Carreño, Miotello, A., van Dishoeck, E. F., et al. 2023, A&A, 669, A126 [NASA ADS] [CrossRef] [EDP Sciences] [Google Scholar]
- Pinte, C., Padgett, D. L., Ménard, F., et al. 2008, A&A, 489, 633 [NASA ADS] [CrossRef] [EDP Sciences] [Google Scholar]
- Pinte, C., Ménard, F., Duchêne, G., et al. 2018a, A&A, 609, A47 [NASA ADS] [CrossRef] [EDP Sciences] [Google Scholar]
- Pinte, C., Price, D., Ménard, F., et al. 2018b, ApJ, 860, L13 [NASA ADS] [CrossRef] [Google Scholar]
- Rich, E. A., Wisniewski, J. P., Currie, T., et al. 2019, ApJ, 875, 38 [Google Scholar]
- Rich, E. A., Teague, R., Monnier, J. D., et al. 2021, ApJ, 913, 138 [NASA ADS] [CrossRef] [Google Scholar]
- Rosenfeld, K. A., Andrews, S. M., Hughes, A. M., Wilner, D. J., & Qi, C. 2013, ApJ, 774, 16 [Google Scholar]
- Teague, R. 2020, https://doi.org/10.5281/zenodo.4321137 [Google Scholar]
- Teague, R., & Foreman-Mackey, D. 2018, Res. Notes Am. Astron. Soc., 2, 173 [Google Scholar]
- Teague, R., Bae, J., & Bergin, E. A. 2019, Nature, 574, 378 [NASA ADS] [CrossRef] [Google Scholar]
- Teague, R., Law, C. J., Huang, J., & Meng, F. 2021, J. Open Source Softw., 6, 3827 [NASA ADS] [CrossRef] [Google Scholar]
- Van Dishoeck, E. F., & Black, J. H. 1988, ApJ, 334, 771 [NASA ADS] [CrossRef] [Google Scholar]
- Villenave, M., Ménard, F., Dent, W., et al. 2020, A&A, 642, A164 [NASA ADS] [CrossRef] [EDP Sciences] [Google Scholar]
- Woodall, J., Agúndez, M., Markwick-Kemper, A. J., & Millar, T. J. 2007, A&A, 466, 1197 [CrossRef] [EDP Sciences] [Google Scholar]
All Tables
Summary of the noise root mean square (RMS) levels, peak S/N, and 3σ integrated flux from [CI] channel maps and a [CI] zeroth moment map.
All Figures
|
Fig. 1 HD 163296 ALMA band 8 zeroth moment map of [CI] line emission. The bottom left white ellipse shows the synthesized beam FWHM. The star position is indicated at (0, 0) by a white figure. Contours show 3σ, 6σ, 10σ, and 15σ (1σ = 2.63 × 10⁻² Jybeam−1 km s−1). Only the emission within the velocity range from 1.3 to 10.6 km s−1 and pixels with values higher than 2σ were used. The enclosed region, labeled by the letter A, highlights the position of an asymmetry feature detected in the channel maps (see Fig. A.1). |
| In the text | |
|
Fig. 2 HD 163296 ALMA band 8 dust continuum emission. The bottom left white ellipse shows the synthesized beam FWHM. The star position is indicated at (0,0) by a white figure. Contours show 5σ, 20σ, 50σ, and 250σ (1σ = 6.62 × 10⁻⁴ Jy beam−1). |
| In the text | |
|
Fig. 3 Extracted spectrum from the near and far sides of the disk from the channel maps shown in Fig. A.1. A flux excess coming from the near side of the disk is observed from 5.2 to 7.3 km s−1. The top left black bar shows an estimate of the propagated error in both spectra. |
| In the text | |
|
Fig. 4 Position-velocity diagrams for CO and [CI] emission in HD 163296. The diagram was made using the CASA task impv. The position axis is the apparent major axis of the gas disk. The starting position is (αJ2000, δJ2000) = (17h56m21s.548, −21°57′25″.902), while the end position is (αJ2000, δJ2000) = (17h56m21s.001, −21°57′19″.436). Only pixels with values higher than 3σ were used. The dashed horizontal line shows the system velocity, the curved dashed line shows the maximum radial velocity according to Eq. (1), and the straight solid black lines were obtained according to Eq. (2), enclosing where the emission is. |
| In the text | |
|
Fig. 5 [CI], CO, and dust continuum average radial profiles comparison for HD 163296. All of the profiles were normalized by its respective maximum value. Shaded regions represent ±1σ deviations from the average values. Color boxes show synthesized beam major axis for each dataset and dashed lines show R90 cutoff. |
| In the text | |
|
Fig. 6 Left: average surface emission height plotted against deprojected radial distance from the star of both CO and [CI] obtained with disksurf. The shaded region shows 1σ scatter of the original obtained points shown in Fig. B.3. Right: best fitted model for [CI] and CO surface emission. For the first, a simple exponentially tapered power law function (as is described in Eq. (3)) was used; meanwhile, for CO, a double exponentially tapered power law function is considered to get a better modeling of its double-peaked shape. The shaded region was obtained by sampling the posterior distribution of the parameters. |
| In the text | |
|
Fig. 7 Abundance maps for CO an [CI] in HD 163296 obtained with DALI modeling. The dashed white lines enclose areas with 75 and 50% of the emission expected for CO J = 2 − 1 and [CI]= 3P1 − 3P0. The solid white line shows the line emission, τ = 1, and τ = 0.1 surfaces of CO and [CI] line emission, respectively. |
| In the text | |
|
Fig. 8 Same as the right panel of Fig. 6 but with the addition of 75% line emission contours from HD 163296 DALI models. |
| In the text | |
|
Fig. 9 Left: same as Fig. 6 but with the addition of the measured height in convolved CO data shown in green. Right: same as Fig. 6 but with the addition of a dashed green line and points showing µm-sized dust grain height power law fitting and data points from Rich et al. (2021), respectively. |
| In the text | |
|
Fig. A.1 [CI] = 3P1 − 3P0 line emission channel maps observed in HD163296. Each panel has dimensions of 9.64” × 9.64” and, at the bottom left, is labeled by its velocity relative to the rest frequency of the [CI] line. At the top left, the peak S/N is shown. The panel of 7.0 km s−1 shows the synthesized beam FWHM with a white ellipse. The enclosed region in the panel of 5.5 km s−1, labeled by the letter A, highlights an asymmetry feature in the emission. |
| In the text | |
|
Fig. B.1 Posterior distribution of parameters ψ, qt, rt, and ɀ0 described in eq. (3) and A, µ, and σ from the Gaussian depression for 12CO J = 2 − 1 data. Marginalized distributions are shown in the diagonal and their vertical dashed lines represent the 16th, 50th, and 84th percentiles. |
| In the text | |
|
Fig. B.2 Posterior distribution of parameters ψ, qt, rt, and ɀ0 from eq. (3), for the fitting surface height in the [CI] data. Marginalized distributions are shown in the diagonal and their vertical dashed lines represent the 16th, 50th, and 84th percentiles. |
| In the text | |
|
Fig. B.3 (a.1, b.1): Purple data points show the surface height obtained with disksurf, applied to the data presented in 2. Solid blue and red lines show the best-fitted model for CO and [CI], respectively. (a.2, b.2): Residuals as a function of radial distance. (a.3, b.3): Normalized histogram of the residuals. The solid orange line shows a normal distribution with mean and standard deviations measured from residuals. |
| In the text | |
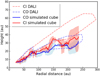 |
Fig. D.1 Similar to Fig. 8 but with the extracted profiles of the simulated datacubes. |
| In the text | |
Current usage metrics show cumulative count of Article Views (full-text article views including HTML views, PDF and ePub downloads, according to the available data) and Abstracts Views on Vision4Press platform.
Data correspond to usage on the plateform after 2015. The current usage metrics is available 48-96 hours after online publication and is updated daily on week days.
Initial download of the metrics may take a while.