Open Access
Fig. 5
Download original image
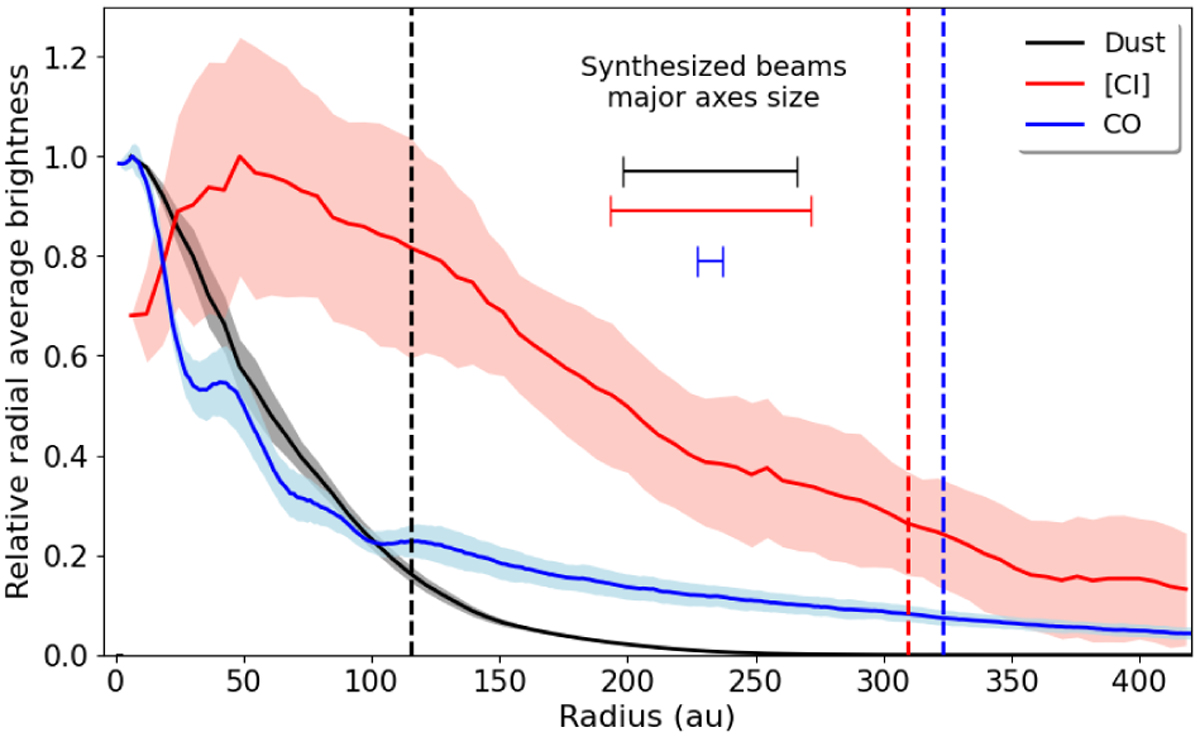
[CI], CO, and dust continuum average radial profiles comparison for HD 163296. All of the profiles were normalized by its respective maximum value. Shaded regions represent ±1σ deviations from the average values. Color boxes show synthesized beam major axis for each dataset and dashed lines show R90 cutoff.
Current usage metrics show cumulative count of Article Views (full-text article views including HTML views, PDF and ePub downloads, according to the available data) and Abstracts Views on Vision4Press platform.
Data correspond to usage on the plateform after 2015. The current usage metrics is available 48-96 hours after online publication and is updated daily on week days.
Initial download of the metrics may take a while.