Fig. 4
Download original image
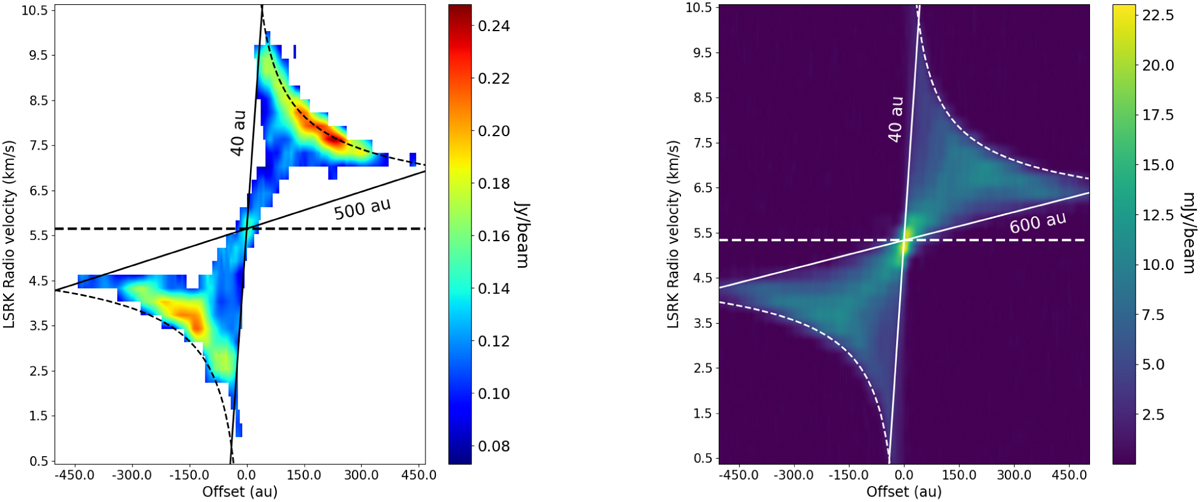
Position-velocity diagrams for CO and [CI] emission in HD 163296. The diagram was made using the CASA task impv. The position axis is the apparent major axis of the gas disk. The starting position is (αJ2000, δJ2000) = (17h56m21s.548, −21°57′25″.902), while the end position is (αJ2000, δJ2000) = (17h56m21s.001, −21°57′19″.436). Only pixels with values higher than 3σ were used. The dashed horizontal line shows the system velocity, the curved dashed line shows the maximum radial velocity according to Eq. (1), and the straight solid black lines were obtained according to Eq. (2), enclosing where the emission is.
Current usage metrics show cumulative count of Article Views (full-text article views including HTML views, PDF and ePub downloads, according to the available data) and Abstracts Views on Vision4Press platform.
Data correspond to usage on the plateform after 2015. The current usage metrics is available 48-96 hours after online publication and is updated daily on week days.
Initial download of the metrics may take a while.